claude-code-usage-analyzer
Health Warn
- License — License: MIT
- Description — Repository has a description
- Active repo — Last push 0 days ago
- Low visibility — Only 5 GitHub stars
Code Pass
- Code scan — Scanned 12 files during light audit, no dangerous patterns found
Permissions Pass
- Permissions — No dangerous permissions requested
No AI report is available for this listing yet.
Comprehensive cost & token usage analyzer for Claude Code with detailed breakdowns by model and token type. Uses ccusage CLI tool and LiteLLM pricing data. The raw token usage data is available in ${HOME}/.claude/projects/<project-name>/<conversation-id>.jsonl files.
Claude Code Usage Analyzer
A command-line tool that turns your Claude Code usage into a detailed cost-and-token report, broken down by day, by model, and by token type (input, output, cache creation, cache read). It resolves pricing dynamically from LiteLLM, so it stays correct as new Claude models ship without any code change.
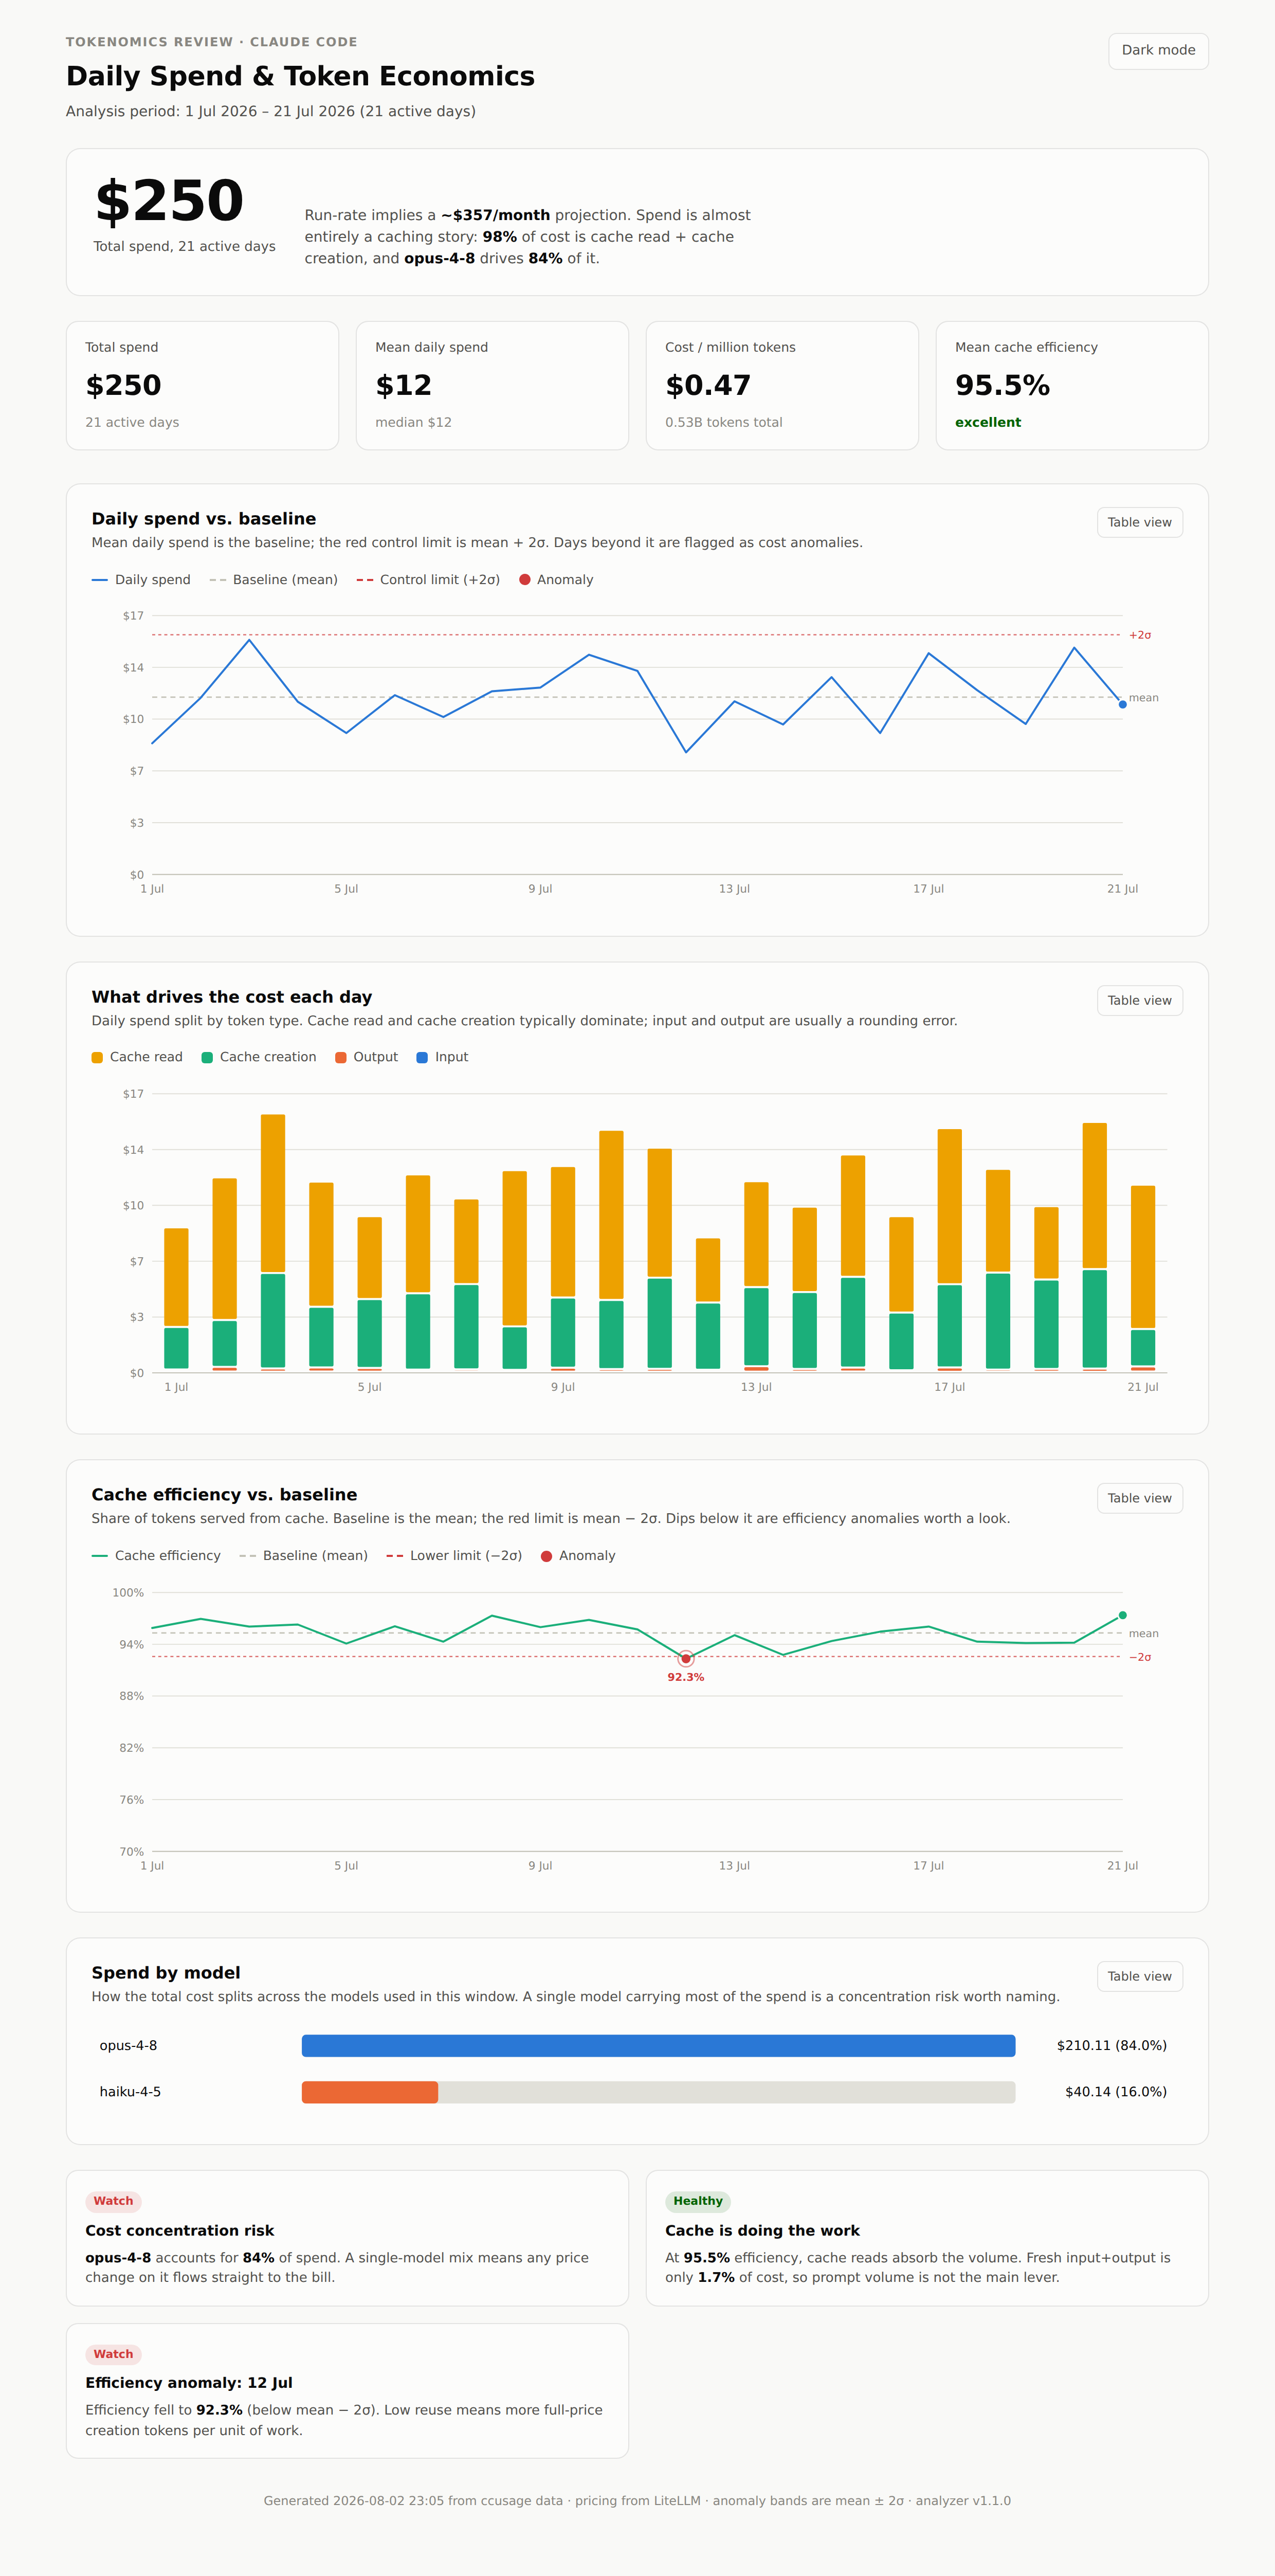
The self-contained HTML dashboard shown above (rendered from fictional sample data). See examples/sample-tokenomics-dashboard.html for the interactive version.
Easiest way to get started: the tokenomics-dashboard skill
The simplest way to run this tool is the tokenomics-dashboard skill. If you are using Claude Code, just run /tokenomics-dashboard and answer one question (how many days of history to analyze). The skill fetches your usage with ccusage, prices it from LiteLLM, generates the dashboard, and presents it with a director-level cost commentary. You do not need to remember any command-line flags.
Prefer to drive the CLI yourself? The manual steps are in Usage below.
Contents
- Easiest way to get started: the tokenomics-dashboard skill
- Features
- How it works
- Prerequisites
- Installation
- Usage
- Command-line options
- Output files
- Understanding the output
- Rendering the Quarto report
- Development
- Project structure
- Data sources
- Troubleshooting
- License
Features
- Dynamic pricing: resolves every model in your usage data against the LiteLLM pricing table, so newly released models are priced automatically with no code change.
- Detailed cost analysis: daily cost broken down by token type (input, output, cache creation, cache read), with mean, median, P95, min, and max.
- Per-model statistics: usage, cost, and cache efficiency for each model you used.
- Per-request statistics: token distribution across individual requests (mean, median, P75, P95, P99, max).
- Model combination analysis: which models were used together on the same day, and for how many days.
- Cache efficiency tracking: how much of your token volume came from (much cheaper) cache reads.
- Per-minute usage estimates: mean, median, and P95 usage projected onto an 8-hour workday.
- Self-contained HTML dashboard: a single-file tokenomics dashboard (no server, no dependencies, no CDN) with time-series charts, mean baselines, mean +/- 2 sigma control limits, anomaly flagging, a light/dark toggle, tooltips, and a table view behind every chart.
- Multiple output formats: a machine-readable JSON, a human-readable Markdown report, the HTML dashboard, and optional PNG charts.
How it works
The tool runs in a strict two-phase pipeline so that all numbers are computed once and every report shows the same figures:
- Analysis phase: read the raw
ccusagedata, resolve pricing from LiteLLM, and compute every statistic (including a per-day time series) into a single analysis dictionary (saved as JSON). - Reporting phase: format that dictionary into a Markdown report, the HTML dashboard, and PNG charts. No calculation happens here.
Pricing is resolved dynamically: the tool collects the model names that actually appear in your data and looks each one up in the LiteLLM table (preferring an exact match). A model with no pricing entry is logged as a warning and simply shows a zero cost breakdown, rather than causing a crash.
Prerequisites
- Python 3.10 or higher
- uv package manager
- Claude Code with usage data
- Node.js and npm (for
npxto run ccusage) - Internet access (to fetch current pricing from LiteLLM)
Install Node.js/npm (if not already installed)
The tool uses npx ccusage to fetch Claude Code usage data. Install Node.js if you do not have it:
# On Ubuntu/Debian
sudo apt update && sudo apt install nodejs npm

# On macOS with Homebrew
brew install node

# Or download from https://nodejs.org/
Verify:
node --version
npm --version
Installation
Install uv (if not already installed)
curl -LsSf https://astral.sh/uv/install.sh | sh
source $HOME/.local/bin/env
Clone and run
git clone https://github.com/yourusername/claude-code-usage-analyzer.git
cd claude-code-usage-analyzer

# The core tool needs no dependencies, so you can run it straight away:
uv run claude-usage-analyzer
The core tool depends only on the Python standard library. Charts are an optional extra:
# Install the optional matplotlib/numpy extra to also generate PNG charts
uv sync --extra charts
Usage
Quick start
The analyzer fetches your usage data automatically the first time it runs:
# Fetch data (if needed), analyze, and write reports
uv run claude-usage-analyzer

# Start from a specific date (YYYYMMDD)
uv run claude-usage-analyzer --since 20260101

# Force a re-fetch even if a cache exists
uv run claude-usage-analyzer --refresh

# Verbose debug logging
uv run claude-usage-analyzer --debug
On the first run the tool will:
- Check whether
data/raw/claude-usage-raw.jsonexists. - If not, run
npx ccusage@latestto fetch your data. - Resolve pricing from LiteLLM for the models found.
- Perform the analysis and write JSON, Markdown, and Quarto reports (plus charts if matplotlib is installed) to
data/output/.
Manual data fetch (optional)
If you prefer to fetch data yourself, or the automatic fetch fails:
mkdir -p data/raw
npx ccusage@latest daily --since 20260101 --breakdown --json > data/raw/claude-usage-raw.json
uv run claude-usage-analyzer
Command-line options
| Option | Default | Description |
|---|---|---|
--since |
20250101 |
Start date for usage data (YYYYMMDD). |
--refresh |
off | Force a re-fetch of raw data even if a cache exists. |
--raw-data-path |
data/raw/claude-usage-raw.json |
Path to the raw ccusage cache. |
--output-dir |
data/output |
Directory for the generated reports. |
--debug |
off | Enable verbose debug logging. |
Run uv run claude-usage-analyzer --help for the full list.
Output files
Written to the output directory (default data/output/):
claude-usage-analysis.json- the complete analysis (all statistics, the daily time series, model combinations, pricing). Use this for automation.claude-usage-report.md- a human-readable Markdown report.tokenomics-dashboard.html- a self-contained HTML dashboard (open directly in a browser; no server or dependencies).token-distribution.pngandtoken-histogram.png- charts (only when thechartsextra is installed).
Raw usage data is cached at data/raw/claude-usage-raw.json for faster subsequent runs.
Understanding the output
Cache efficiency
Calculated as (Cache Read Tokens / Total Tokens) x 100. Higher is better: cache reads cost far less than fresh tokens, so a high cache-read share means lower cost and faster responses.
Cost breakdown by token type
Your cost is composed of input tokens (new prompts), output tokens (model responses), cache creation (first-time caching of context), and cache reads (reusing cached context, the cheapest).
Model combinations
Shows which models were used together on the same day, which helps identify usage patterns and transitions between models.
Sample output
See the examples/ directory for fictional sample outputs:
The HTML dashboard
tokenomics-dashboard.html is a single self-contained file: all CSS and JavaScript are inline, the charts are hand-drawn SVG, and there are no external requests (no CDN, web fonts, or chart libraries). Open it directly in any browser, or email or archive it as-is.
It is oriented toward cost governance and includes:
- A hero spend figure and a KPI row (total spend, mean daily spend, cost per million tokens, cache efficiency).
- A daily-spend time series with the mean as a baseline and a red mean + 2 sigma control limit; days beyond it are flagged as cost anomalies.
- A stacked daily cost-composition chart (input, output, cache creation, cache read).
- A cache-efficiency time series with the mean baseline and a red mean - 2 sigma lower limit; dips below it are flagged.
- Data-driven insight cards (cost concentration, cache health, and any detected anomalies).
- A light/dark toggle, hover tooltips, and a table view behind every chart.
Development
This project follows the coding standards in CLAUDE.md. Install the dev tools and run the full quality gate before committing:
# Install dev dependencies (ruff, mypy, bandit, pytest, matplotlib)
uv sync --group dev

# Run everything
uv run ruff check --fix . && uv run ruff format . && uv run bandit -r src/ && uv run mypy src/ && uv run pytest
Tests
uv run pytest -q
Tests stub the network and subprocess layers, so they run offline and fast.
Security gate
A security-check skill (.claude/skills/security-check/) reviews the pending diff against a catalog of security anti-patterns (subprocess safety, SSRF, untrusted-input parsing, secret/PII leakage) and must pass before committing or opening a PR. See CLAUDE.md for details.
Project structure
claude_code_usage_analyzer/
|-- src/claude_code_usage_analyzer/
|   |-- __main__.py        # CLI orchestration
|   |-- constants.py       # shared constants
|   |-- data_source.py     # ccusage subprocess + loading
|   |-- pricing.py         # dynamic LiteLLM pricing resolution
|   |-- analysis.py        # pure statistical analysis (no I/O)
|   |-- reporting.py       # Markdown report generation
|   |-- dashboard.py       # self-contained HTML dashboard
|   `-- charts.py          # optional matplotlib charts
|-- tests/                 # pytest suite
|-- examples/              # fictional sample outputs
|-- data/                  # generated output (gitignored)
|-- pyproject.toml
|-- CLAUDE.md              # coding standards
`-- README.md
Data sources
This tool analyzes Claude Code usage data from two sources:
- ccusage: an npm package that reads Claude Code's local usage files and aggregates them per day and per model. The analyzer shells out to it via
npx. - Raw conversation data: token usage is stored by Claude Code in
${HOME}/.claude/projects/<project-name>/<conversation-id>.jsonlfiles. ccusage reads these; you can also inspect them directly for custom analysis.
Pricing comes from the LiteLLM model_prices_and_context_window.json table, fetched over HTTPS at run time.
Troubleshooting
"The 'npx' command was not found"
Install Node.js and npm (see Prerequisites), or fetch the data manually and pass --raw-data-path.
"Failed to fetch pricing from LiteLLM"
The tool needs internet access to fetch current pricing. Check your connection and retry.
A model shows a zero cost breakdown
The tool logs a warning when a model in your data has no matching LiteLLM pricing entry. Token counts are still reported; only the computed cost breakdown is zero for that model. Check whether the model name has a pricing entry at the LiteLLM table.
Charts are not generated
Charts require the optional extra. Install it with uv sync --extra charts.
License
MIT License - see LICENSE for details.
Acknowledgments
- Built for Claude Code users.
- Pricing data from LiteLLM.
- Usage data from the ccusage CLI tool.
Reviews (0)
Sign in to leave a review.
Leave a reviewNo results found