SeeCode
Health Pass
- License — License: MIT
- Description — Repository has a description
- Active repo — Last push 0 days ago
- Community trust — 121 GitHub stars
Code Pass
- Code scan — Scanned 12 files during light audit, no dangerous patterns found
Permissions Pass
- Permissions — No dangerous permissions requested
No AI report is available for this listing yet.
Animated, explorable diagrams for Claude and other coding agents, from a short JSON spec.

Diagrams that move, explain and export themselves.
Ask your agent for a diagram. SeeCode turns a short spec into an editorial-quality, animated, explorable diagram: one HTML file you can hover, click and walk through, or export as SVG, PNG, GIF or MP4 for wherever it needs to go.
Install · Diagram types · Features · Themes · Import · Export · CLI




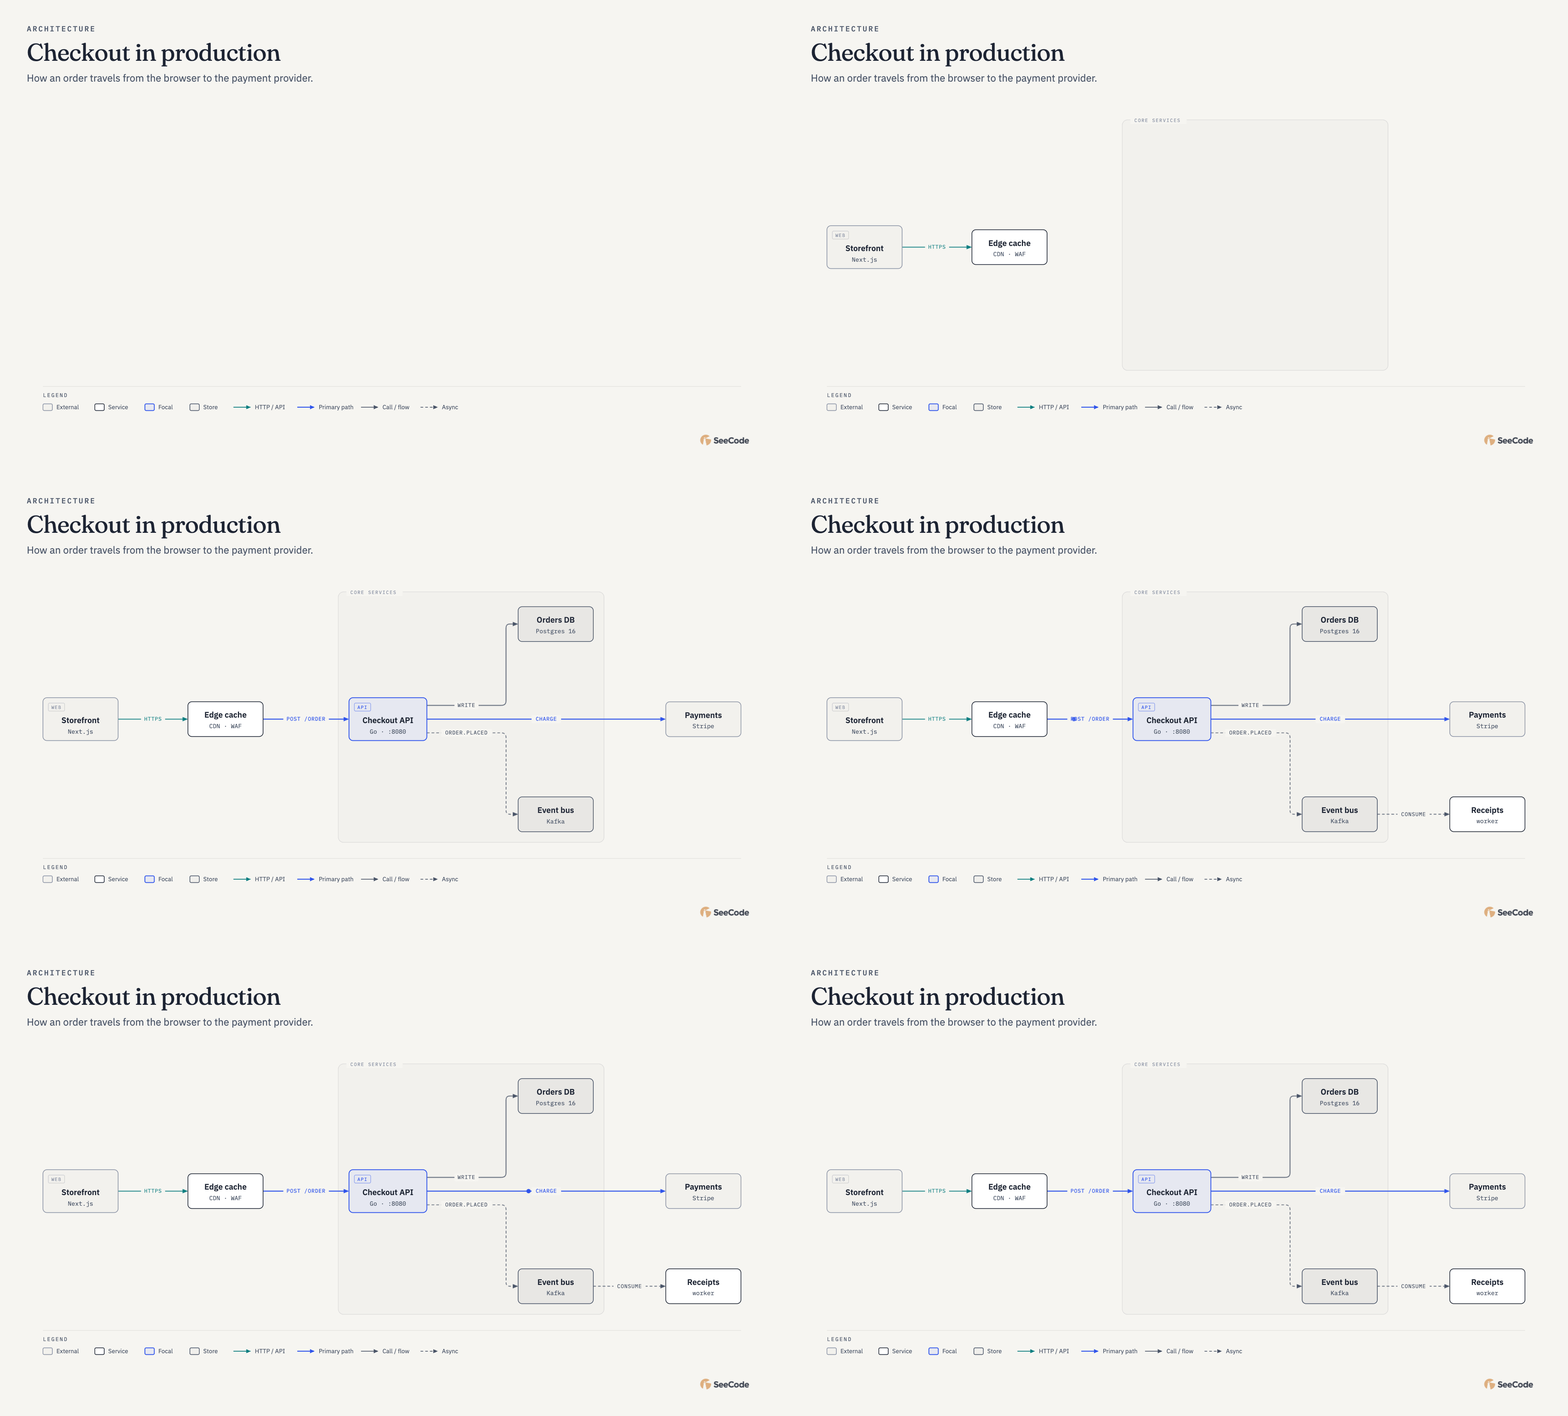
Exported straight from the diagram. ▶ See the viewer in action: hover trace, focus panel, route journey.
Install, then describe what you want to see
npx skills add Aryanutkarsh/seecode -g
Works with Claude Code, Cursor, Codex, OpenCode and other Agent Skills hosts. More install options.
Then ask:
Use SeeCode to show how checkout works: the browser calls the API,
the API writes to Postgres, charges Stripe and publishes an event to Kafka.
Keep going in plain language: "highlight the payment path", "make it dark", "export it for my slides". The first time you use it in a project, SeeCode asks once whether to use your global settings or create project-specific ones.
45 diagram types
Every type animates its own way (systems trace their flows, sequences play message by message, charts grow), and every type can also be fully static. Click any diagram for the full-size image. Charts take their numbers from a CSV or JSON file, so the data never has to pass through the model.
 Architecture Components and connections |
 High-level 4–7-box overview for non-engineers |
 Deployment Where things run (hosts, regions) |
 Dependency graph What imports or depends on what |
 Architecture delta What a change adds, removes or alters |
 IT current state Current IT landscape with health status |
 UML class Classes and interfaces |
 ER / data model Entities and cardinality |
 Database schema Tables and FK columns |
 Flowchart Decisions and branches |
 Sequence Messages between actors over time |
 State machine States and transitions |
 Swimlane Who does which step |
 Process Short linear numbered steps |
 Data flow Data moving through stages |
 User journey User steps and emotion curve |
 Timeline Dated events |
 Gantt Work over time |
 Kanban Items by status |
 Story map Backbone and release slices |
 Loop / flywheel Reinforcing cycle or flywheel |
 Medallion Bronze/silver/gold layers |
 Platform integration Sources → integration → platform → serving |
 Access matrix Roles × data access |
 Tree Parent → children |
 Org chart People and teams |
 Nested Containment and scopes |
 Layer stack A stack |
 Venn Overlaps |
 Pyramid / funnel Ranking |
 Quadrant A 2×2 |
 Fishbone Root causes |
 Wardley map Evolution × visibility |
 Exploded view Parts of one thing, isometric |
 Isometric plan A floor or site from above |
 Isometric object Any object, from a description |
 Bar Compare amounts |
 Line Change over time |
 Scatter Two measures |
 Waterfall Running total |
 Treemap Part of whole |
 Heatmap Intensity grid |
 Radar Profile on shared axes |
 Polar Cyclical values |
 Sankey Flow volumes |
Plus 15 variants: dumbbell, marimekko, slopegraph, bump, streamgraph, ridgeline, bubble, beeswarm, funnel, consultant quadrant, terminal loop, OAuth sequence, lifecycle state, block decomposition and vertical high-level. Specs for every example are in examples/specs.
Isometric: compose anything
Three types draw in isometric 3D: isometric objects (anything, from a plain description: ask for "an office chair" and the agent lists its parts and SeeCode draws it), exploded views (the parts of one thing, lifted apart and labelled, assembling on load) and isometric plans (a floor or a site, built up phase by phase). There is no fixed library of drawings: every part is a solid or a beam you place in 3D and dress with items on its top and sides (screens, chips, keys, cards, windows, shelves), make hollow, round, ribbed, lay on its side, or cap with a dome or a roof. So the same few lines of spec draw a chair, a van, a phone, a burger or a street. How it works
Use SeeCode to draw an office chair in isometric, and label the parts.
Office chair Star base, gas lift, cushion |
 Laptop Keys, trackpad, display |
 Espresso machine Group head, wand, cups |
 Delivery van Wheels on their side |
Phone teardown Tray housing, camera module, display |
 Mechanical keyboard Case, PCB, plate, switches, keycaps |
 AI agent stack Vault, tools, skills, harness, interface |
 Anatomy of a burger Domed bun with sesame, ribbed layers |
 One rack, unpacked Ports, drive bays and vents on the walls |
 Office, floor by floor Desks, monitors, solar panels |
North campus Buildings, roads and trees, by phase |
 Corner coffee shop Bar, kitchen, tables, queue posts |
 A small street Gable, hip and shed roofs, a dome |
Also in the gallery: a fulfilment warehouse with storage racks. Specs are in examples/specs/isometric.
Not just code
The same types draw everyday things: a leave plan, where your pay goes, a back-and-forth with a landlord, where a job application stands. Labels can be in any language (set lang, and Chinese, Japanese and Korean labels wrap between characters), and the legend can use your own words.
 A year of leave Timeline |
 Where the pay goes Sankey |
 租房的来回沟通 (renting) Sequence, in Chinese |
 求职申请走到哪一步了 (job search) State, in Chinese, with a custom legend |
See it in action
Every HTML diagram is one self-contained file you can explore. Send it to anyone and the interactions go with it. These clips are recorded from real diagrams:
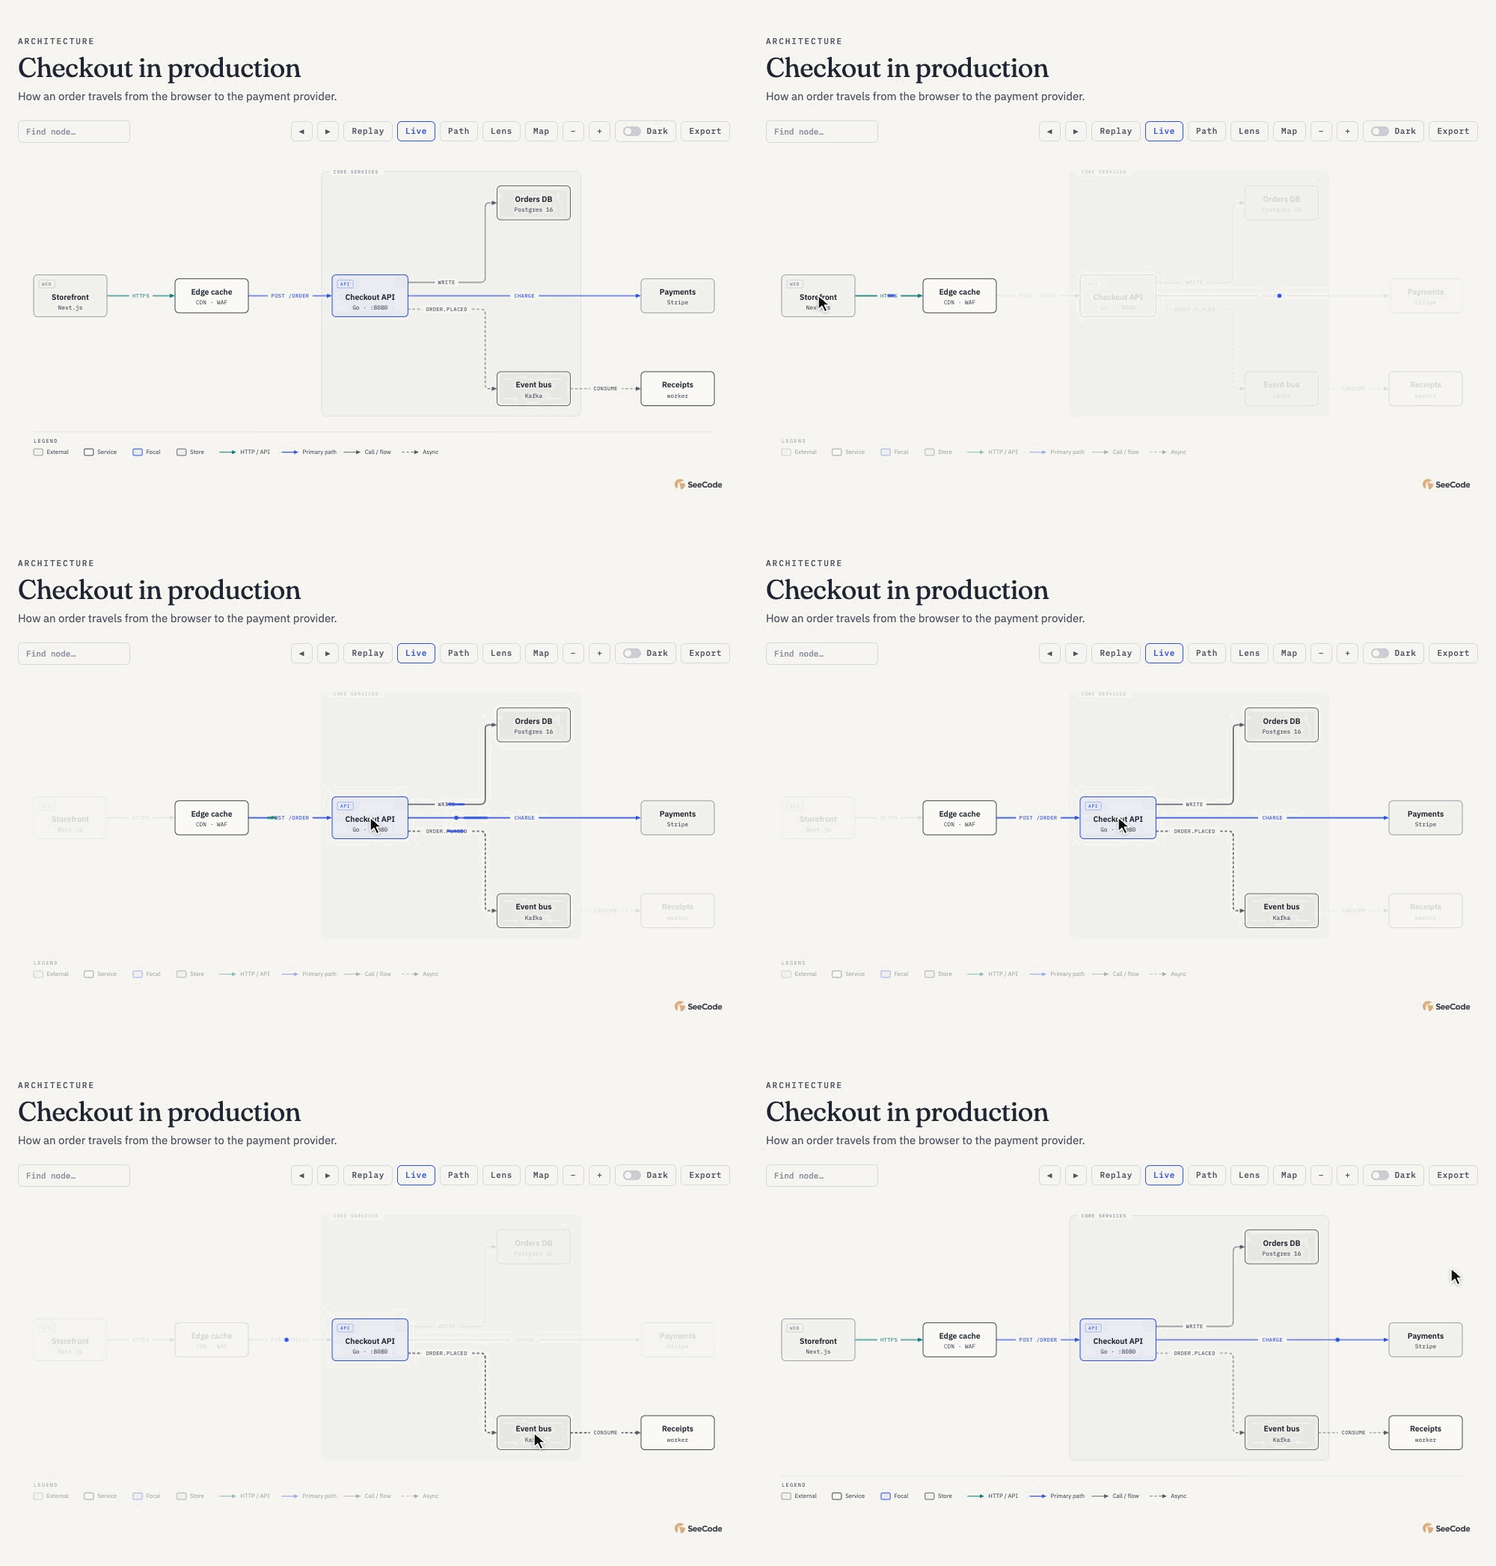 Hover to trace Point at a node and its connections light up with a moving trace: outgoing in the accent colour, incoming in teal. Everything else steps back. |
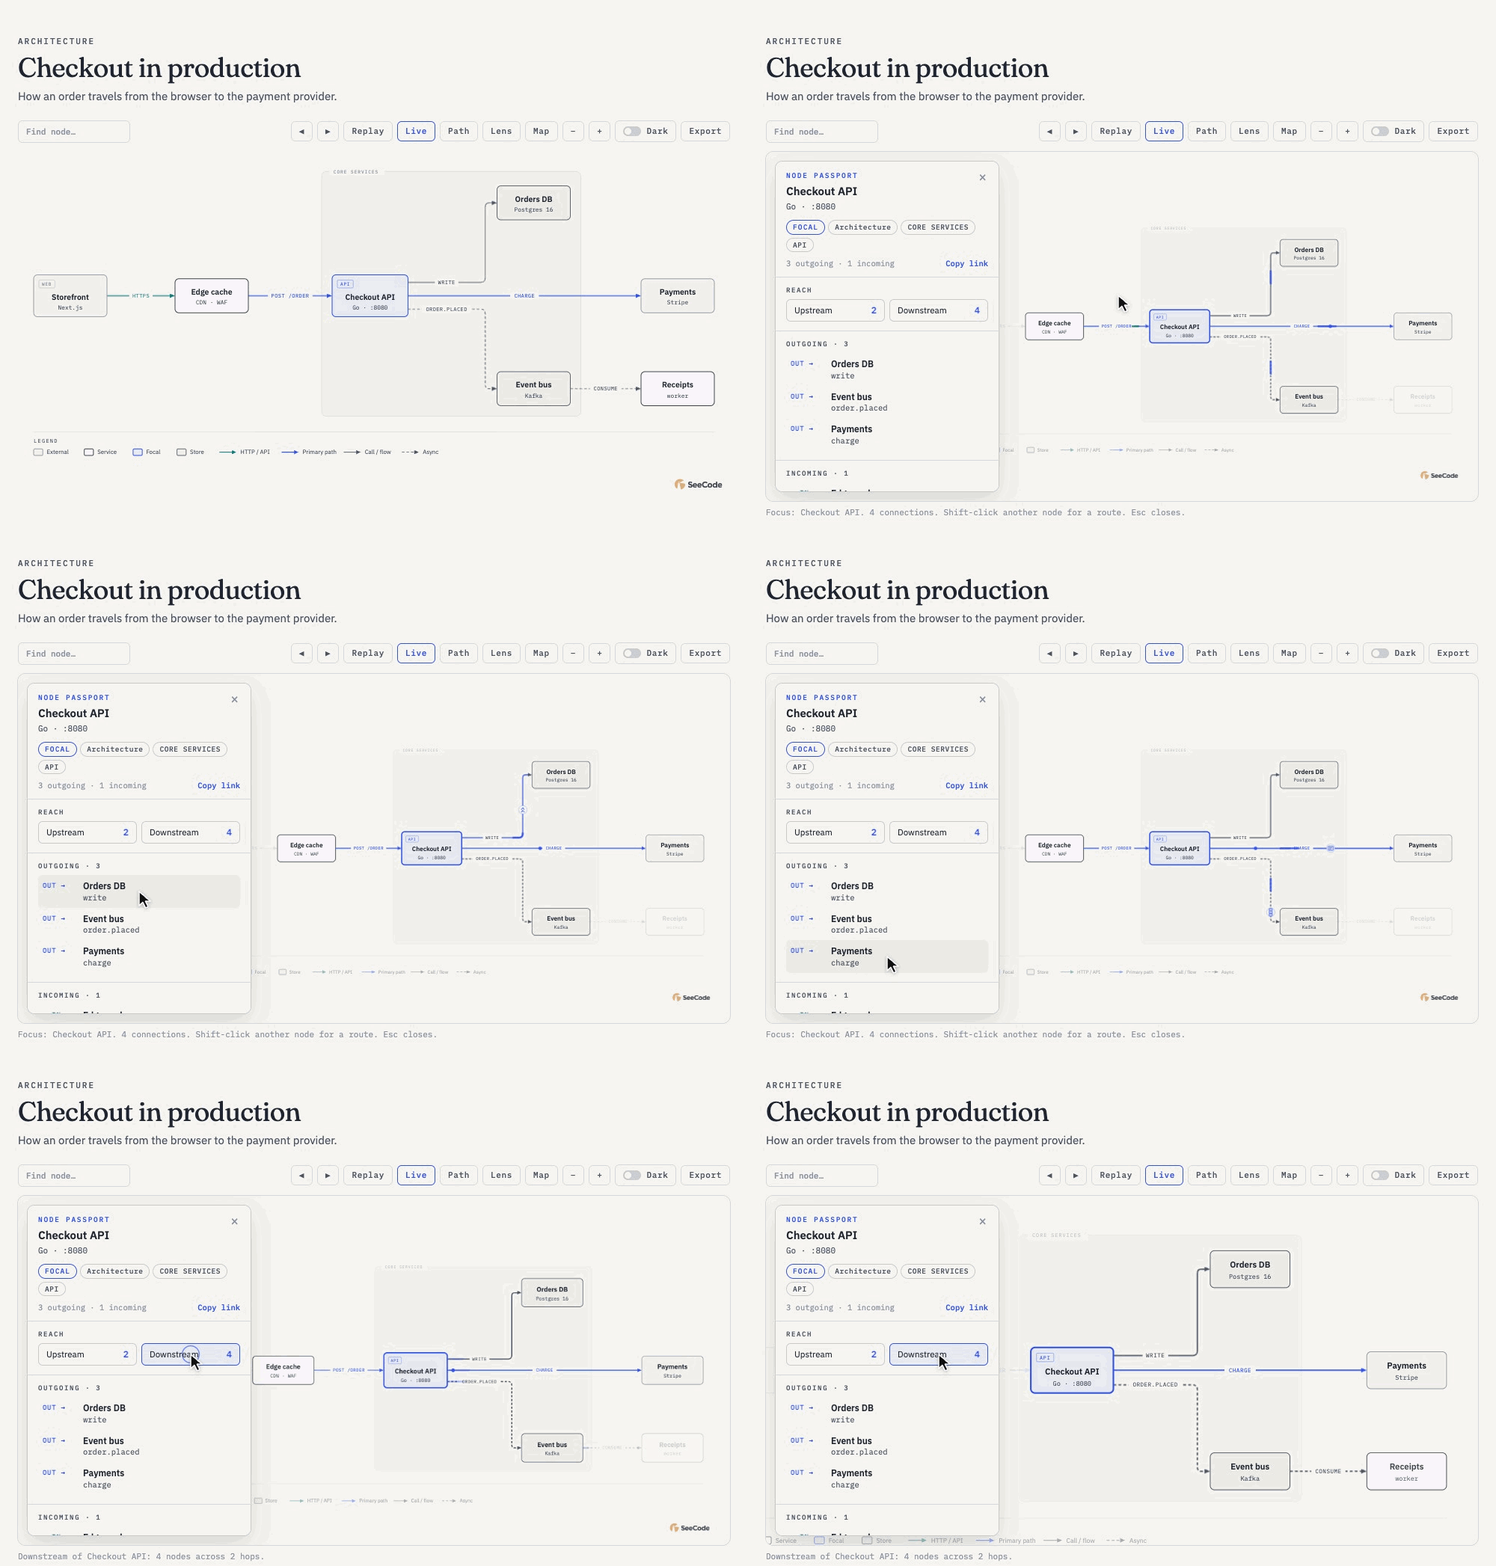 Click to focus The camera zooms in and a panel opens with the node's role, reach and every connection. Hover a connection to send a token along it, or show everything downstream. |
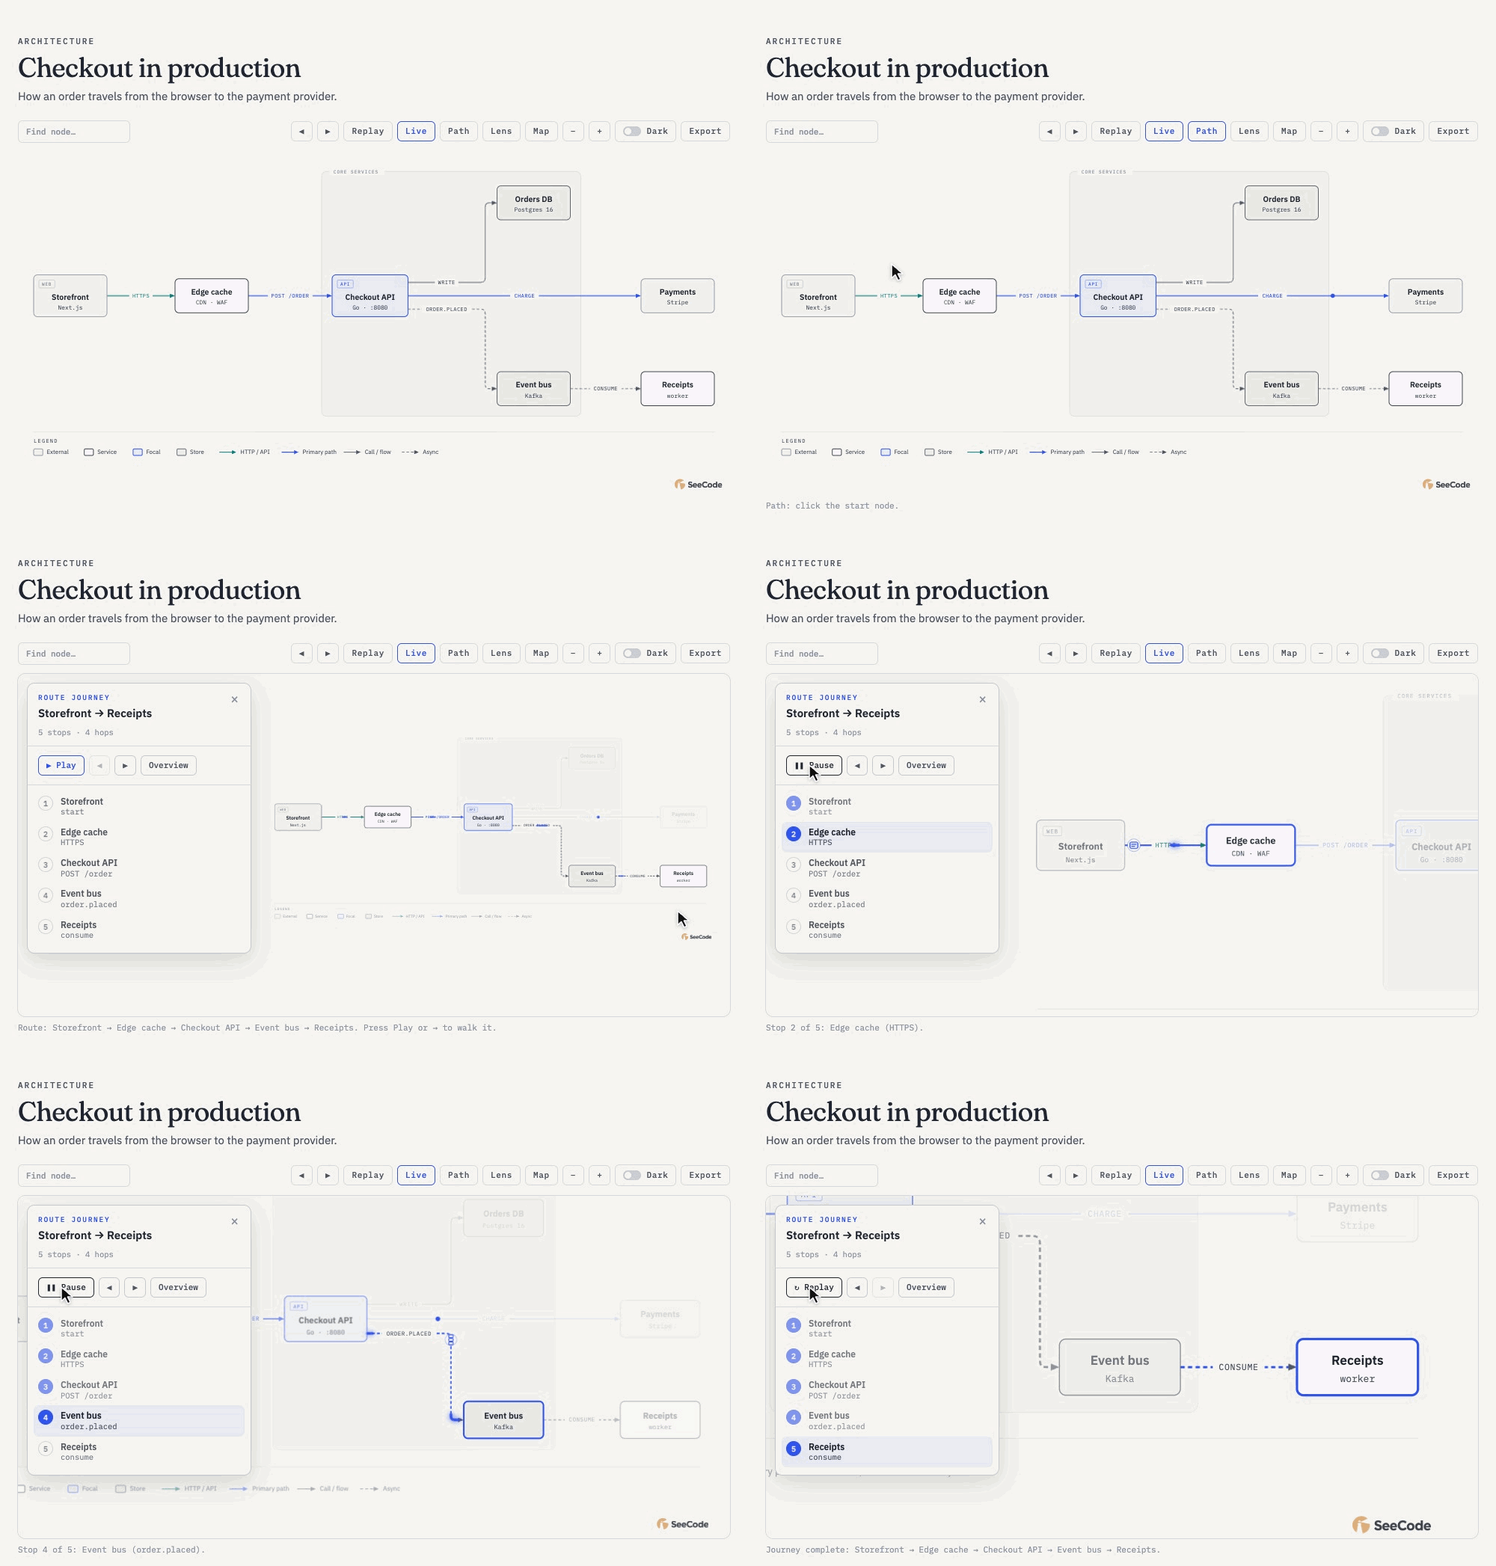 Walk a route Pick a start and an end, press Play, and the camera follows the request hop by hop, with each step listed in the panel. |
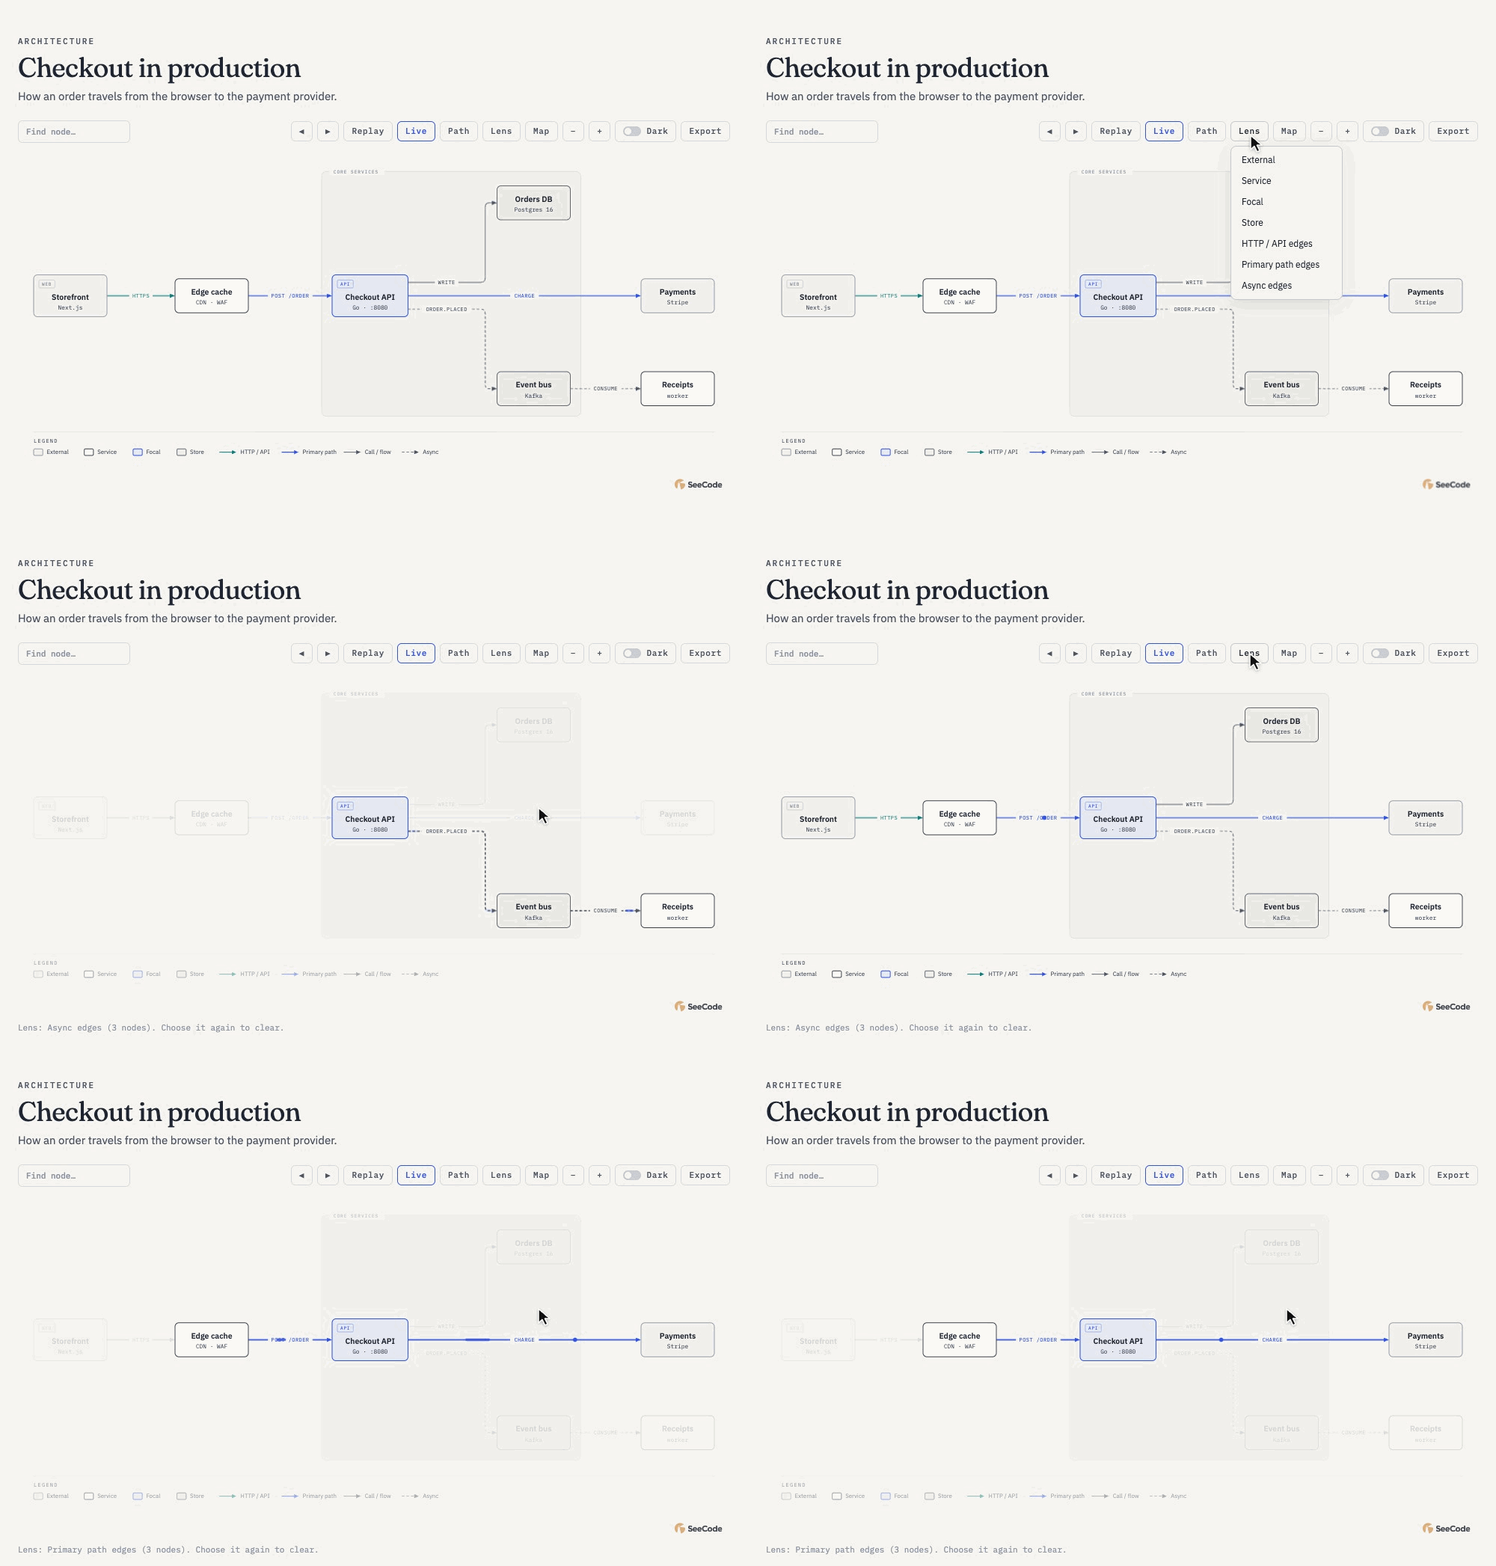 Look through a lens Highlight one kind of node or connection (async events, the primary path, stores) to read one layer of the system at a time. |
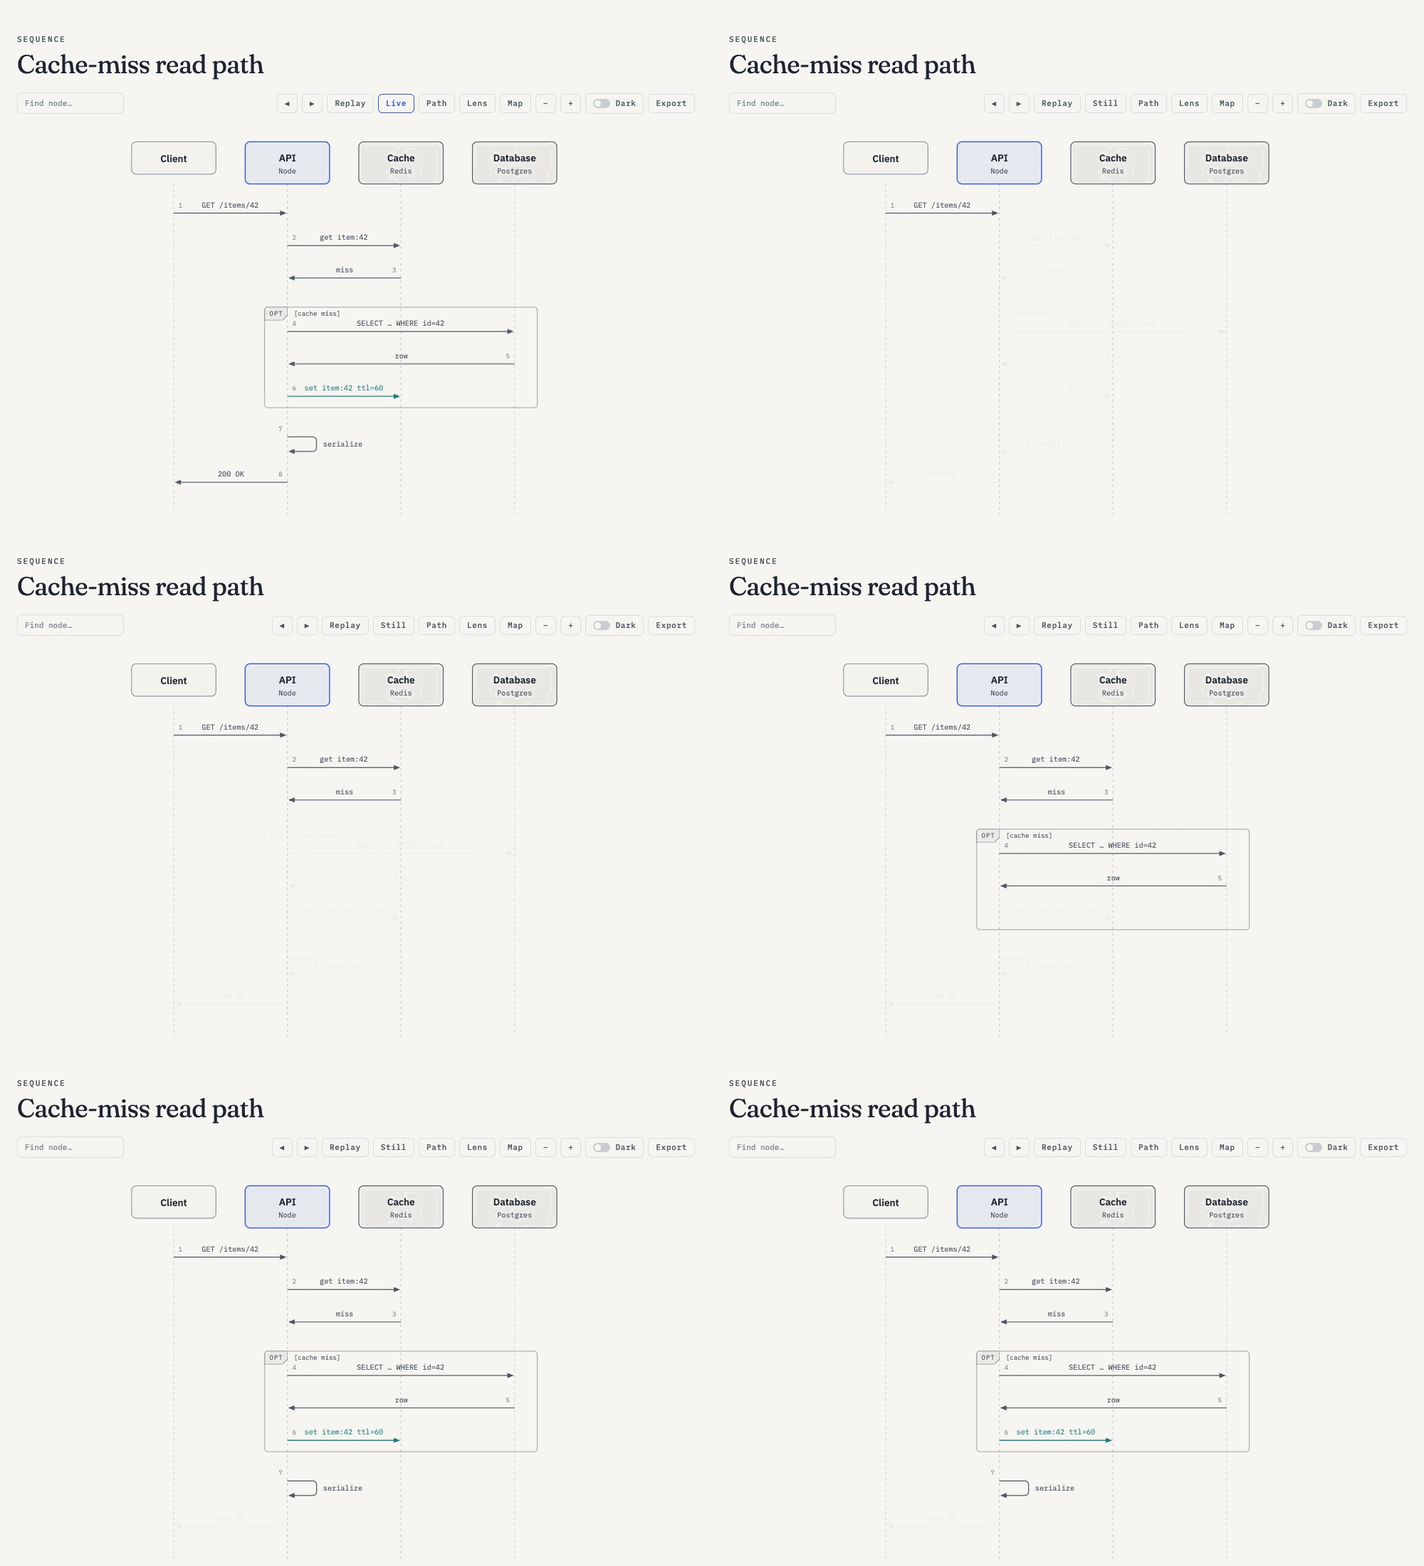 Step through it Use ← → to walk the diagram's build-up one step at a time, which is ideal for presenting. |
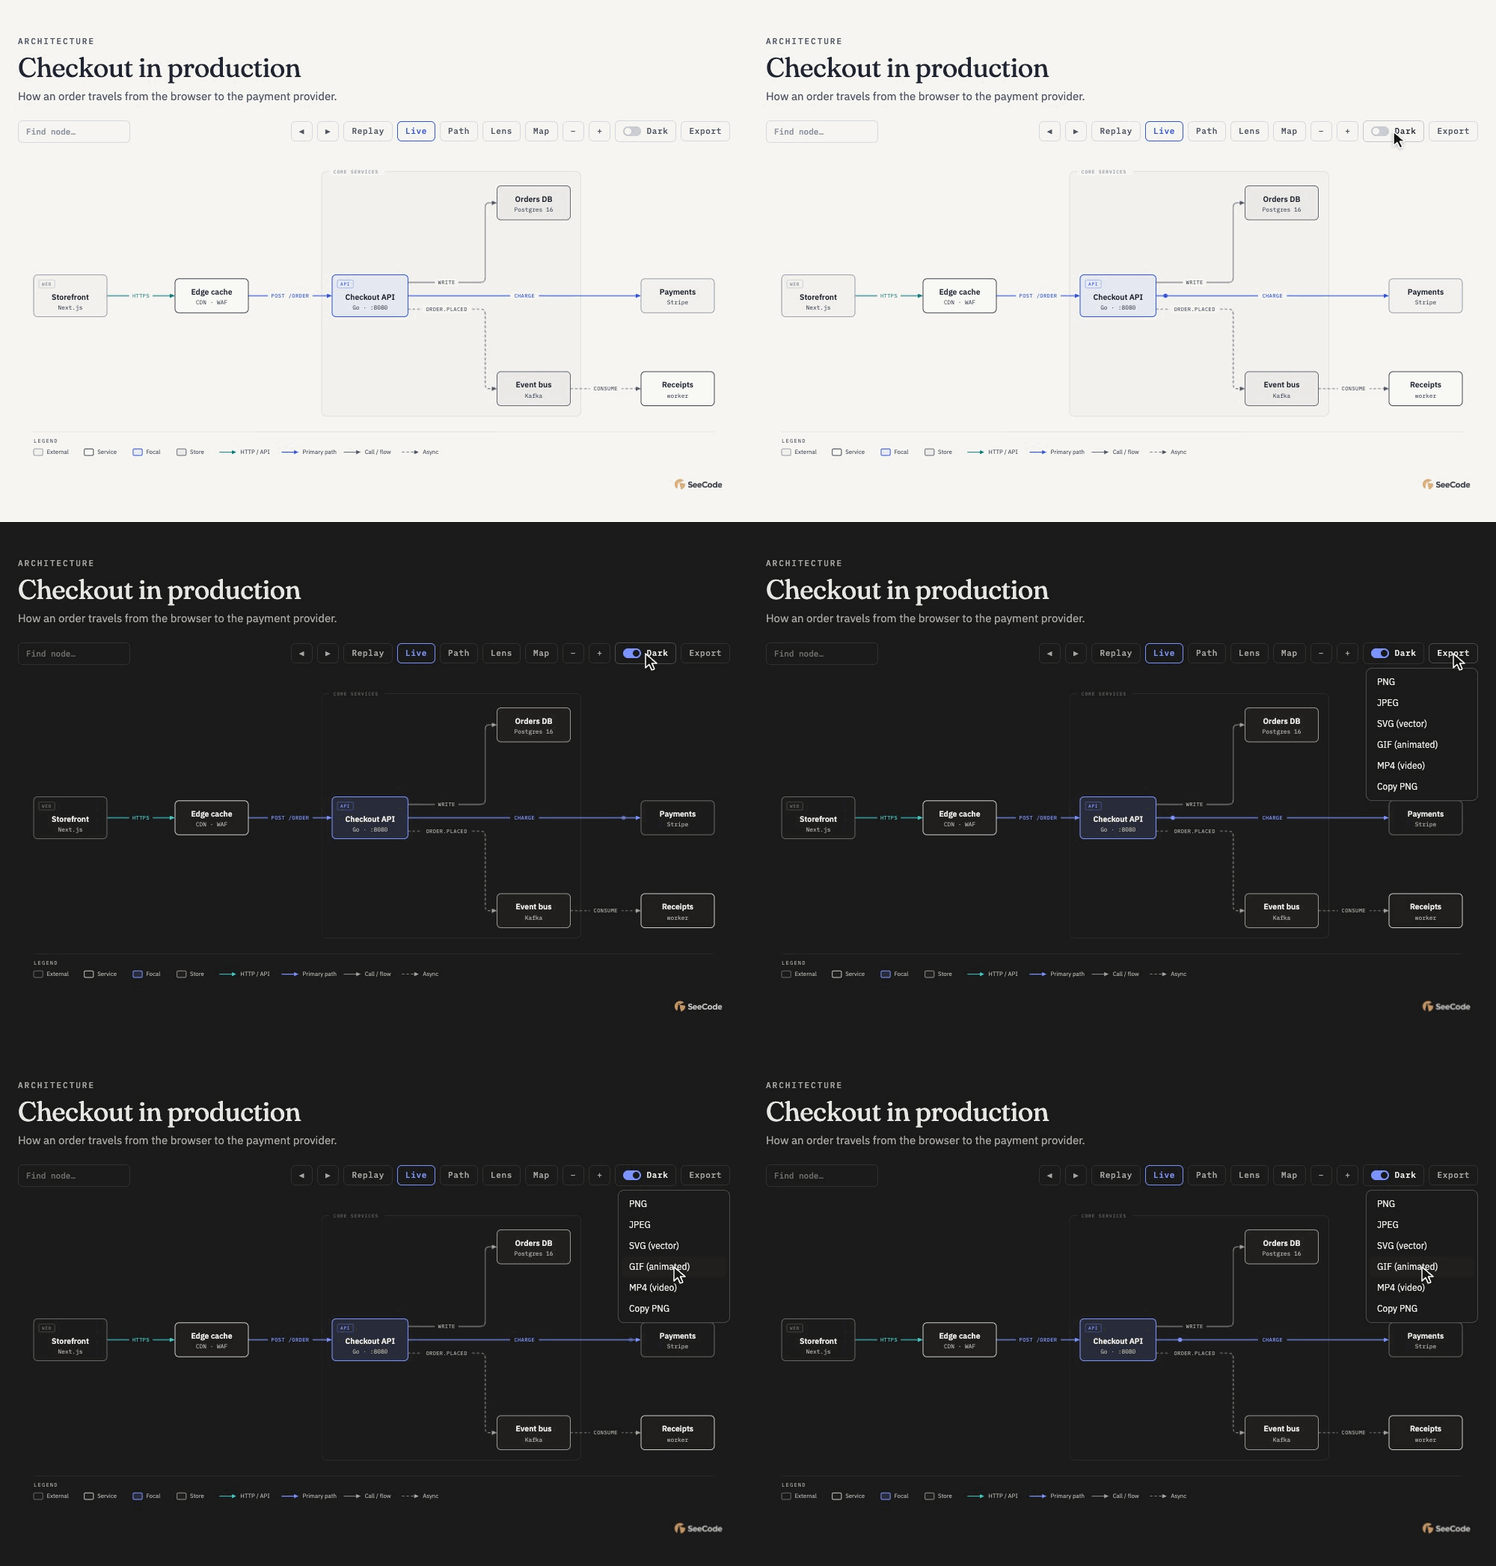 Theme it, export it Flip the dark-mode switch. The Export menu saves PNG, JPEG, SVG, GIF and MP4 straight from the page, with nothing installed. |
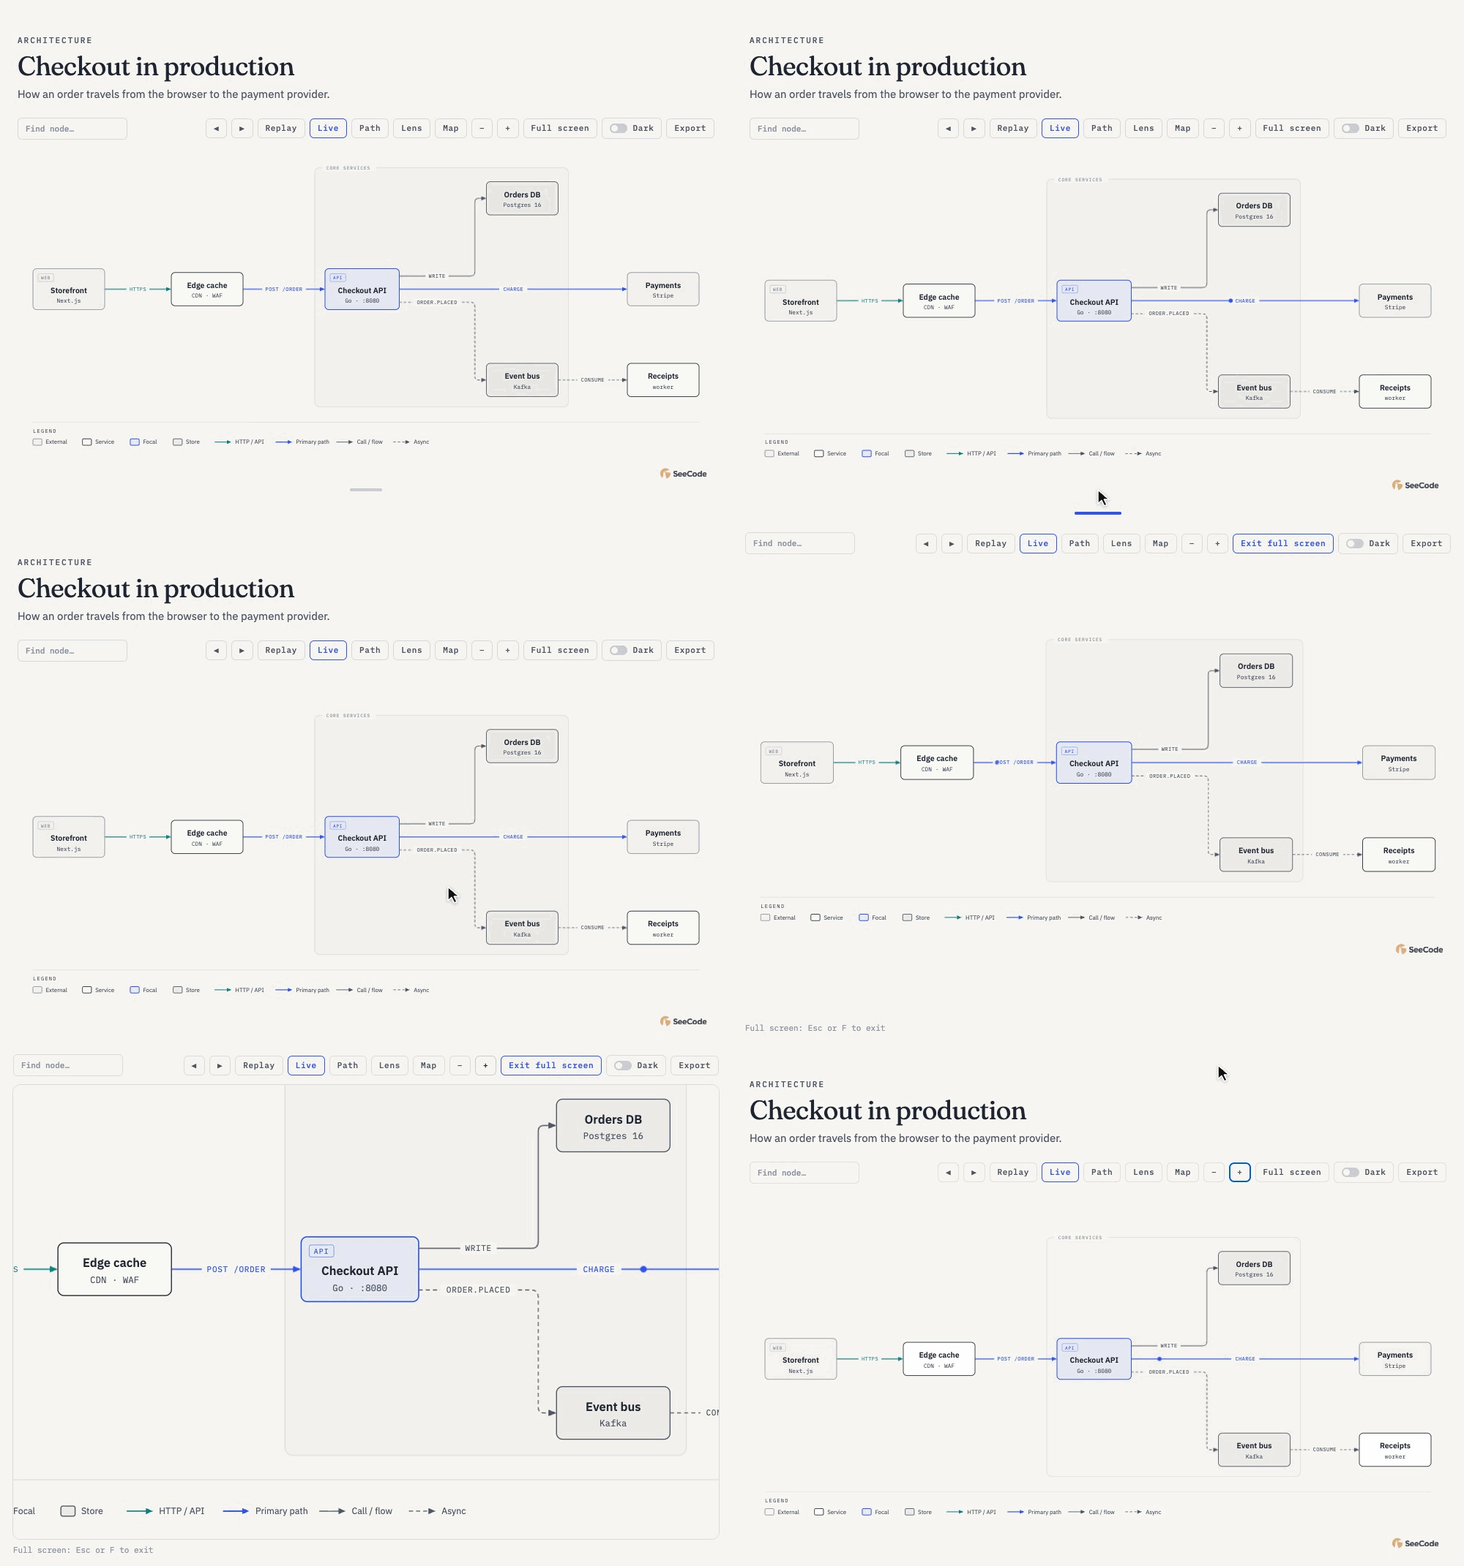 Give it room Drag the grip under the diagram to make the canvas taller, or press Full screen (F) to zoom and pan across the whole display. Esc brings you back. |
Also: a dark-mode switch, search, pan and zoom, a clickable overview map, and links that reopen a view (#focus=api, #route=web,db). Esc clears focus, routes and lenses, and reduced-motion settings are respected.
Themes, and your brand
Light and dark come built in, and every diagram has a dark-mode switch that starts on your system setting. Dark mode is a soft #1a1a1a, never pure black. Point SeeCode at your site or your design tokens and it learns your brand palette too.
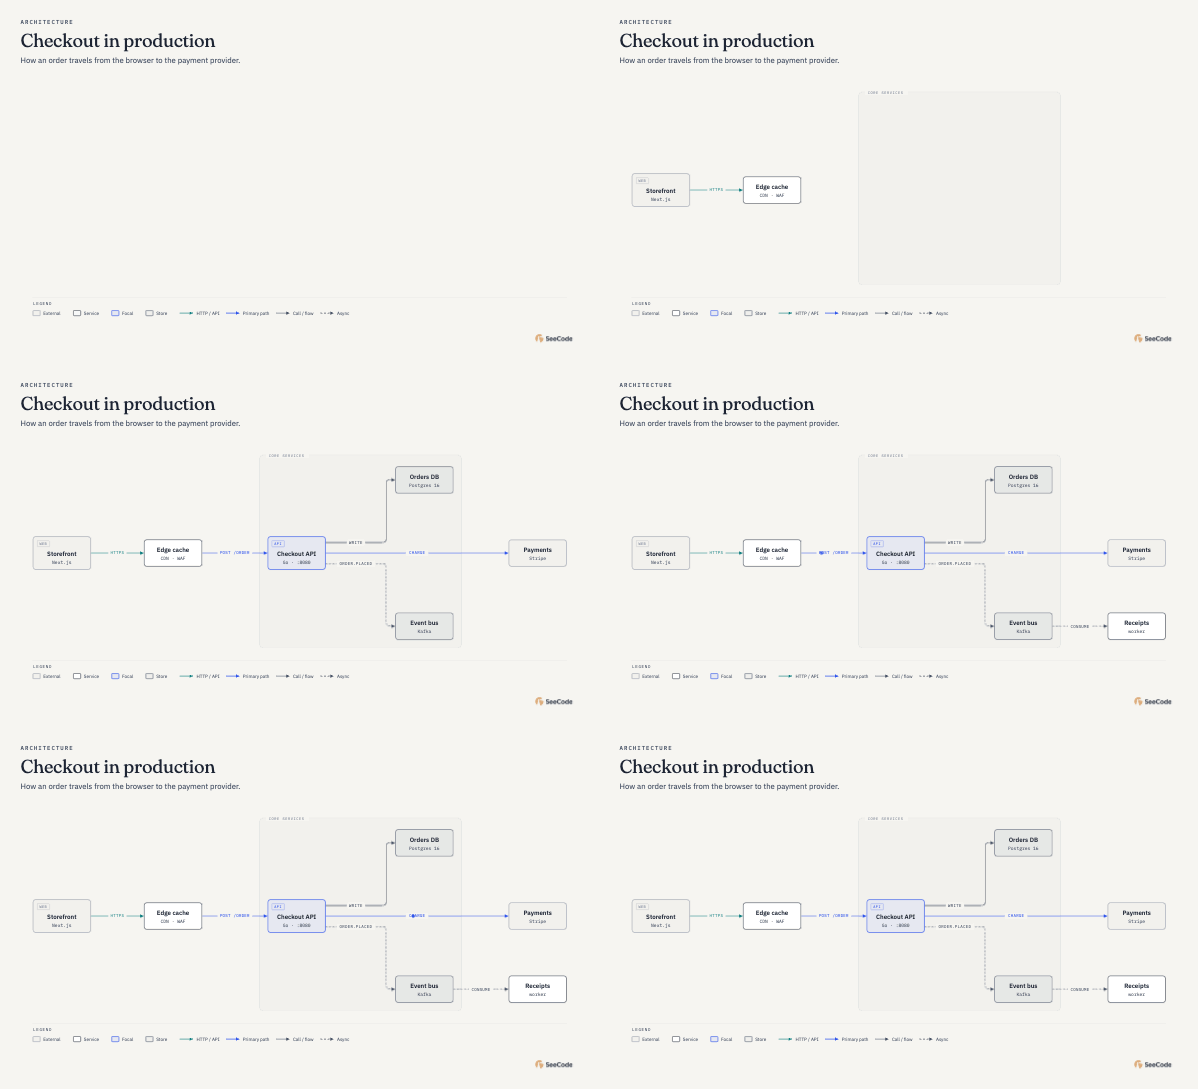 Light Warm paper, ink-dark text, one blue accent for what matters. |
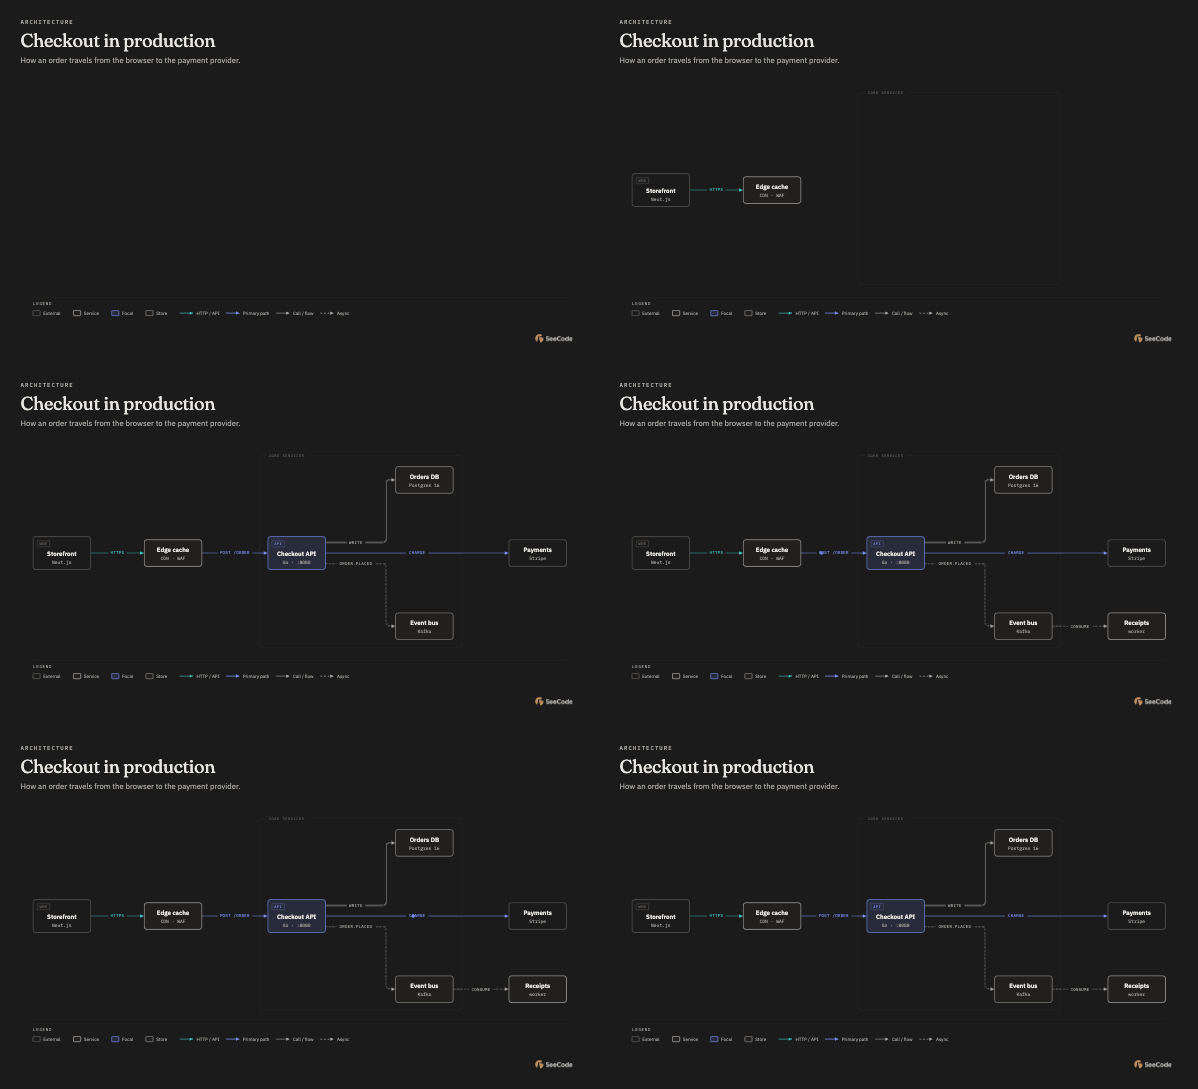 Dark Neutral #1a1a1a background, tuned so every label keeps its contrast. |
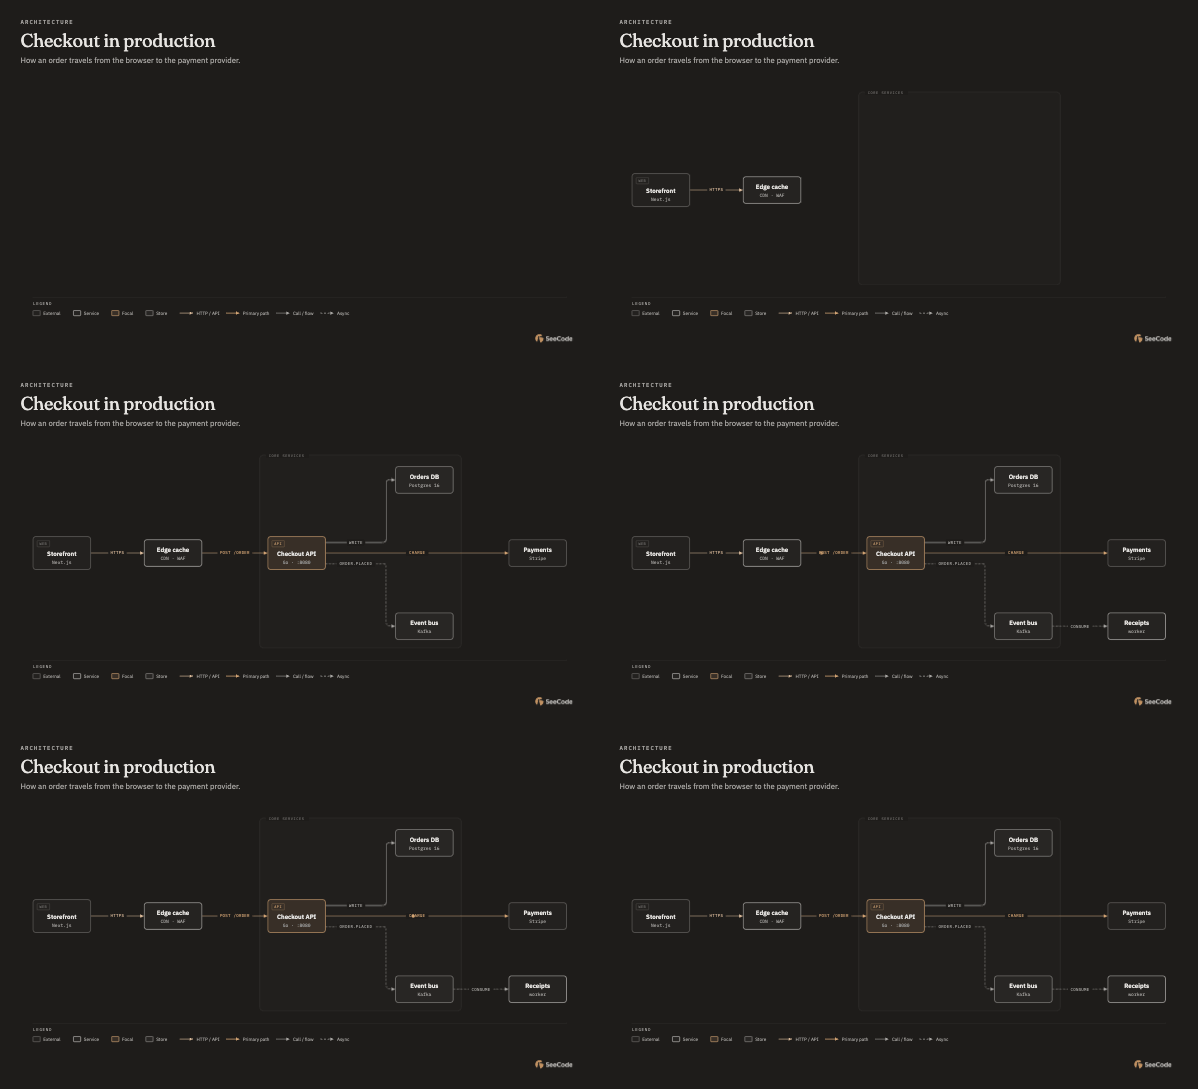 Your brand Learned from a site, CSS tokens or a list of colours. Shown here:    |
Tell your agent where your brand lives, in any of three ways:
Use SeeCode with our brand: https://your-site.com
Replace https://your-site.com with your own website.
Use SeeCode with the brand colours in this repo's CSS.
Use SeeCode with these colours: #D4A574, #E7E5E2, #1E1C1A.
SeeCode reads the page and its stylesheets (or your repo's CSS, Tailwind and theme files) and works out which colour is the background, the text, the accent and the links, and which typefaces your body text, headings and code use. It builds a light and a dark version and fixes contrast where a brand colour would be hard to read: tan on off-white is deepened for light mode, while dark mode keeps it exactly. It then shows you the palette before saving it as a profile. No brand? Diagrams use the built-in themes. How brand onboarding works
Bring what you already have
Point SeeCode at an existing diagram or data file and it redraws it: same content, SeeCode's layout and style, at the level of detail you ask for.
Turn docs/architecture.mmd into a SeeCode diagram for my deck, simplified for executives.
| Source | Files |
|---|---|
| Mermaid (every diagram kind) | .mmd, .mermaid, fenced blocks in .md |
| Graphviz · PlantUML · D2 | .dot .gv · .puml .plantuml · .d2 |
| draw.io · Excalidraw | .drawio (also .drawio.png/.svg) · .excalidraw |
| Structurizr · BPMN | .dsl · .bpmn |
| SQL · Prisma · DBML | .sql · .prisma · .dbml |
| OpenAPI · data | .yaml/.json · .csv .tsv .json |
One file, many diagrams? A design doc with several Mermaid blocks, a draw.io file with several pages or a board with frames comes out as a folder, one diagram per file, numbered in order and named after its heading or page, plus an index.html to browse them:
Use SeeCode to redraw every diagram in docs/design.md and export them for Confluence.
diagrams/design/
  01-request-flow.html   01-request-flow.svg   01-request-flow.png
  02-payment-sequence.html   …
  index.html
You get a short report of what was merged or dropped. Source colours, fonts and coordinates never carry over. Or point it at code: "diagram this repo" scans the repository first, and each node can link back to the files it came from.
Export for wherever it goes
SeeCode works out where the diagram will live and picks the output to match:
| Where it goes | You get |
|---|---|
| Explaining how something works, an artifact, a share link | Interactive HTML (motion, trace, focus, journey) |
| PDF, Word, print | SVG with embedded fonts, plus a high-res PNG |
| README, docs site, Notion, Confluence | SVG, plus a GIF if you want motion |
| PowerPoint, Keynote, Google Slides | SVG or PNG |
| Slack, X, LinkedIn, talks | PNG, GIF or MP4 |
Every diagram carries a small SeeCode mark in its bottom-right corner, drawn in the diagram's own text colour so it reads on any background. Ask to remove it and it's gone.
Nothing to install. The diagram's own Export menu makes PNG, JPEG, SVG, GIF and MP4 in the browser. From the command line, SVG needs only Node, and the other formats use the Chrome or Edge you already have.
The size adapts to the content: each format gets the resolution that keeps the smallest label readable while keeping the file practical. A small chart comes out at 3×, a dense system map at whatever keeps its labels sharp, GIFs stay compact and MP4s stay within 4K. Export details
 |
 |
Why it looks good every time
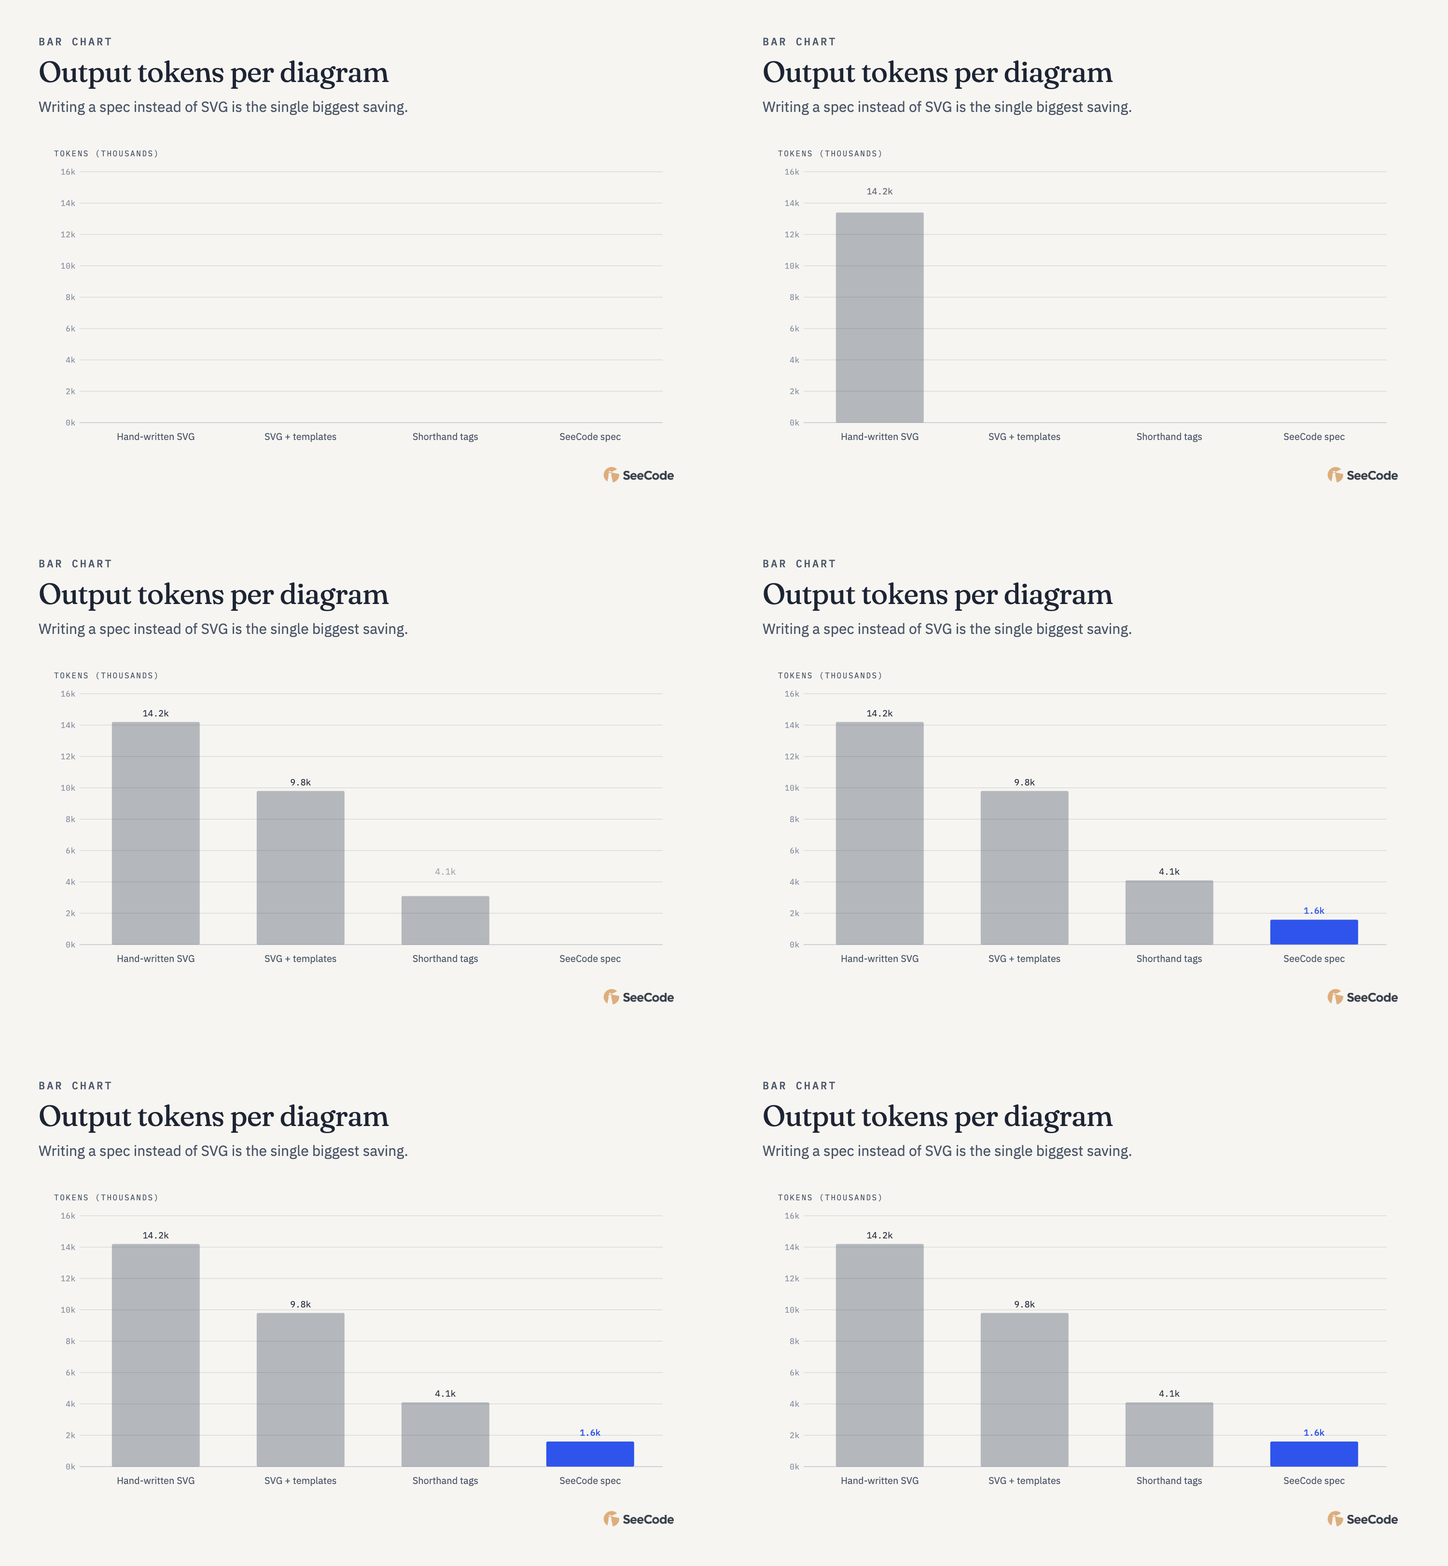
- The model never draws SVG. Your agent writes 30 to 150 lines of JSON: what's there, how it connects, roughly where. SeeCode's renderers handle layout, edge routing, label placement, typography, accessibility and motion.
- Editorial by default. One accent colour for what matters most, hairline borders, no shadows, and a complexity budget that pushes back on clutter.
- Mistakes come with fixes. Problems come back as one line each with a fix hint, and repairs are small patches instead of rewrites.
- Light on tokens. About 1.4k agent tokens per diagram, against roughly 15k when a model writes the SVG itself.
- Yours to style. Light, dark and terminal skins, a sketchy hand-drawn style, and brand colours and fonts learned from your site or design tokens.
When not to use it
- A list of things: use a table or bullets.
- A before/after of attributes: use a table.
- One box with a label: write the sentence.
If a reader wouldn't learn more from the picture than from a good paragraph, skip the diagram.
Install
Claude Code (plugin, auto-updates):
/plugin marketplace add Aryanutkarsh/seecode
/plugin install seecode@seecode
Run /plugin → Marketplaces → seecode → Enable auto-update once. The plugin also adds /seecode:export, /seecode:import, /seecode:doctor and /seecode:settings.
Any Agent Skills host (Claude Code, Cursor, Codex, OpenCode…) via skills.sh:
npx skills add Aryanutkarsh/seecode -g
Codex:
codex plugin marketplace add Aryanutkarsh/seecode
codex plugin add seecode@seecode
GitHub Copilot:
copilot plugin marketplace add Aryanutkarsh/seecode
copilot plugin install seecode@seecode
Claude.ai / Claude Desktop: download seecode.zip from the latest release and upload it under Settings → Capabilities → Skills. Everything works there; image and video files come from the diagram's own Export menu, since the sandbox has no browser.
Manual:
git clone https://github.com/Aryanutkarsh/seecode ~/code/seecode
ln -s ~/code/seecode/skills/seecode ~/.claude/skills/seecode
Requires Node 20 or later. Check your setup with /seecode:doctor or node skills/seecode/scripts/seecode.mjs doctor.
Updating
Every change merged to main ships as a new version, with a release and a fresh seecode.zip. How you pick it up depends on how you installed:
| Installed with | To update |
|---|---|
| Claude Code plugin | Automatic once auto-update is on (/plugin → Marketplaces → seecode → Enable auto-update). To update now: /plugin → Marketplaces → seecode → Update |
npx skills add |
npx skills update seecode -g (drop -g for a project install). Skills installed this way don't update on their own |
| Codex / Copilot plugin | Update the plugin from your agent's plugin manager, or run the install commands above again |
| Claude.ai / Claude Desktop | Download seecode.zip from the latest release and upload it again under Settings → Capabilities → Skills |
| Manual clone | git pull in the clone (the symlink picks it up) |
Then start a new agent session: skills load when a session starts. To see which version you have, check the version: line at the top of the installed SKILL.md, or run /seecode:doctor.
Learn more
Contributing
Issues, pull requests and new diagram types are welcome. Start with the contribution guide, and please follow the code of conduct. Report security problems privately as described in SECURITY.md.
Privacy
SeeCode has no server, accounts or telemetry. Generated diagrams load their fonts from Google Fonts, and the in-page GIF/MP4 export loads its encoders from jsDelivr. PRIVACY.md lists every request.
Acknowledgements
SeeCode learned a great deal from excellent open-source projects: diagram-design by Cathryn Lavery, for its editorial approach to diagram types and its isometric projection, and archify by tt-a1i, for its explorable, animated viewer. The isometric object type was also inspired by iso-glow by April Zhu (@Aprilzz423) and iso-figure by Tolga Cohce, which showed how far isometric figures built from simple parts can go. All of these are MIT licensed; SeeCode's code is its own. Thank you all.
If SeeCode is useful to you, a ⭐ helps others find it.
License
MIT. Bundled encoders and fonts are listed in THIRD_PARTY_LICENSES.md.

Reviews (0)
Sign in to leave a review.
Leave a reviewNo results found