PerfGraph
Health Pass
- License — License: MIT
- Description — Repository has a description
- Active repo — Last push 0 days ago
- Community trust — 11 GitHub stars
Code Pass
- Code scan — Scanned 12 files during light audit, no dangerous patterns found
Permissions Pass
- Permissions — No dangerous permissions requested
No AI report is available for this listing yet.
CDP-powered perf CLI: goes beyond Lighthouse scores, builds causal degradation graphs. Tells you why it's slow, not just that it is.
PerfGraph




Real browser metrics → causal degradation graph → actionable report. Built for AI agents, useful for humans.
PerfGraph launches a headless Chromium browser, captures performance data via Chrome DevTools Protocol, runs it through a 5-stage analysis pipeline, and spits out a structured JSON report with issues sorted by severity, causal chains, and prioritized fixes.
npx perfgraph run --url https://example.com --pretty
PerfGraph — not a symptom list, a diagnosis.
Root cause → impact → fix, in one graph.
Why
Lighthouse gives you a score. PerfGraph tells you why it's bad and what to fix first.
Instead of digging through a 10k-line trace.json or a wall of Lighthouse audits, you get a focused report with root causes linked to impact. The output is designed to be read by AI agents (or you) without a decoder ring.
Pipeline
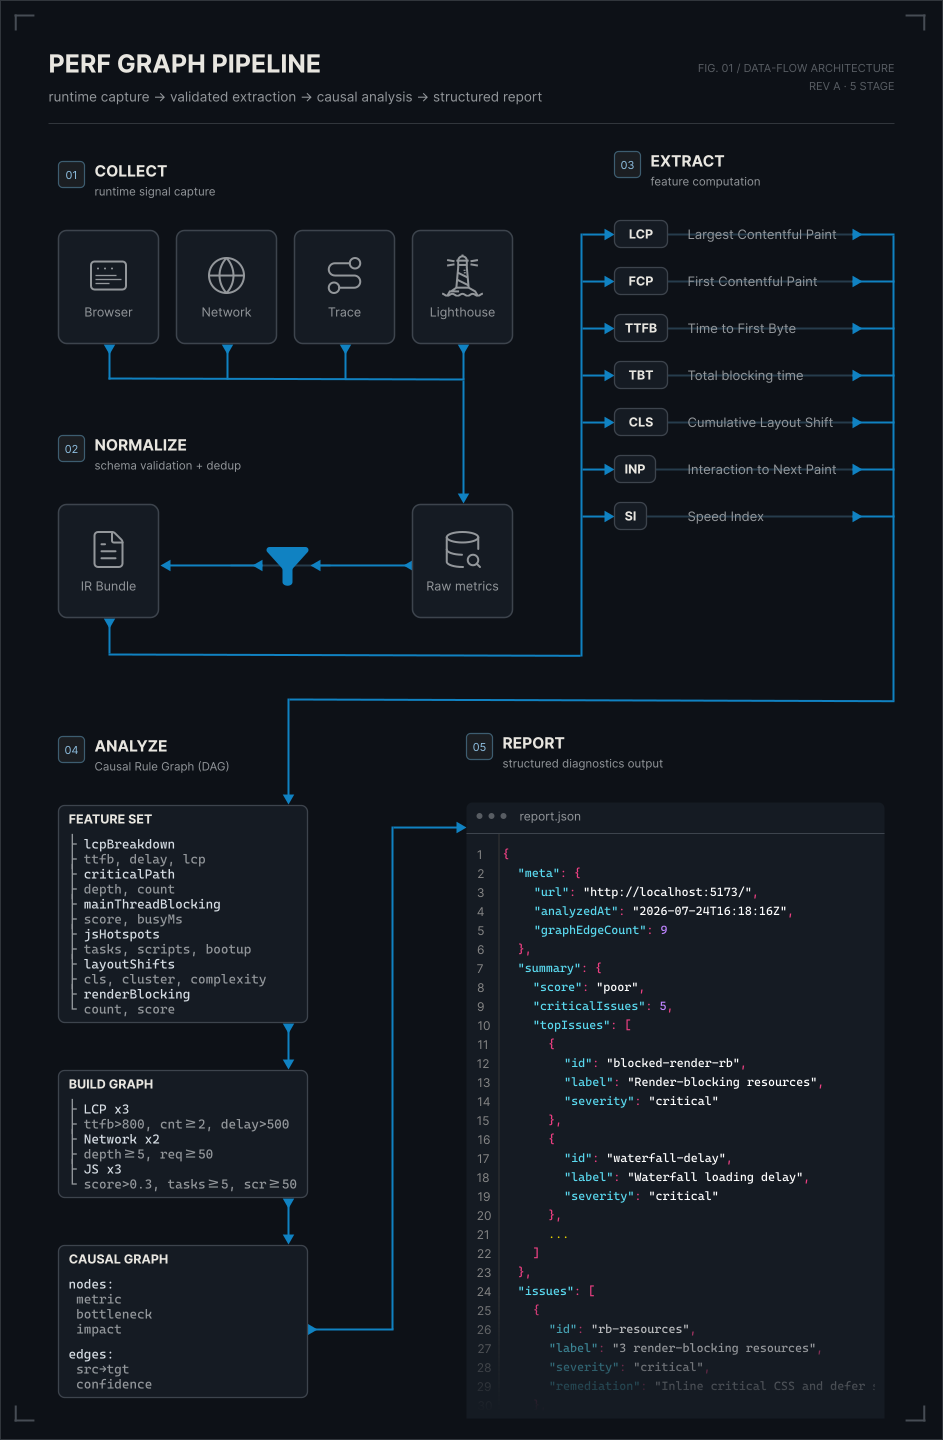
collect → normalize → extract → analyze → report
| Step | What it does |
|---|---|
| Collect | Launches headless Chromium, captures network, trace, performance API, JS coverage, console logs, DOM snapshot, and Lighthouse audit |
| Normalize | Validates raw data through Zod schemas into a unified Intermediate Representation (IRBundle). All timestamps normalized, data cleaned |
| Extract | Computes 7 diagnostic feature sets from the IR: LCP breakdown, critical network chain, main-thread blocking time, JS hotspots, layout shifts, third-party overhead, render-blocking score |
| Analyze | Runs 30+ causal rules against the features, builds a directed graph where edges represent known causal relationships with confidence levels (strong/medium/weak) |
| Report | Produces a self-contained JSON report with issues sorted by severity, causal chains from root cause to user impact, and prioritized recommendations with expected impact estimates |
Install
npm install -g perfgraph
Or skip the install:
npx perfgraph --help
Requirements: Node.js ≥ 22, Chromium (Playwright installs it automatically on first run).
Quick start
Full pipeline, one command:
perfgraph run --url https://example.com --pretty
Want to use PerfGraph from your AI agent? See MCP integration.
Step by step:
# 1. Collect data
perfgraph collect --url https://example.com --output ./results

# 2. Normalize → Extract → Report
perfgraph normalize ./results/perfgraph_example_20260609_120000 --output ir.json
perfgraph extract ir.json --output features.json
perfgraph report features.json --output report.json --pretty
Commands
perfgraph run
Full pipeline in one shot.
--url <url>           Required. Target URL to analyze.
--output <dir>            Output directory (default: ./perfgraph-output).
--runs <n>            Number of collection runs (default: 1).
--pretty              Pretty-print the final report JSON.
--device <name>       Mobile emulation (e.g. "iPhone 13").
--no-lighthouse       Skip Lighthouse collection.
--no-coverage         Skip JS/CSS coverage.
--no-console          Skip console log capture.
--no-dom              Skip DOM snapshot.
perfgraph collect
Captures performance data from a URL. See run options — same flags apply.
perfgraph normalize <input>
Converts raw collected data into a validated IRBundle. Accepts a run directory or a parent directory (auto-detects latest run).
--output, -o <file>   Write to file (default: stdout).
--pretty              Pretty-print JSON.
perfgraph extract <ir-file>
Computes diagnostic features from a normalized IR bundle.
--input, -i <file>    Path to IR JSON (alternative to positional).
--output, -o <file>   Write to file (default: stdout).
--pretty              Pretty-print JSON.
perfgraph analyze <features-file>
Applies causal rules and builds a degradation graph.
--input, -i <file>    Path to FeatureSet JSON (alternative to positional).
--output, -o <file>   Write to file (default: stdout).
--pretty              Pretty-print JSON.
perfgraph report <features-file>
Generates the final performance report. Accepts a FeatureSet JSON (from extract) — runs the causal engine internally, no need to call analyze separately.
--input, -i <file>    Path to FeatureSet JSON (alternative to positional).
--output, -o <file>   Write to file (default: stdout).
--pretty              Pretty-print JSON.
perfgraph mcp
Starts an MCP stdio server for AI agent integration. No flags. See AGENTS.md for details.
MCP integration
PerfGraph ships as an MCP server. Any AI agent with MCP support can call perfgraph_analyze to run the full pipeline and get structured results.
Add to your agent
Copy the prompt below and paste it into your AI agent (Claude, Codex, Cursor, Copilot, etc.):
Add the PerfGraph MCP server to my configuration. Run:

npx perfgraph mcp

This is a stdio MCP server. Add it as a local MCP server with command: npx perfgraph mcp
The server exposes a perfgraph_analyze tool that takes a URL and returns a full performance report.
Config snippets
Claude (Desktop / Code / CLI)MCP config can live in multiple places. Easiest — dedicated file:
# create the file if it doesn't exist
cat > ~/.claude/mcp_servers.json << 'EOF'
{
  "perfgraph": {
    "command": "npx",
    "args": ["perfgraph", "mcp"]
  }
}
EOF
Other locations (higher priority overrides lower):
~/.claude.json— main config~/.claude/settings.json— user global~/.claude/settings.local.json— user local.claude/settings.local.json— project-specific.mcp.json— project-scoped, version-controlled
Add to ~/.config/opencode/opencode.json under "mcp":
{
 "mcp": {
  "perfgraph": {
   "type": "local",
   "command": ["npx", "perfgraph", "mcp"],
   "enabled": true
  }
 }
}
Or project-scoped — opencode.json in project root (overrides global).
Global: ~/.cursor/cli-config.json (macOS/Linux) or $env:USERPROFILE\.cursor\cli-config.json (Windows).
Project: <project>/.cursor/cli.json.
{
 "mcpServers": {
  "perfgraph": {
   "command": "npx",
   "args": ["perfgraph", "mcp"]
  }
 }
}
What the agent gets
Once connected, the agent can call perfgraph_analyze with a URL and receive:
| Output | What's in it |
|---|---|
insights.json |
Quick summary — scores, LCP element, render-blocking URLs (~5-15 KB) |
report.json |
Full report — issues, causal chains, prioritized fixes |
manifest.json |
File index for navigating raw data |
lighthouse.json / trace.json |
Deep-dive data (large, read only when needed) |
Report format
The report is a single JSON file. Key sections:
{
 "meta": {
  "url": "https://example.com",
  "analyzedAt": "2026-06-09T19:15:19.000Z",
  "reportVersion": "1.0.0",
  "featureCount": 7,
  "graphNodeCount": 24,
  "graphEdgeCount": 31,
  "ruleCount": 32,
 },
 "summary": {
  "score": "moderate", // "good" | "moderate" | "poor"
  "criticalIssues": 2,
  "warnings": 5,
  "infos": 3,
  "topIssues": [
   {
    "id": "js-long-task",
    "label": "Long task",
    "severity": "critical",
    "confidence": "strong",
   },
  ],
 },
 "issues": [
  {
   "id": "lcp-slow",
   "label": "LCP exceeds 2.5s threshold",
   "severity": "critical",
   "value": 4320,
   "unit": "ms",
   "threshold": 2500,
   "confidence": "strong",
   "remediation": "Optimize largest contentful paint element...",
   "chainId": "lcp:3",
  },
 ],
 "chains": [
  {
   "id": "lcp:3",
   "rootCause": "LCP > 2.5s",
   "impact": "Poor user experience",
   "path": [
    "TTFB delayed by server response",
    "Render-blocking stylesheets",
    "LCP element render delay",
   ],
   "length": 3,
  },
 ],
 "recommendations": [
  {
   "priority": "critical",
   "category": "LCP",
   "title": "Optimize Largest Contentful Paint",
   "action": "Inline critical styles, defer non-critical CSS",
   "expectedImpact": "Reduces LCP by ~40%",
   "relatedIssues": ["lcp-slow"],
  },
 ],
 "features": {
  /* raw extracted features for cross-referencing */
 },
}
What it detects
| Category | Issues |
|---|---|
| LCP | Slow LCP, high TTFB, render-blocking resources, LCP resource delay chains |
| JavaScript | Long tasks, high TBT, heavy execution, unused code, main-thread bottlenecks |
| Network | Deep request chains, bandwidth bottlenecks, waterfall depth, critical path analysis |
| Layout | Layout shifts (CLS), large DOM size, forced reflows |
| Third-party | Third-party script overhead, tracking pixels, embedded widget impact |
Architecture
src/
├── index.ts              CLI entry — lazy-loads commands
├── collect/              CDP data collection via Playwright
│   ├── browser.ts        Browser launcher
│   ├── collector.ts      Orchestrator
│   ├── coverage.ts       JS/CSS coverage
│   ├── network.ts        Network request capture
│   ├── performance.ts    Performance API metrics
│   ├── runtime.ts        Runtime metadata
│   ├── dom.ts            DOM snapshot
│   └── lighthouse.ts     Lighthouse audit
├── normalize/            Data normalization & IR validation
├── extract/              7 diagnostic feature extractors
├── causal/               Causal rule engine (30+ rules)
│   ├── builder.ts        Graph construction
│   ├── rules/            Individual causal rules by category
│   └── types.ts          Graph data types
├── report/               Report generation & scoring
│   ├── analyzer.ts       Report builder
│   ├── scorer.ts         Score computation
│   ├── remediations.ts   Remediation templates
│   └── types.ts          Report schema
├── distill/              Agent-optimized summary layer (insights.json)
├── mcp/                  MCP stdio server
├── cli/                  CLI command handlers
└── shared/               Shared utilities & types
Development
npm install
npm run build          # compile TypeScript
npm run typecheck      # check types only
npm test               # run tests
npm run test:watch     # tests in watch mode
npm run dev            # tsx watch — no build step
Tech
| Thing | What |
|---|---|
| Runtime | Node.js ≥ 22 |
| Language | TypeScript (strict, noUncheckedIndexedAccess) |
| Browser | Playwright (Chromium) |
| Validation | Zod at every data boundary |
| Graph engine | @dagrejs/graphlib |
| Performance audits | Lighthouse |
| Testing | Vitest |
License
MIT
Reviews (0)
Sign in to leave a review.
Leave a reviewNo results found