ccgauge
Health Pass
- License — License: MIT
- Description — Repository has a description
- Active repo — Last push 0 days ago
- Community trust — 16 GitHub stars
Code Pass
- Code scan — Scanned 12 files during light audit, no dangerous patterns found
Permissions Pass
- Permissions — No dangerous permissions requested
No AI report is available for this listing yet.
Claude Code & Codex Dashboard — local web UI for Cluade & Codex token usage and cost. npx ccgauge
ccgauge
Tokens, cost, and cache-savings dashboard for Claude Code + Codex CLI.
One command. Zero install. Everything stays on your laptop.


npx ccgauge
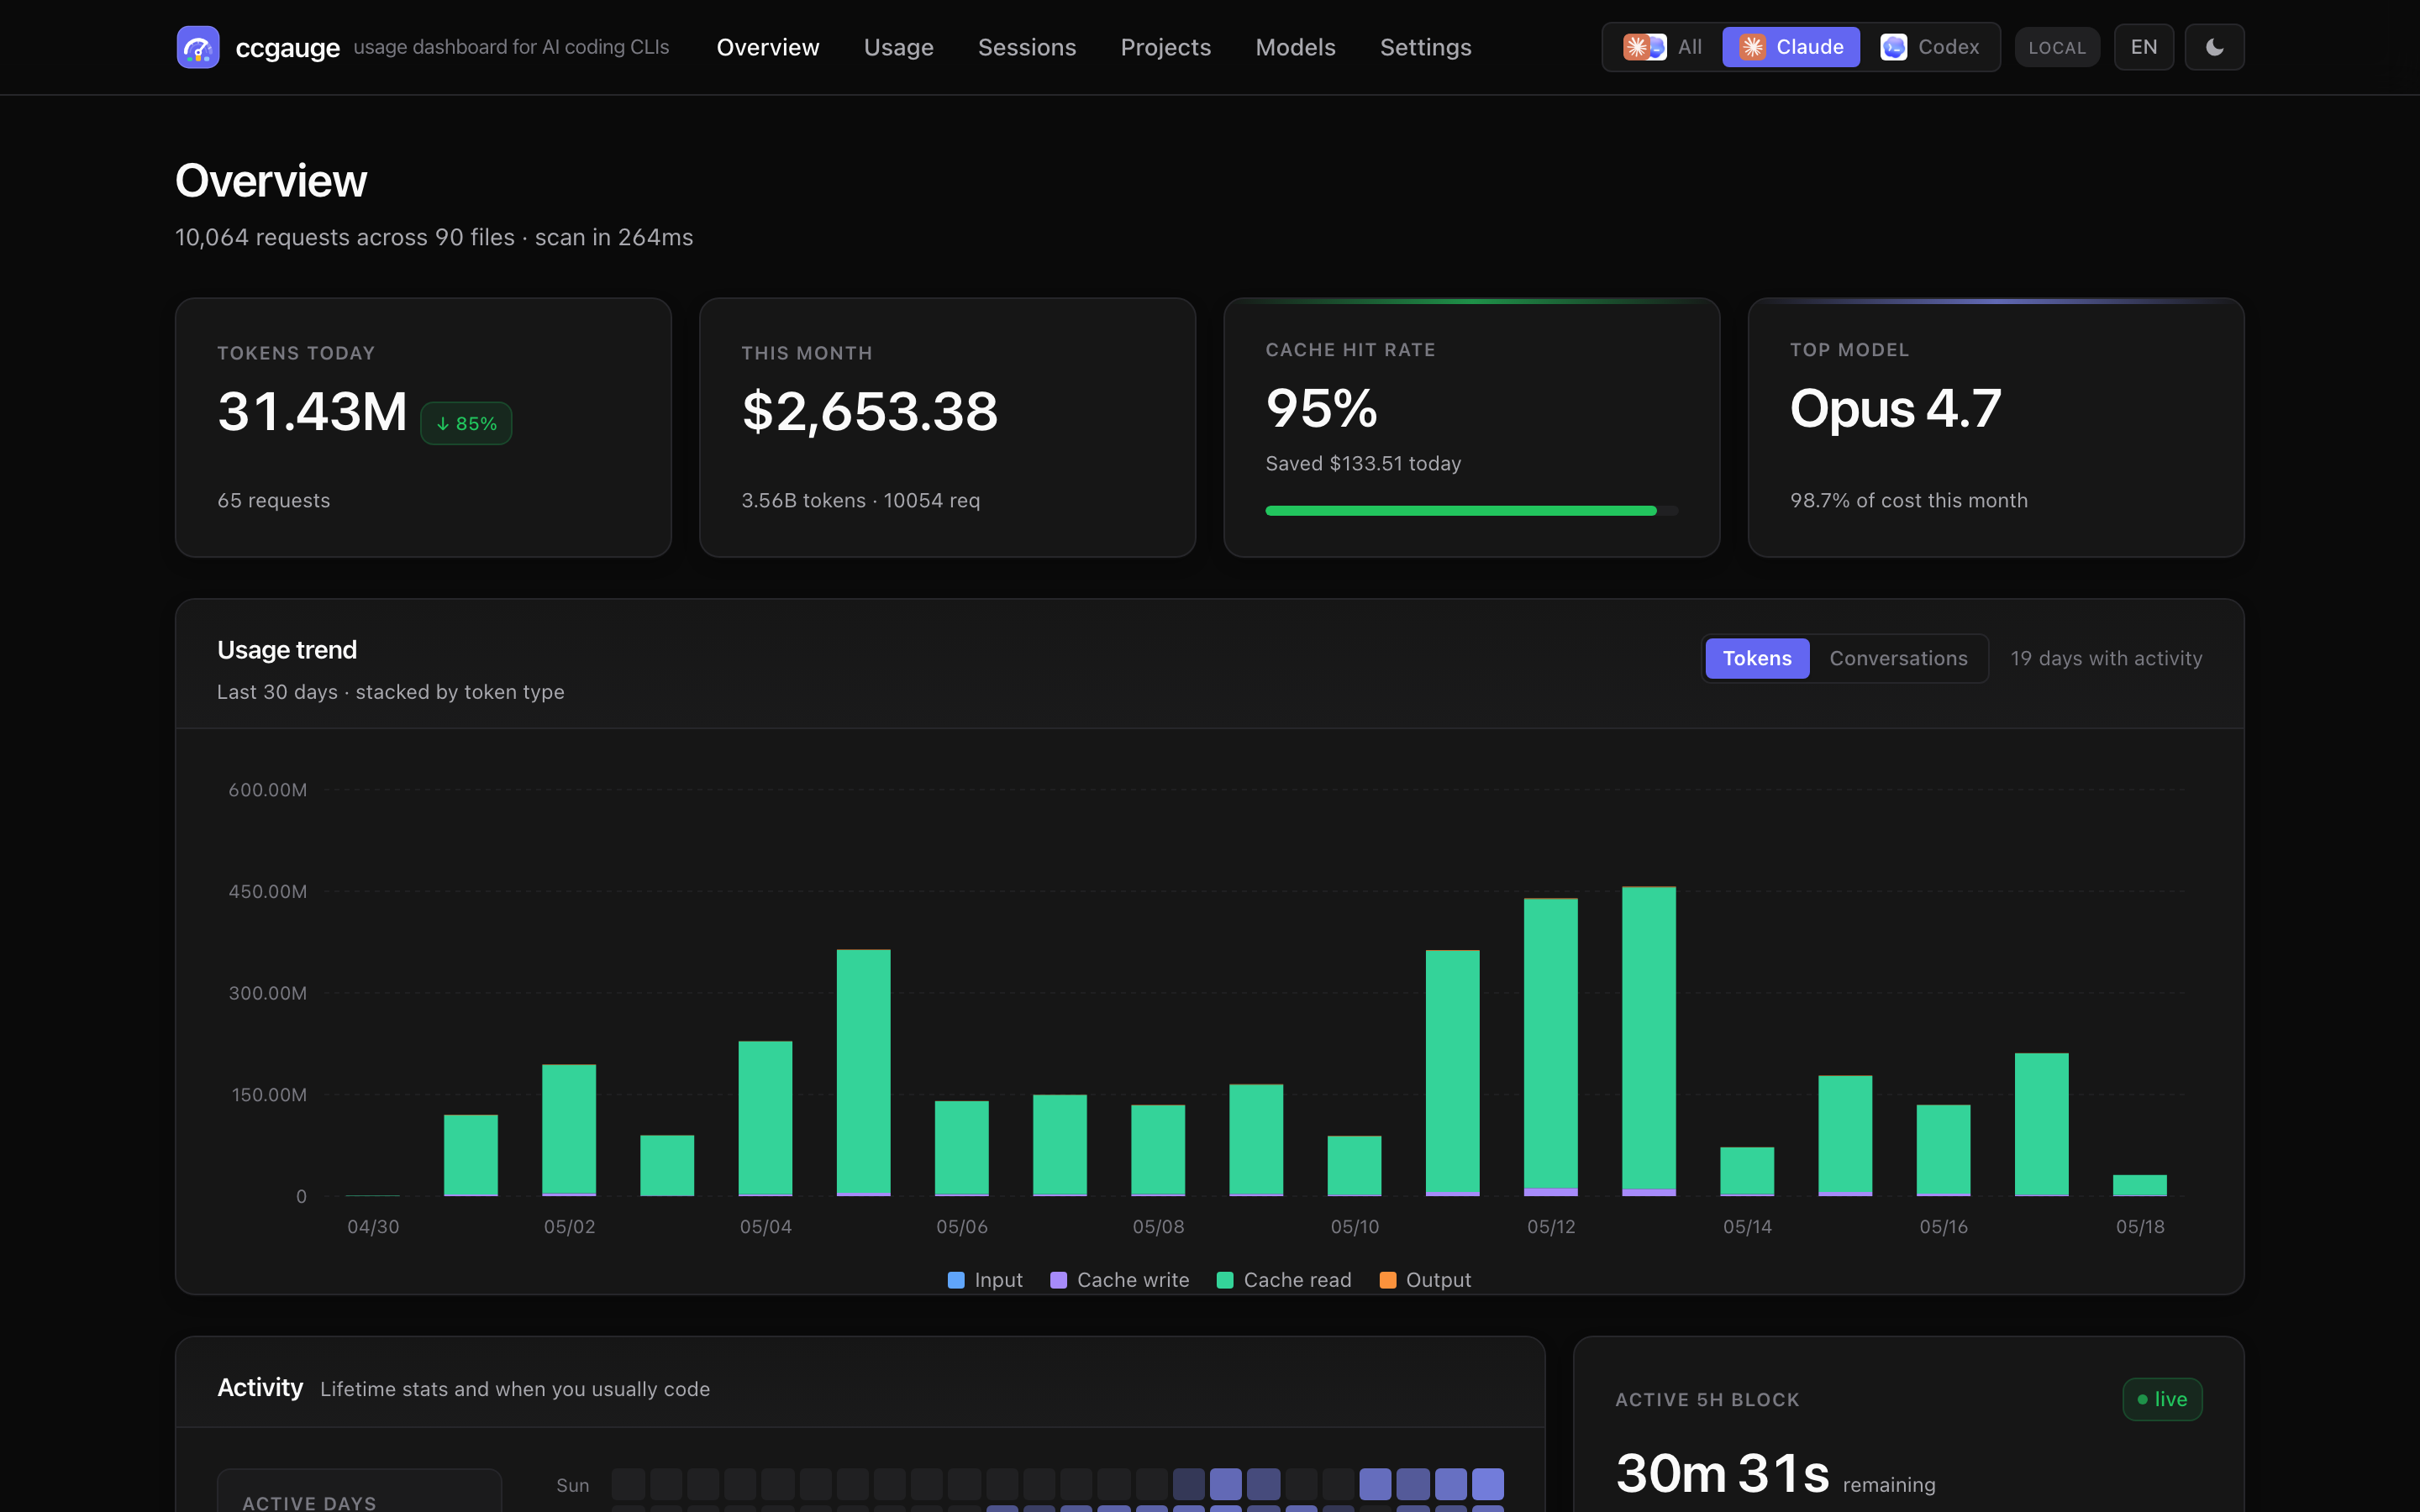
ccgauge reads the JSONL session files Claude Code and Codex CLI already store on your disk, computes day / project / model / session breakdowns plus dollar-equivalent cost, and opens a unified browser dashboard. Switch providers with one click. Ask your LLM about your usage via the built-in MCP server. Or skip the browser entirely and run ccgauge report -d for a rich terminal dashboard.
No login. No telemetry. Your usage data never leaves your machine — the only outbound request fetches public model prices from LiteLLM, and CCGAUGE_OFFLINE=1 turns even that off.
Why ccgauge stands out
- 🪟 Two CLIs, one dashboard. Claude Code and Codex CLI side by side — switch sources from the nav bar, or merge them in the All view. No other dashboard covers both.
- 💰 Cache savings as a first-class KPI. See exactly how many dollars Anthropic prompt caching saved you this week. Not a footnote — a card on the overview.
- ⏱️ Live 5-hour block. Countdown, progress bar, projected total cost — know when the rate-limit window rolls over before you hit it.
- 🤖 MCP-native. Plug into Claude Desktop / Cursor / Cline and ask "What did I work on yesterday, by project?" in plain English. Real numbers, no screenshots, no copy-paste.
- 🔒 100% local & private. Reads JSONL files you already have. Zero outbound calls. MIT licensed. Your transcripts never leave the machine.
- 🪜 Worktree-aware projects. All worktrees of the same repo collapse into one project row — the way you actually think about your work.
What's new in v1.1.0
ccgauge report --dashboard/-d— rich one-screen TUI: KPI tiles, stacked-bar trend chart, breakdown tables, day×hour heatmap. Perfect for SSH / tmux / a quick check without leaving the terminal. Falls back to plain text below 80 columns.- Custom date range on
/usage— proper calendar picker (react-day-picker), brand-themed, follows your language toggle.?range=custom&from=...&to=...URL contract. - Marketing site at root URLs — English at
/cli///features///mcp/, Chinese under/zh/.... Old/en/*paths still resolve via static redirects.
See CHANGELOG.md for the full release notes.
Features
Dashboard (browser)
- Overview — 6 KPI cards (tokens today / cost / cache hit / top model / active sessions / live 5h block) with day-over-day delta on each.
- Usage — turn-grouped table with expandable tool calls, CSV export, Tokens / Conversations chart toggle. Filters: range (incl. custom date), granularity, model + project multi-select.
- Sessions — per-conversation list with model / tokens / cost / duration; click in for the message-level timeline.
- Projects — per-
cwdaggregation with sparkline and spend share; worktrees auto-collapsed. - Models — side-by-side cost share, token share, cache hit, official per-1M pricing.
- Light / Dark / System themes (no flash), EN / 中文, cookie + localStorage synced.
CLI report (terminal)
ccgauge report— colored, aligned text report in ~0.2s, ideal for CI.ccgauge report -d— rich TUI: KPI tiles, stacked vertical-bar trend, double-column breakdown tables, 7×24 activity heatmap.- Filters:
--range / --source / --by / --since / --until / --model / --project. --jsonfor scripts;--no-colorauto-detected when piped.
MCP server (LLM access)
ccgauge mcp— stdio JSON-RPC server. Plug into Claude Desktop / Cursor / Cline / your own agent.- 9 tools for usage summary, time-series, per-model / project / session breakdowns, daily / weekly summaries, recent activity, hypothetical cost estimator.
- Reasoning-token breakdown for models that emit one.
- Separate cache (
index-mcp-v2.json) so MCP and the dashboard never fight.
Cost transparency
- Cache savings quantified as a dollar figure on the overview.
- Codex cost shown as OpenAI API equivalent so subscription users can compare value against pay-as-you-go.
- Built-in pricing: 12 Claude models + gpt-5 family + o-series; unknown models fall back to family-latest.
Privacy by design
- 100% local: read-only access to JSONL files, zero outbound calls.
- Open source, MIT licensed.
- Background mode for an always-on service with
start / stop / restart / status / open / logslifecycle commands.
Quick start
npx ccgauge                              # zero-install one-shot
npm i -g ccgauge && ccgauge              # or install globally
Dashboard opens at http://localhost:3737. If the port is busy, ccgauge picks the next free one. Ctrl+C to stop.
Requirements: Node.js 20+. macOS / Linux / Windows.
CLI
Commands
| Command | Purpose |
|---|---|
ccgauge, ccgauge start |
Start dashboard server in foreground. |
ccgauge start --background |
Start a detached background service. |
ccgauge stop [--force] |
Stop the background service. |
ccgauge restart [options] |
Stop and re-start with new options. |
ccgauge status [--json] |
Inspect background service. Exits 3 (systemd-style "not running") when nothing is up. |
ccgauge open |
Open the running dashboard in your browser. |
ccgauge logs [-f] [-n N] |
Tail the background-service log. |
ccgauge report [options] |
One-shot text or TUI report (no server). |
ccgauge mcp |
Start the MCP server on stdio for LLM access. |
ccgauge doctor |
One-screen diagnostic — paste into bug reports. |
Startup options
| Option | Default | Purpose |
|---|---|---|
-p, --port <port> |
3737 |
Preferred port. Falls back if busy unless --strict-port. |
-H, --host <host> |
127.0.0.1 |
Bind host. |
--no-open |
— | Skip auto-open in foreground. |
-b, --background |
— | Run as detached background service. |
-q, --quiet |
— | Silence Next.js output. |
--dir <path> |
— | Add <path>/projects as an extra Claude source. |
--strict-port |
— | Fail if the preferred port is busy. |
Background mode
ccgauge start -b                  # detached service, state in ~/.ccgauge/
ccgauge status                    # PID / URL / uptime
ccgauge logs --follow             # tail the service log
ccgauge stop                      # graceful stop (or --force)
~/.ccgauge/ holds state.json (PID, URL, start time, log path) and ccgauge.log. Override with CCGAUGE_STATE_DIR=/tmp/profile for isolated profiles.
ccgauge report
ccgauge report                       # last 7d, all sources, text
ccgauge report -d                    # rich TUI dashboard
ccgauge report -r 30d -b project     # 30 days, broken down by project
ccgauge report -s codex -m gpt-5     # only Codex, only gpt-5 models
ccgauge report --json                # machine-readable
| Option | Default | Purpose |
|---|---|---|
-r, --range <range> |
7d |
today / 1d / 7d / 30d / 90d / all |
-s, --source <provider> |
all |
claude / codex / all |
-b, --by <dim> |
model |
Breakdown: model / project / session |
-g, --gran <gran> |
day |
Trend bucket: hour / day / week / month |
-n, --limit <n> |
10 |
Rows in the breakdown table |
--since / --until |
— | ISO date range override (YYYY-MM-DD, local day-aligned) |
-m, --model <pat> |
— | Filter records whose model contains <pat> |
--project <pat> |
— | Filter by project basename / cwd substring |
-d, --dashboard |
— | Rich one-screen TUI layout (KPI tiles + stacked trend + breakdown + heatmap) |
--width <n> |
tty cols | Force output width — useful for screenshots / CI |
--no-banner / --compact |
— | Dashboard trimmings (skip banner / skip trend chart) |
-j, --json |
— | JSON output |
--no-color |
auto | Disable ANSI colors (auto when piped) |
--no-trend / --no-breakdown |
— | Skip sections (text mode only) |
MCP — let an LLM query your usage
Configure once, then ask in plain English. Snippet shape is the same across clients (Claude Desktop / Cursor / Cline / Continue):
{
  "mcpServers": {
    "ccgauge": {
      "command": "npx",
      "args": ["-y", "ccgauge", "mcp"]
    }
  }
}
Restart your client. Try: "What ccgauge tools do you have? Run usage_summary for last 7 days."
If you've installed ccgauge globally, drop the npx and use "command": "ccgauge". To override scan paths, pass CLAUDE_CONFIG_DIR / CCGAUGE_CODEX_DIR via the env field.
Tools
| Tool | What it answers |
|---|---|
usage_summary |
Total tokens / cost / cache savings for a date range. Always returns combined totals + per-source breakdown. |
usage_by_time |
Time-series buckets (hour / day / week / month) for trend questions. |
usage_by_model |
Per-model cost share. Each entry tagged with its source. |
usage_by_project |
Per-project (cwd) cost share + session counts + last activity. |
usage_by_session |
Session list sorted by recent / cost / tokens / duration. |
daily_summary |
"What did I do today / yesterday / on YYYY-MM-DD?" — sessions grouped by project + top tool calls. |
weekly_summary |
7-day roll-up: daily cost trend, top sessions / projects, models. week_offset=-1 for last week. |
recent_activity |
N most recently active sessions across providers. |
cost_estimator |
USD cost of a hypothetical request. Uses built-in pricing tables; does NOT consult history. |
Every analytical tool accepts source (claude / codex / all) and either range (today / 7d / 30d / this_week / last_week / this_month / last_month / all) or explicit from / to. The all view always returns combined totals + a bySource: { claude, codex } breakdown — one call, two answers.
Prompt examples
- "How much did I spend on AI coding this week, broken down by Claude vs Codex?"
- "Show me a daily cost trend for the last 30 days."
- "Top 5 most expensive sessions this month?"
- "What did I work on yesterday? Group by project."
- "Generate a Monday standup bullet list of what I shipped last week."
- "At my current burn rate, how much will I spend this month? If I run another 200K input + 50K output on Opus 4.7 today, what does that add?"
Privacy & troubleshooting
- stdio only in v1 — no network ports.
- Reads only existing JSONL files; absolute paths in error messages are scrubbed (
$HOME→~).
| Symptom | Try |
|---|---|
| Client doesn't see tools | Restart client after editing config; run ccgauge mcp --check or ccgauge doctor |
| First call is slow | Cold start indexes all JSONL (~1–3s for 100 files); subsequent calls are O(1) |
| "no providers detected" | Pass CLAUDE_CONFIG_DIR / CCGAUGE_CODEX_DIR via env in MCP config |
| Want to see server logs | Watch client's MCP log — ccgauge writes to stderr (stdout is reserved for JSON-RPC) |
Configuration
ccgauge auto-detects standard locations:
| Provider | Default sources |
|---|---|
| Claude Code | ~/.claude/projects, ~/.config/claude/projects |
| OpenAI Codex CLI | ~/.codex/sessions, ~/.codex/archived_sessions |
Override / extend via environment variables:
| Variable | Effect |
|---|---|
CLAUDE_CONFIG_DIR |
Add <dir>/projects as a Claude data source |
CCGAUGE_CONFIG_DIR |
Same as above (legacy ccgauge name) |
CCGAUGE_CODEX_DIR |
Add an extra Codex sessions directory |
CODEX_HOME |
Add <dir>/sessions and <dir>/archived_sessions |
CCGAUGE_STATE_DIR |
Override background service state / log directory |
Develop
git clone https://github.com/chengzuopeng/ccgauge.git
cd ccgauge
pnpm install
pnpm dev               # http://localhost:3738
pnpm typecheck         # tsc --noEmit
pnpm test              # parser smoke tests (Node 22+)
pnpm build             # next build + bundle MCP + bundle CLI report
The repo is a working Next.js project — hot-reload against your live data while iterating. Adding a third provider (Gemini CLI, Cursor, Aider, …) is one new directory in lib/providers/<name>/ plus one registry line — scan.ts, the aggregator, the pricing module, and every page need no changes.
The marketing site lives in site/ (Astro + Tailwind) and ships separately from the npm package — run with pnpm site:dev.
Troubleshooting
First stop for any "why doesn't this work" question:
ccgauge doctor. One screen, version + env + build artifacts + service state + per-provider scan. Paste into bug reports.
| Symptom | Try |
|---|---|
| Port keeps drifting | ccgauge --strict-port --port 3737 |
| Stale background service | ccgauge status, then ccgauge stop --force |
| Background didn't start | ccgauge logs reads ~/.ccgauge/ccgauge.log |
| No data shown for Codex | Ensure ~/.codex/sessions exists; check the Settings page for detected paths |
| Want to bypass auto-open | ccgauge --no-open |
FAQ
Does ccgauge upload anything?
No. Runs entirely on your machine; reads JSONL files Claude Code and Codex CLI already store locally; zero outbound calls; no API credentials needed.
How is this different from ccusage?
ccusage is a CLI that prints usage tables. ccgauge is a polished web dashboard with charts, per-session drill-down, a 5h rate-limit countdown, project / model breakdowns — and also covers OpenAI Codex CLI out of the box. Plus an MCP server so your LLM can answer questions about your usage in plain English, and an in-terminal TUI dashboard (ccgauge report -d) for when the browser isn't an option.
Does it work for Claude Pro / Max / Team / Codex Plus subscribers?
Yes. The dashboard always reports the API-equivalent dollar value of your usage — useful to gauge "how much would this cost on PAYG?". Subscription plans bill differently; ccgauge is not your invoice.
Which models are supported?
All claude-* (Opus / Sonnet / Haiku, 3.x and 4.x) and the gpt-5 family + gpt-4.1 family + o-series (o3, o4-mini). Unknown models fall back to family-latest pricing automatically.
License
MIT — see LICENSE.
Reviews (0)
Sign in to leave a review.
Leave a reviewNo results found