marmot
Health Warn
- License — License: MIT
- Description — Repository has a description
- Active repo — Last push 0 days ago
- Low visibility — Only 5 GitHub stars
Code Fail
- process.env — Environment variable access in scripts/hook.mjs
- process.env — Environment variable access in src/format.mjs
- exec() — Shell command execution in src/html.mjs
Permissions Pass
- Permissions — No dangerous permissions requested
No AI report is available for this listing yet.
Get smart nudges about leaks that might be bleeding your tokens. Based on real-time analysis on your coding agent sessions.
 Marmot


Alpha. This is early software, and it reads a file format that is internal
and undocumented — a Claude Code update can break a metric. Runningmarmot doctorshows what's still readable on your machine.
Bugs and ideas are welcome, in
issues or on
Discord.
Spend fewer tokens on Claude Code — with nudges that arrive while you can still do something about it.
Most of what you burn is not the work. It is context you are carrying and not
using, tool definitions loaded on every request and never called, a premium
model on a job that did not need one, a session that has been open for three
days. None of it announces itself, and by the time a number looks wrong the
tokens are gone.
Marmot reads the session records Claude Code already writes to your disk, finds
those patterns, and interrupts you at the point where stopping is still worth
something. Same tokens your plan limits are counted in.
Node 18+, zero dependencies, entirely local. Works on all Claude plans.
Quick install
npm install -g github:DrDroidLab/marmot   # installs the `marmot` command
marmot init --hooks                       # wires up the nudges
Then restart Claude Code.
If you get stuck, drop a message on Discord.
What it catches
A real one, from the machine this was built on:
  ▲ MCP servers attached but never called
    sentry, github, kubernetes, datadog, linear, google-sheets — configured,
    and not invoked once in this window. Their tool definitions are ~16,262
    tokens, sent with every request — 43% of your 37.4K median session prefix.
    Detaching what you do not use is a straight saving on every request.
Nothing in Claude Code surfaces that, and it had been true for weeks. The rest
of what it looks for:
| Nudge | The waste it finds |
|---|---|
mcp-idle |
Tool definitions shipped on every request for servers you never call |
session-turns |
A long session re-sending every earlier turn into every later one |
session-topics |
A session resumed days later, still carrying context for work you finished |
premium-light-work |
A premium model on a job Sonnet would have done |
premium-window |
…and that becoming a habit rather than a one-off |
cache-hit |
Context being rebuilt each turn instead of continued — cache reads cost a tenth of fresh input |
tool-errors |
Failed calls, paid for twice: once to fail, once to retry |
limit-reached |
Half, three quarters, then nine tenths of your plan's 5-hour or weekly allowance gone |
limit-pace |
Spending a window faster than it passes — 78% gone with half the week left |
limit-drivers |
What Claude Code itself says is eating your limits, quoted rather than inferred |
daily-baseline |
A day well past your own normal, whatever normal is for you |
session-cost / daily-cost |
A session or day past a dollar ceiling — pay-as-you-go only, see below |
Every rule is deterministic and local. No model decides whether to nudge
you, and every threshold is yours to move.
Usage
| Command | What it does |
|---|---|
marmot |
Nudges, plus the window they came from |
marmot remind |
Show or set when a nudge fires |
marmot config |
Open the thresholds file; config set k=v changes one |
marmot browse |
Build the session browser page and open it |
marmot nudges |
Just the nudges, nothing else |
marmot sessions |
One line per session |
marmot mcp-audit |
Measure what each MCP server's tool definitions cost |
marmot test-notification |
Send one, and say what it did and where to look if it did not arrive |
marmot doctor |
What's readable on this machine, and what isn't |
marmot init |
Write the thresholds file; --hooks and --statusline install those |
marmot is the one to reach for, and every flag below works on it —marmot --days 7. nudges is the same findings with the reporting stripped
out, which is what you want in a script or a pre-commit hook.
| Flag | |
|---|---|
--days N |
Window, default 30 |
--sessions |
Add the per-session list to the report |
--demo |
Synthetic data, safe for screenshots |
--json |
Machine-readable |
--root DIR |
Claude Code home, default ~/.claude |
--session ID |
browse: just this one |
--limit N |
browse: full timelines for the most recent N, default 25 — every session in the window is counted either way |
--no-text |
browse: counts and tool names only, no prompts |
--browse |
Build and open the page even when output is piped |
--no-browse |
Never build or open it |
--no-audit |
Skip measuring MCP servers this run |
--no-refresh |
Skip refreshing plan limits this run |
Chasing a nudge to its source
Run marmot at a terminal and it builds the page and opens it. Run it with the
output piped — from a script, a cron job, or a coding agent — and it stays in
the terminal, because writing a multi-megabyte page and taking over the display
is not what those callers asked for. --browse forces it either way,--no-browse never.
Every session in the window is counted in the figures at the top. The
turn-by-turn timelines are carried for the most recent 25 (--limit), because
all of them together would be three times the size — open an older one and it
says so, with the command to read just that session.
Each run writes a new file, stamped to the minute, so the browser can never
serve you a cached copy of an earlier one. The five most recent are kept and
older ones removed — a page of 25 real sessions is a few megabytes.
One self-contained HTML file, written locally — no CDN, no network, no web fonts.
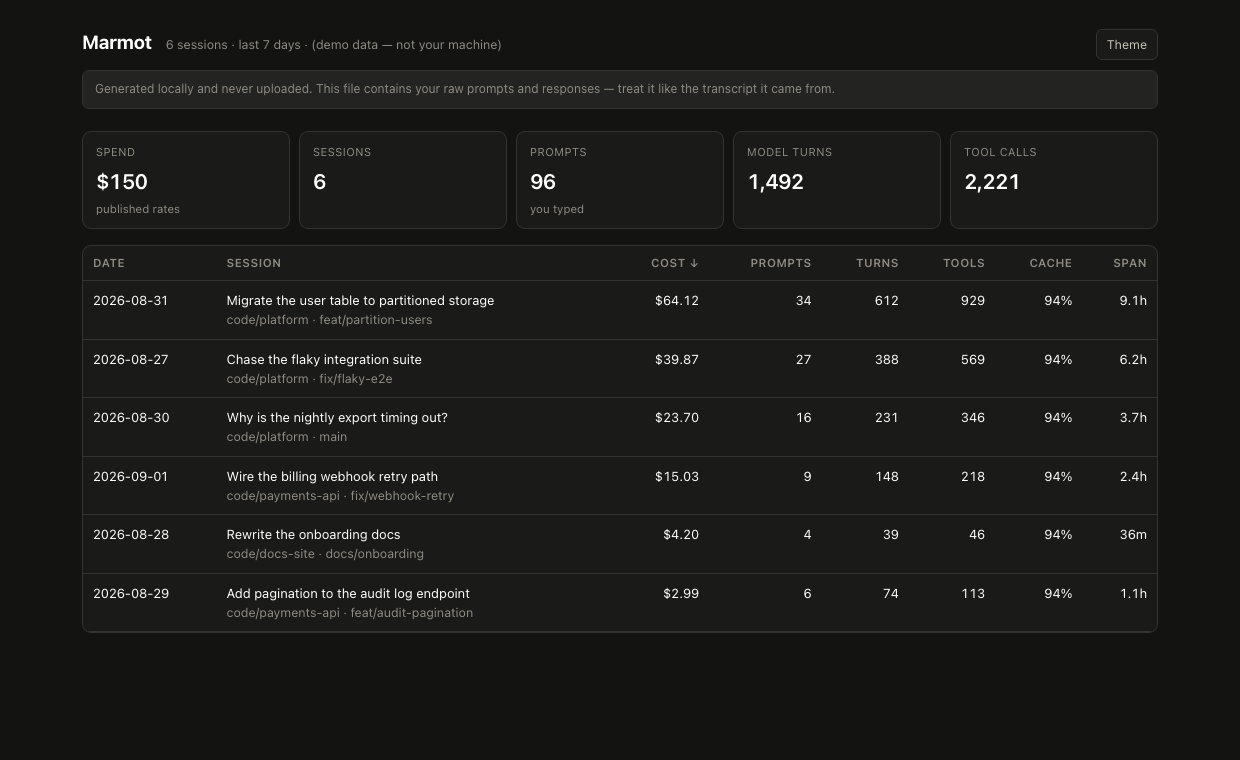
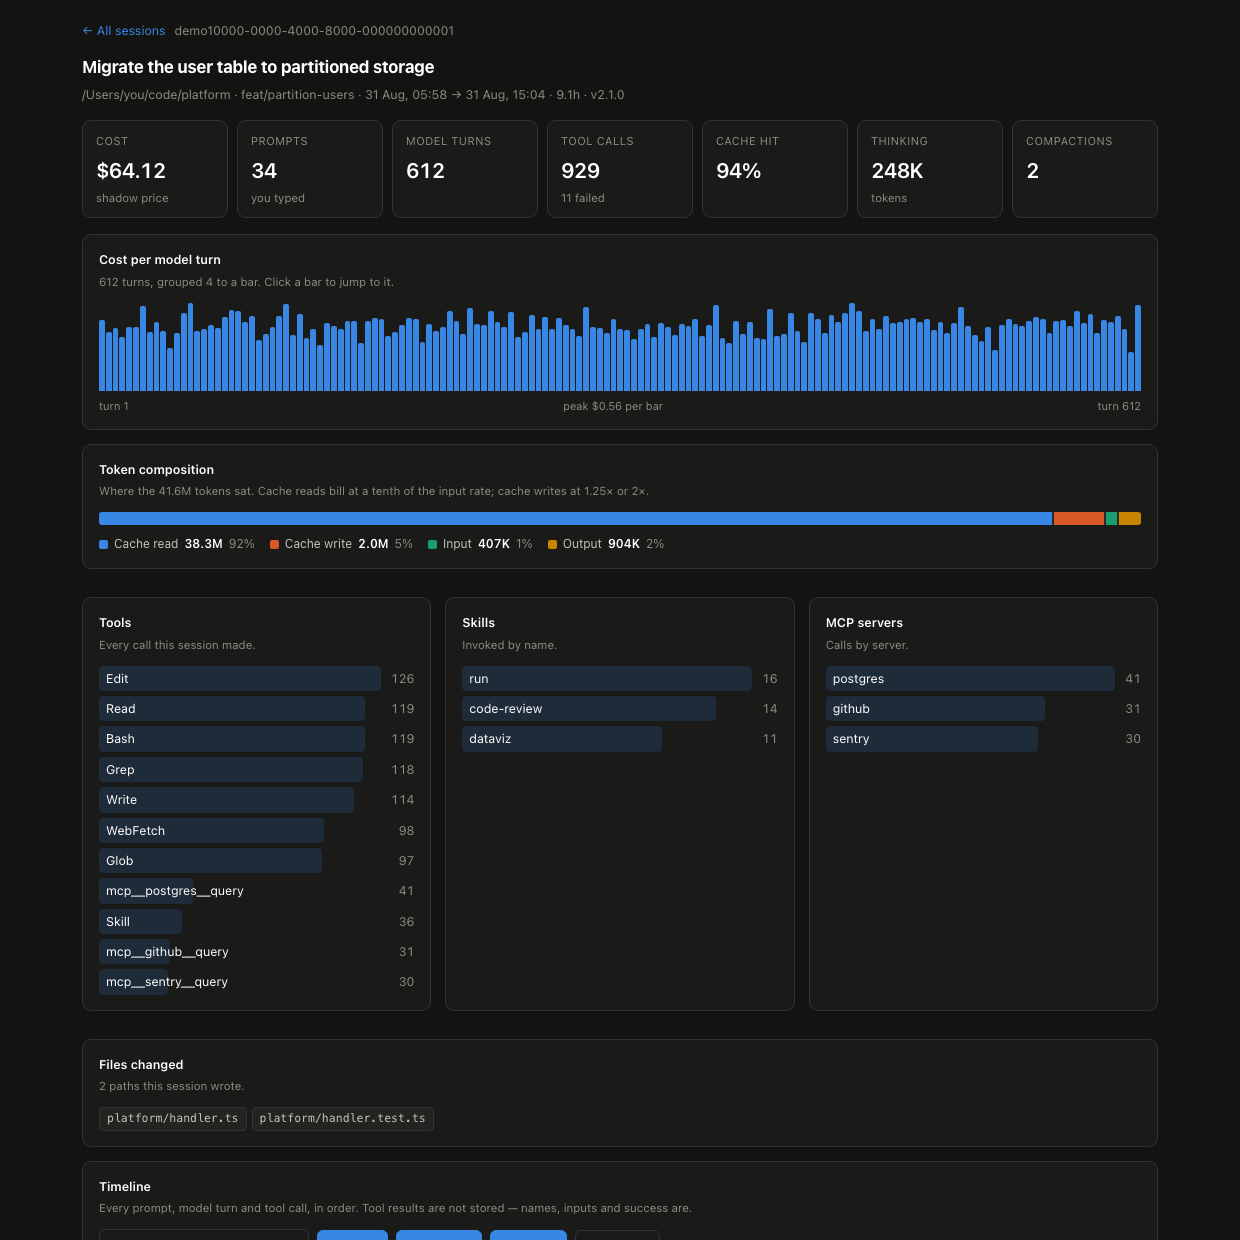
It opens on the same figures as the report — spend, tokens, cache, baseline context, your plan's live limit percentages, the model split, skills, MCP servers and every nudge — because they are computed once in Node and shipped with the page rather than recalculated in the browser. Models, skills and MCP calls each get a stacked column per day across the window, which answers what a total cannot: whether something is a habit or a one-off, and which server has no bar at all. From there each session opens onto its full timeline — every prompt, reply and tool call, with a cost-per-turn chart, the token split, a text filter and an errors-only toggle — which is how you find the turn where a session started getting expensive.
Finding the cheapest saving you have
Idle MCP servers are usually the largest single win, because their cost is paid
on every request rather than once. Nothing on disk records how big those tool
definitions are, so Marmot asks the servers directly:
marmot mcp-audit
  Server                   Tools    Tokens    Calls (30d)
  github                      26     ~4.1K            142
  kubernetes                  28     ~5.2K             18
  sentry                      14     ~2.3K              0  ▲
  datadog                     22     ~3.6K              0  ▲

  15,200 tokens of tool definitions ride on every request.
  ~5,900 of them (39%) belong to 2 servers you have not called in 30 days:
  sentry, datadog
The report does this for you when it has no recent figures, and caches the
result for a week. It is the only thing Marmot does that starts your servers
rather than reading a file — mcp.autoAudit: false or --no-audit keeps it
read-only. --tools breaks it down per tool.
When it reaches you
Timing is the whole point, and you choose which rules speak when. The live
list interrupts mid-session — the only moment you can still change course on the
session you are in. Everything else waits for the daily digest, because a nudge
you cannot act on right now is an interruption rather than a nudge.
Each one speaks once per session, again at each doubling for cost, and at each
mark you pass on the way to a limit.
The evidence behind every nudge
A nudge you cannot trace produces suspicion rather than a change of habit, so
Marmot prints the window every figure came from:
  Marmot · your last 30 days
  40 sessions · everything below was read from ~/.claude/projects on this machine

  Spend              $4,184     modelled at published rates
  Prompts you typed  926        per session: 23.1 mean · 16 median · 79 p99
  Tokens             5.8B       input, output and cache
  Cache hit rate     98%        higher is cheaper
  Tool calls         13,768     3% failed
  Baseline context   35.3K      median, before you type — prompt, skills, tool definitions

  Daily              ▃▂▄▁▃█▆▃▂▁▄▁▂▆▁▅▄▅  peak $671 · median $233

  Where it went
  claude-opus-5      $4,092     98% · 5.7B tokens
  claude-sonnet-5    $92        2% · 104M tokens

  Tools failing
  Bash                        126 of  4,933    3%
  mcp__supabase__execute_sql    3 of      3  100%
  Every failure is paid for twice — once to fail, once to retry.

  Skills
  dataviz            6×         ~4.1K tokens to load

  MCP servers
  github            142×  26 tools · ~4.0K tokens
  sentry              0×  14 tools · ~2.3K tokens  ▲ never called
                    18,825 tokens on every request, 16,262 of them idle
Dollars, or allowance
On a subscription the dollar figure is not what you pay — you already paid it,
and what you actually spend is allowance. So Marmot reads your plan and your
real limit utilisation from what Claude Code caches, and reports both:
  Marmot · your last 7 days
  23 sessions · Max 20× · everything below was read from ~/.claude/projects

  Modelled spend        $1,825    at API rates — not what you pay on Max 20×
  5-hour session limit  5%        resets in 1.2h
  Weekly limit          19%       resets in 3.0d
  Usage credits         $0.00 of $50.00   real money, beyond the plan
On pay-as-you-go the same figure is the real price, and it is labelled
Spend rather than Modelled spend — there the dollars are the point.
The windows Claude plans actually use — there is no daily one:
| Window | What it is |
|---|---|
| 5-hour session | A rolling window, the one you hit mid-afternoon. Refills on its own. |
| Weekly | Seven days, across everything. |
| Weekly, per model | A second seven-day window scoped to one model, shown only when it is in use. |
| Usage credits | Real money beyond the plan, if you have them enabled. A monthly cap in dollars, and the one figure here that is an actual bill. |
The percentages come from the snapshot Claude Code caches, which can be hours
old — and a reading whose window has already reset is worse than stale, it
is dead: "5% used" about a window that no longer exists reads as plenty left
when the truth is nobody has measured.
So Marmot refreshes it when it needs to, by asking Claude Code:
Refreshing your plan limits — this asks Claude Code, and costs no tokens.
That runs claude -p /usage, which is handled entirely client-side — no model
turn, no session, no transcript, and no credentials of ours. It happens on the
report and on the daily digest, never on the per-turn hook, which has to stay
fast. limits.autoRefresh: false or --no-refresh turns it off, and then a
reading past its window shows as — rather than as a number.
Subscription plans return no dollar value for a limit, which is exactly why
percent is the unit.
Below that it splits by project — each working directory is its own Claude
Code setup, with its own MCP servers and skills:
  By project · 7 setups
  /Users/you/code/platform            $1,128    7 sess   269 prompts  +sprinto
  /Users/you/code/payments-api          $438    5 sess    74 prompts
  /Users/you/code/aiops                 $188    2 sess    58 prompts  +context7
                                        every nudge below is across all of them
+name marks a server attached only in that directory — the part of a setup
that is invisible from anywhere else. The nudges are deliberately not split:
a plan limit is spent from one pool, whichever repo emptied it.
Every figure is the same wherever you run marmot from. It reads the whole of~/.claude/projects, and works out which MCP servers were attached from the
directories of the sessions in the window rather than from wherever you
happen to be standing — so cd-ing somewhere else cannot change the answer.
Baseline context is what every request carries before you type — system
prompt, skill descriptions, every attached tool definition — and it is what
makes an idle server legible as a cost rather than a checkbox.
Spend is a shadow price: what these tokens would have cost at published API
rates, not an invoice line. Right for comparing your own sessions to each
other, wrong for finance.
Upgrading
npm install -g github:DrDroidLab/marmot
The same command as installing. npm re-fetches the repository and replaces what
you have — there is no version to bump, because it installs whatever main
currently is.
If a change does not show up, npm has served the install from its cache:
npm cache clean --force && npm install -g github:DrDroidLab/marmot
Check it worked
marmot doctor
  Root            /Users/you/.claude
  Plan            Max 20×
  Sessions        57 in 30 days
  Thresholds      /Users/you/.claude/marmot.json
  Priced turns    14,401 of 14,401
  Nudge hooks     SessionStart, Stop
  Notifications   on · iTerm2 posts them itself, with nothing to allow
Three lines to read:
Nudge hooksmust saySessionStart, Stop. Anything else names the
problem —not installed,Stop missing, orpoints at a missing fileif a
hook still refers to an install that has been removed. The fix in every case
ismarmot init --hooks.Planconfirms it can see your subscription, which is what the limit
nudges are measured against.Notificationsnames the channel a nudge would actually arrive on.
If marmot is not found at all, npm's global bin directory is not on your PATH —npm bin -g prints it.
Nothing is published to npm yet — npm installs straight from the repository, and
there are no dependencies to fetch, so it takes a few seconds. marmot is then
on your PATH for every terminal and every coding-agent session on the machine.
Installing this with a coding agent? Give it both commands from the
install section. The second one edits~/.claude/settings.json, so an agent
may reasonably stop and ask first. It is safe to run unattended, and here is
exactly why:
- It appends two entries —
SessionStartandStop— and changes nothing
else in the file. Your statusline, permissions and other hooks are untouched.- It copies the file first to
settings.json.marmot-backupbefore writing.- It is idempotent: run it twice and the second run reports there is
nothing to do.- It is reversible in one command:
marmot init --hooks --remove, which
takes out only Marmot's own entries.- It refuses rather than overwrites if the file is not valid JSON.
To see the change before making it:
marmot init --hooks --dry-runprints
what it would do and writes nothing.
It opens on the same figures as the report — spend, tokens, cache, baseline context, your plan's live limit percentages, the model split, skills, MCP servers and every nudge — because they are computed once in Node and shipped with the page rather than recalculated in the browser. Spend, model tokens, skills and MCP calls each get a stacked column per day across the window — hover any column for the breakdown — which answers what a total cannot: whether something is a habit or a one-off, and which server has no bar at all. Your plan's limits get a gauge each, and the tools that are failing get named rather than left inside a "3% failed" summary. From there each session opens onto its full timeline — every prompt, reply and tool call, with a cost-per-turn chart, the token split, a text filter and an errors-only toggle — which is how you find the turn where a session started getting expensive.
marmot init --hooks --dry-run   # print what would change, write nothing
marmot init --hooks --remove    # take Marmot's hooks back out
What the hooks give you:
- Live nudges at the end of a turn, for the rules in
live— the ones you
can still act on. Once per rule, again at each doubling for cost, with a bell
and a desktop notification so they do not scroll past. - A daily digest on your first session each day: what yesterday cost, and
what it flagged.
The statusline is a separate opt-in, since it replaces whatever you have:
marmot init --statusline
$12.40 · 57 prompts · 41% ctx · 97% cache · Opus ▲
The ▲ appears once you're past your own caps — the cheapest possible reminder,
always in view.
Configuration
The defaults are deliberately quiet, so this is optional — but it is the
difference between nudges you act on and nudges you mute. If a rule fires on
most of your sessions it is describing how you work rather than flagging
anything, and it should be raised, not ignored.
marmot config set session.costCap=50           # change one threshold
marmot config set 'limits.steps=[25,50,75]'    # values are JSON: lists, numbers, booleans
marmot config set notify.bell=false mcp.autoAudit=false
It prints what changed, creates the file from the defaults if you have none, and
leaves every other key alone:
  /Users/you/.claude/marmot.json
    session.costCap: 25 → 50
That is the form to reach for from a script or a coding agent. To read or edit
the whole thing by hand:
marmot config          # opens it in your editor
marmot config --print  # ...or just print it
Nothing needs restarting — the next run reads it.
It opens in a real text editor rather than a preview — $VISUAL/$EDITOR, else
the platform default. A terminal editor like vim is used only where there is a
terminal to attach it to, so a non-interactive run opens a window rather than
hanging on an editor with nothing to attach to.
What Claude Code says is eating your limits
Refreshing the limits also captures something no local file holds: Anthropic's
own attribution of what your usage is going on.
  What is driving your limits · last 7d
  Claude Code's own attribution, over 2,594 requests in 19 sessions.
     96%  of your usage was at >150k context
     80%  of your usage came from sessions active for 8+ hours
          top skills: claude-api 1%
          top mcp servers: sprinto 1%
This is the most credible thing here, because it is not inferred from
transcripts — it is the source's own accounting, and it names the two habits a
transcript cannot see directly. limit-drivers quotes it when a share passeslimits.driverMinPercent (60% by default).
It is human-formatted text with no stability guarantee, so it is parsed the way
the transcript readers are written: every line optional, anything unrecognised
skipped, a format change costing the section rather than the report.
Reminders
marmot remind                      # what fires, and when
marmot remind --at 50,75,90        # quota marks, as percentages
marmot remind --cap 100            # a dollar ceiling, for plans without quota
marmot remind --off
Which of those two applies is decided by your plan, not by you having to know:
| Your plan | The ceiling |
|---|---|
| Pro, Max, most Team seats | The quota your plan reports. Marks at 50%, 75%, 90% of the 5-hour window and the week, overridable with --at. Dollar caps stay quiet, because the money is already spent. |
| Enterprise, or any plan reporting no quota | Money, since there is no percentage to measure. A daily cap — --cap 100 sets it, and a session cap at half. |
| Pay-as-you-go API | Money, because there the figure really is the bill. |
One interruption at a time. Crossing 50% and 75% inside the same minute is
two true things and one interruption too many, so a live nudge buys twenty
minutes of quiet (interrupt.minGapMins). Nothing is lost — whatever was held
back is still in marmot and in tomorrow's digest.
Limit thresholds
limit-reached speaks at marks on the way to a limit rather than at one cap,
so you hear half gone long before nearly out. Each mark speaks once.
limit-pace answers the question a percentage cannot: 78% used is fine on the
last day of the week and alarming on the first. It compares how much of the
window you have spent against how much of it has passed, and speaks only when
the allowance would run out with time still on the clock:
  ▲ Spending your weekly allowance faster than it refills
    43% through the weekly window with 78% of it gone — 1.8× the pace that
    would last. At this rate it runs out in about 20.3h, 3.2d before it resets.
"limits": {
  "enabled": true,
  "steps": [50, 75, 90],        // the default marks
  "byPlan": {                   // the same percentage is a different amount of room
    "Pro":        [50, 75, 90],
    "Max 5×":     [50, 75, 90],
    "Max 20×":    [50, 75, 90],
    "Team":       [50, 75, 90],
    "Enterprise": [50, 75, 90],
    "API":        []            // nothing to run out of
  }
}
The nudge thresholds
| Rule | Fires when | Default |
|---|---|---|
session-turns |
Prompts you typed in one session, and it never compacted | > 20 |
session-cost |
One session's modelled cost | > $25 |
daily-cost |
Today's total | > $50 |
daily-baseline |
Today against your own trailing average | > 2.5σ over 14 days |
premium-light-work |
Premium-model share on a session that stayed small | > 70% and < 10 tool calls, or docs/tests only |
cache-hit |
Input tokens served from cache | < 70% over ≥ 20 turns |
tool-errors |
Failed tool calls | > 10% over ≥ 20 calls |
mcp-idle |
Servers configured and never invoked | any |
session-topics |
A long session resumed after a gap, in a different area | > 1 day gap, ≥ 2 areas |
premium-window |
A habit of premium models on small sessions | ≥ 5 sessions |
If a rule fires on nearly every session, raise its cap rather than removing
it. Every rule carries three guards — a ratio gap, a minimum sample and a
dollar floor — because a nudge that always fires gets muted, and then none of
them work.
The keys people actually change
{
  // Which rules may interrupt you mid-session. Everything else waits
  // for the daily digest.
  "live": ["session-cost", "daily-cost", "daily-baseline",
           "session-turns", "limit-reached"],

  // How a nudge reaches you, beyond the line in the transcript.
  // "app" overrides which macOS app posts the notification — see below.
  "notify": { "desktop": true, "bell": true, "app": null, "sound": "Ping",
               "persist": true },

  // "off" stops the daily digest entirely.
  "digest": { "cadence": "daily" },

  // Marks on the way to your plan's limits. Each speaks once. See below.
  "limits": { "enabled": true, "steps": [50, 75, 90], "autoRefresh": true,
               "paceRatio": 1.5, "paceMinElapsed": 15, "paceMinUsed": 20,
               "driverMinPercent": 60 },

  // How many generated pages to keep in ~/.claude/marmot.
  "browse": { "keep": 5 },

  // The report measures your MCP servers when it has nothing recent.
  // autoAudit false means it only ever measures when you ask it to.
  "mcp": { "enabled": true, "autoAudit": true, "auditMaxAgeDays": 7 },

  "session": { "costCap": 25, "turnCap": 20, "costFloor": 1 },
  "daily":   { "costCap": 50, "baselineSigma": 2.5, "baselineDays": 14 },

  // Set these if you are on negotiated rates and want the modelled
  // cost to match your contract. USD per million tokens.
  "rateOverrides": { "claude-opus-5": { "in": 5, "out": 25 } }
}
config writes every key with its default — these are the ones worth
knowing about.
The dollar caps do not fire on a subscription at all. session.costCap anddaily.costCap are absolute figures in modelled dollars, and on a plan you pay
a flat fee for, "$511 today against a $50 cap" is not overspending — it is a
Tuesday. A rule that says otherwise every day gets muted along with the ones
worth reading, so Marmot skips them once it detects a subscription and leans onlimit-reached and daily-baseline instead. On pay-as-you-go they fire
normally, because there the figure really is the bill. A plan it cannot detect
is treated as billed, which is the safer way round.
Turning the alerts down. notify.bell rings the terminal bell,notify.desktop raises a system notification. Set either to false.MARMOT_NO_NOTIFY=1 silences both for one run, and CI is silent automatically.
How a notification gets to you. Your terminal posts it itself where it can,
via an OSC escape sequence — iTerm2, Ghostty, WezTerm, kitty, Konsole, Windows
Terminal and Hyper all support this, with nothing to install or allow.
Otherwise the OS does: osascript, notify-send or PowerShell, all of which
ship with it. doctor names the channel in force.
Terminals not known to support the sequence are never sent one, since an
unrecognised escape code can print as visible garbage. The marmot appears on
Linux and Windows; macOS shows the posting app's icon and gives us no say.
If no notification arrives
Check the quiet-hours setting first. This is the usual answer, and it
suppresses notifications from every app at once, so nothing you change in
Marmot will help until it is off.
| Where to look | |
|---|---|
| macOS | Click the clock → is a Focus mode on? Or Control Centre → Focus. Do Not Disturb hides everything, including notifications from apps that are fully allowed. |
| Windows 11 | Settings → System → Notifications → Do not disturb off. Check Notifications itself is on, and that focus sessions are not scheduled. |
| Windows 10 | Settings → System → Focus assist → set to Off. |
| GNOME | Settings → Notifications → Do Not Disturb off. |
| KDE Plasma | System Settings → Notifications → Do Not Disturb off. |
Then check the app is allowed. On macOS, System Settings → Notifications →
the app doctor names. If it is not in that list it cannot be granted —
macOS only lists apps that have registered themselves — so point Marmot at one
that is: "notify": { "app": "com.googlecode.iterm2" }, a bundle id or an app
name. On Windows, allow notifications from PowerShell. On Linux, notify-send
needs libnotify (libnotify-bin on Debian and Ubuntu).
Or set notify.desktop to false — the bell and the nudge in your transcript
are unaffected either way.
Testing them. marmot test-notification sends one through exactly the path a
real nudge uses, then says which channel carried it, whether the bell rang, and
what to check if nothing appeared — in order of likelihood, starting with the
quiet-hours setting that suppresses every app at once.
Making them wait for you. notify.persist is on by default and means "stay
up until dismissed", as far as each platform allows:
| What it does | |
|---|---|
| Linux | Sent at critical urgency, which is what stops a notification daemon expiring it. |
| Windows | The balloon is held up for a minute, and lands in the Action Centre regardless. |
| macOS | Nothing Marmot can do — display notification has no persistence option at all. Whether one waits or fades is the Alert style of the app posting it: System Settings → Notifications → that app → Alert style: Alerts. marmot doctor names the app and repeats this. |
| Terminal | The terminal's own notification, on its own terms. |
About the bell. notify.bell writes a terminal BEL to /dev/tty, and asks
the notification to play a sound. The sound is the reliable half: a hook's
output is a pipe Claude Code reads, not a terminal, so stderr would swallow the
BEL. notify.sound names it; Ping by default.
Measuring MCP servers less often. Raise mcp.auditMaxAgeDays, or setmcp.autoAudit to false and run mcp-audit when it suits you.
Starting the nudges over. ~/.claude/marmot-state.json records what has
already been said. Delete it to hear everything again.
Why you can trust the numbers
A nudge is only worth acting on if the figure behind it is right. The transcript
format is internal and undocumented, and two details in it are easy to read
wrong — both of which would have a rule firing on a session that was fine, or
staying quiet on one that was not:
- Cache writes are priced at their actual TTL — 2× at one hour, 1.25× at five minutes. Claude Code writes 1h entries, so pricing every write at 1.25× understates a heavy session by about a fifth.
- Usage is counted once per API response. Claude Code writes one JSONL entry per content block, and every one repeats the same
usageobject. Summing per entry inflates cost and turns by roughly 1.9× on a tool-heavy session. Marmot dedupes bymessage.id.
And a "turn" means a prompt you typed. Tool results arrive as user entries too, so counting every user entry reads a 57-prompt session as 1,191.
Privacy
Everything runs locally. Nothing is uploaded, and there is no service to upload it to — no account, no API key, no server.
The report reads only counts, identifiers and tool names, never your prompt or response text. To name your plan and its limits it reads ~/.claude.json, taking the rate-limit tier and the cached utilisation percentages — never the email address, account ids or organisation name that sit beside them. The browser page does read them, because that is the point of it; browse --no-text leaves the text out if you want to share it.
Tool results are never stored — around 95% of the bytes on disk, and dropping them is what turns a 41MB transcript into a 1MB page.
License
MIT
Reviews (0)
Sign in to leave a review.
Leave a reviewNo results found