dotnet-matplotlib
Health Warn
- License — License: MIT
- Description — Repository has a description
- Active repo — Last push 0 days ago
- Low visibility — Only 8 GitHub stars
Code Pass
- Code scan — Scanned 6 files during light audit, no dangerous patterns found
Permissions Pass
- Permissions — No dangerous permissions requested
No AI report is available for this listing yet.
A native .NET 10 port of Matplotlib in F# — pure-managed plotting (SVG · PNG · PDF) with a pyplot-style API and zero native dependencies.
dotnet-matplotlib

![]()
A native .NET 10 port of Matplotlib — the de-facto
2D plotting library for Python — rebuilt in idiomatic F# following
Object-Oriented and Domain-Driven Design principles.
A faithful port of Matplotlib's plotting model
(Figure/Axes/Artist/Transform/Backend) with a familiarpyplot-style facade, producing publication-quality output with zero native
dependencies — pure-managed SVG, PNG and PDF backends.
Gallery
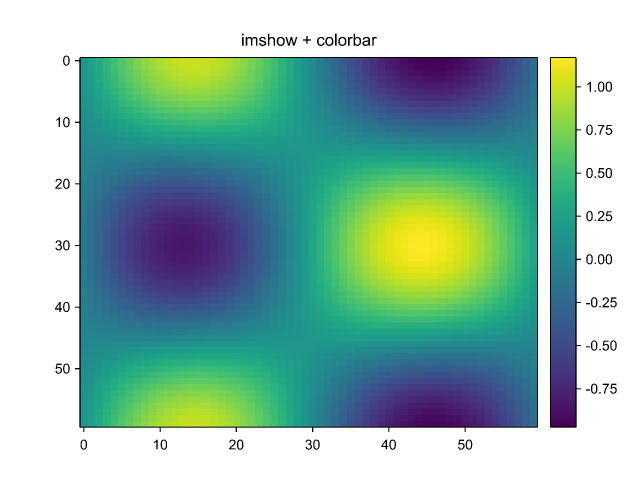 imshow + colorbar (viridis) |
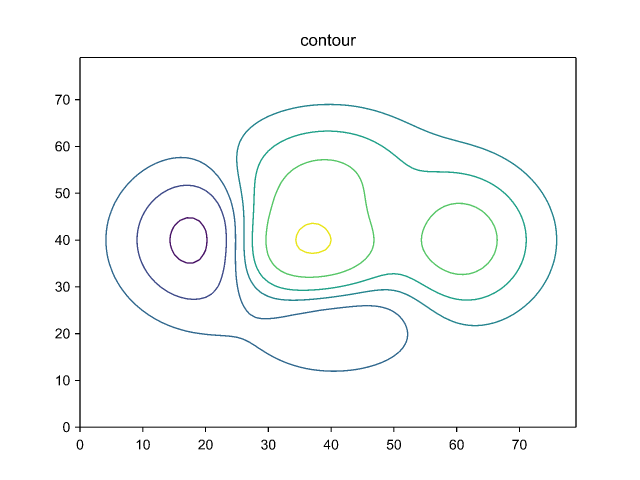 contour (marching squares) |
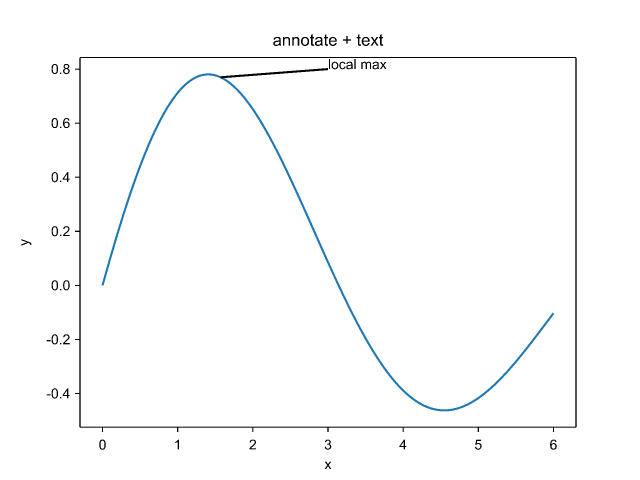 annotate + text |
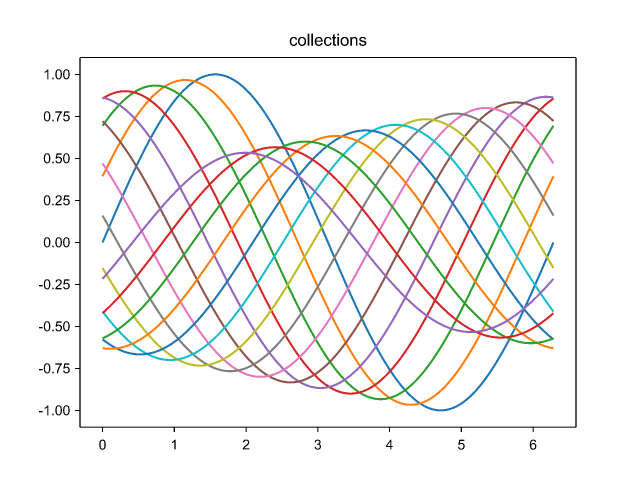 line collections |
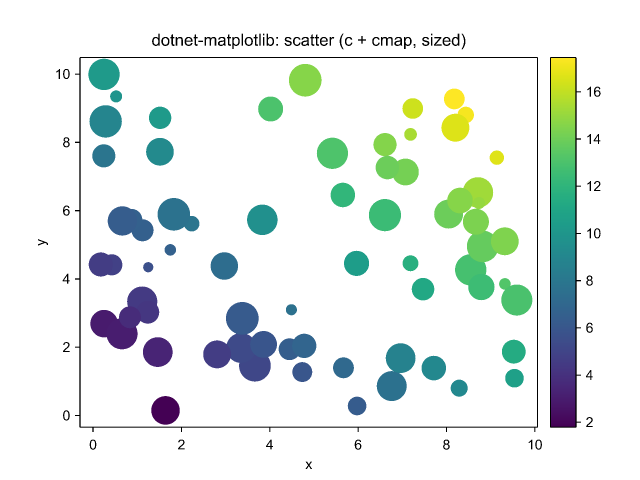 scatter (colormapped c, sized s) |
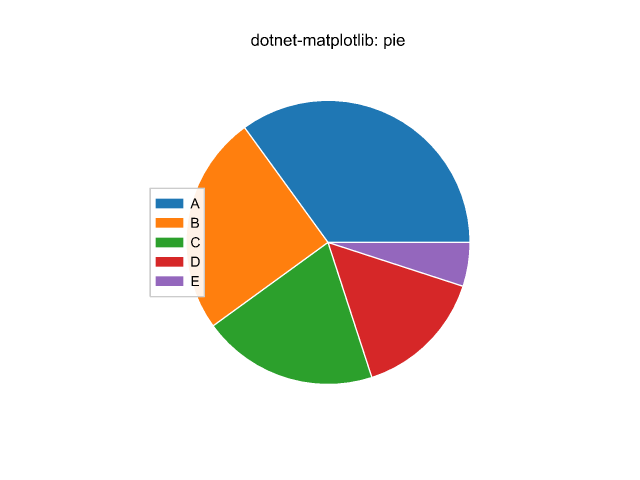 pie (set_aspect('equal')) |
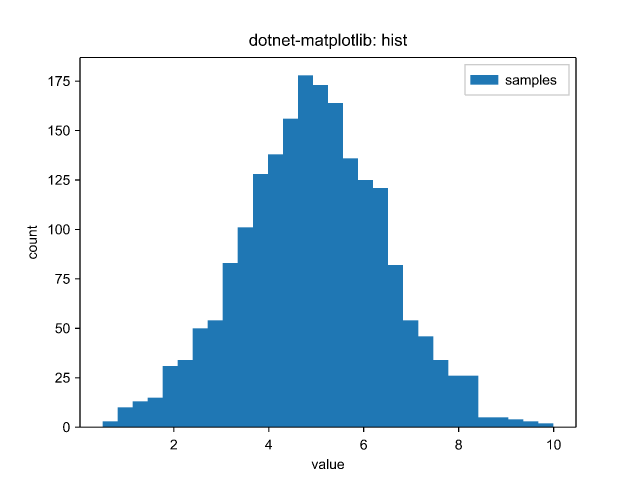 hist |
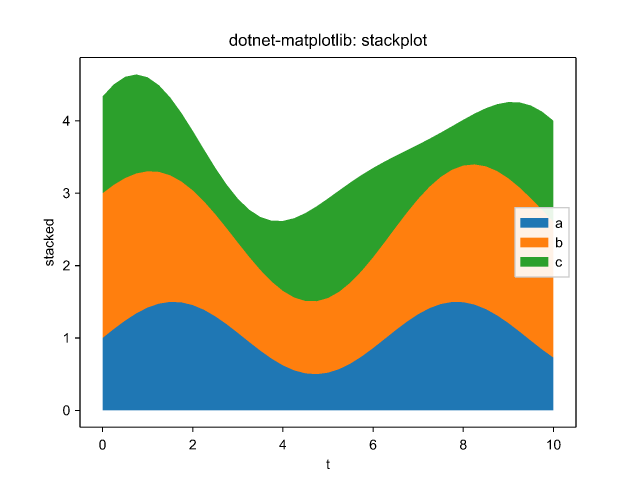 stackplot |
Install
dotnet add package DotnetMatplotlib
open Matplotlib

let plt = Pyplot()
plt.Plot([| 1.0; 2.0; 3.0; 4.0 |], [| 1.0; 4.0; 9.0; 16.0 |], color = "C0", label = "y = x^2")
|> ignore
plt.Title "Hello, dotnet-matplotlib"
plt.XLabel "x"
plt.YLabel "y"
plt.Legend()
plt.Savefig "hello.svg"
Output formats
Savefig chooses the format from the file extension. SVG, PNG and PDF are
all pure-managed and cross-platform (zero native dependencies):
plt.Savefig "plot.svg"   // vector SVG
plt.Savefig "plot.png"   // raster PNG (software rasterizer, anti-aliased)
plt.Savefig "plot.pdf"   // vector PDF
Text uses TrueType fonts discovered from the system. To select a font, set the
default family before plotting — the equivalent of Matplotlib'srcParams["font.family"]:
plt.FontFamily <- "serif"
Animations are written as looping GIFs:
// factory builds the Figure for each frame index
plt.SaveGif("wave.gif", 30, (fun i -> buildFrame i), fps = 20)
Interactive window
Figures can also be shown in a live window — the equivalent of Matplotlib'splt.show(). This is an opt-in, Windows-only backend (WinForms + GDI+) that
lives in Matplotlib.Gui, so the default path stays free of any UI dependency:
open Matplotlib
open Matplotlib.Gui   // adds plt.Show()

let plt = Pyplot()
plt.Plot([| 0.0; 1.0; 2.0; 3.0 |], [| 0.0; 1.0; 4.0; 9.0 |], color = "C0") |> ignore
plt.Title "Hello, window"
plt.Show()            // opens a window and blocks until it is closed; resizes re-layout
Notebooks
In a .NET Interactive / Polyglot / Jupyter notebook, figures render inline as SVG:
#r "nuget: DotnetMatplotlib.Interactive"
open Matplotlib
Matplotlib.Interactive.Notebook.register ()   // once per session

let plt = Pyplot()
plt.Plot([| 0.0; 1.0; 2.0 |], [| 0.0; 1.0; 4.0 |], color = "C0") |> ignore
plt   // the cell value renders as an inline SVG plot
Browser (Blazor WebAssembly)
Because the library is pure-managed, it runs in the browser via .NET WebAssembly
— no JavaScript charting library and no native dependencies. The standalone
Blazor WASM demo renders plots as inline SVG client-side:
dotnet run --project samples/BlazorDemo
DataFrames
Plot directly from a Microsoft.Data.Analysis.DataFrame (pandas .plot() style):
dotnet add package DotnetMatplotlib.DataFrame
open Matplotlib.DataFrame   // adds df.PlotLine / PlotScatter / PlotBar / PlotHist

df.PlotLine("x", "y").Savefig "line.png"
df.PlotHist("value", 20).Savefig "hist.svg"
Each method plots the named column(s) and returns the Pyplot, so you can add a
title or choose the output format. The same extension methods work from C#.
AI agents (MCP)
DotnetMatplotlib.Mcp is a Model Context Protocol
server that lets AI agents create plots with this library. Install it as a .NET
tool and point your MCP client at the matplotlib-mcp command:
dotnet tool install -g DotnetMatplotlib.Mcp
{
  "mcpServers": {
    "matplotlib": { "command": "matplotlib-mcp" }
  }
}
It exposes plot_line, scatter, bar and heatmap tools that render to a
PNG / SVG / PDF file (chosen by the output extension) and return the saved path.
Features
- Plots:
plot,scatter(colormappedc, per-points),bar/barh,hist,pie,stackplot,fill_between/fill_betweenx,step,stem,errorbar(withcapsize),vlines/hlines - Axis control:
set_aspect('equal'),axis('off') - Statistics & fields:
hist2d,boxplot,violinplot,quiver,streamplot - Images:
imshow,pcolormeshwith colormaps (viridis,gray,jet,hot) andcolorbar - Contours:
contour(marching squares),contourf - Patches & line/poly collections, hatching, the full marker set
- Legends (including automatic
bestplacement), text & annotations - Subplots with
tight_layout/constrained_layout - Scales: linear / log / symlog / logit; categorical & date axes
- 3D:
plot3D,scatter3D,plot_wireframe - Style sheets and
rcParamsparsing (ggplot,dark_background, …) - Backends: SVG, PNG and PDF (pure-managed), an interactive window (Windows), and animated GIF
- Integrations:
Microsoft.Data.AnalysisDataFrames, .NET Interactive / Jupyter notebooks, an MCP server for AI agents, and Blazor WebAssembly (runs in the browser)
See PORTING.md for the parity log.
Roadmap
A few areas are still being refined toward fuller Matplotlib parity (tracked in
PORTING.md under Known deviations / TODO, and marked with TODO
comments in the source):
ScalarFormatterscientific notation / shared offset — very large or small
tick values currently render in full; the common×10ⁿoffset label is planned.- Real glyph-advance text metrics — text sizing in layout (
tight_layout,
label / legend placement) uses a fixed-width approximation; switching to measured
TrueType advances is in progress. - Non-zero winding raster fill — the software rasterizer fills with the even-odd
rule, whereas Matplotlib/Agg use non-zero winding (affects self-intersecting and
holey fills).
Contributions welcome.
Building
Requires the .NET 10 SDK.
dotnet tool restore           # Fantomas (one-time)
dotnet build                  # whole solution (warnings are errors)
dotnet test                   # all tests
dotnet run --project samples/Gallery -- out   # render the sample gallery to ./out
Code style is enforced with Fantomas; the lint configuration is described in
LINTING.md.
License
dotnet-matplotlib is released under the MIT license — see LICENSE.
Citation
Hunter, J. D. (2007). Matplotlib: A 2D graphics environment. Computing in
Science & Engineering, 9(3), 90–95. https://doi.org/10.1109/MCSE.2007.55
Reviews (0)
Sign in to leave a review.
Leave a reviewNo results found