pawbrowse
Health Pass
- License — License: MIT
- Description — Repository has a description
- Active repo — Last push 0 days ago
- Community trust — 10 GitHub stars
Code Fail
- process.env — Environment variable access in .github/workflows/deploy-extension.yml
- fs module — File system access in .github/workflows/deploy-extension.yml
- fs.rmSync — Destructive file system operation in mcp/broker.mjs
- process.env — Environment variable access in mcp/broker.mjs
- os.homedir — User home directory access in mcp/server.mjs
- process.env — Environment variable access in mcp/server.mjs
Permissions Pass
- Permissions — No dangerous permissions requested
No AI report is available for this listing yet.
Let Claude Code drive your real, logged-in Chrome. MV3 extension + zero-dep MCP server, element-table perception over CDP. The agent is the policy: no second model, no API keys.
 PawBrowse
Let your AI coding agent drive the real Chrome you already use — logged in, no keys, no second AI.






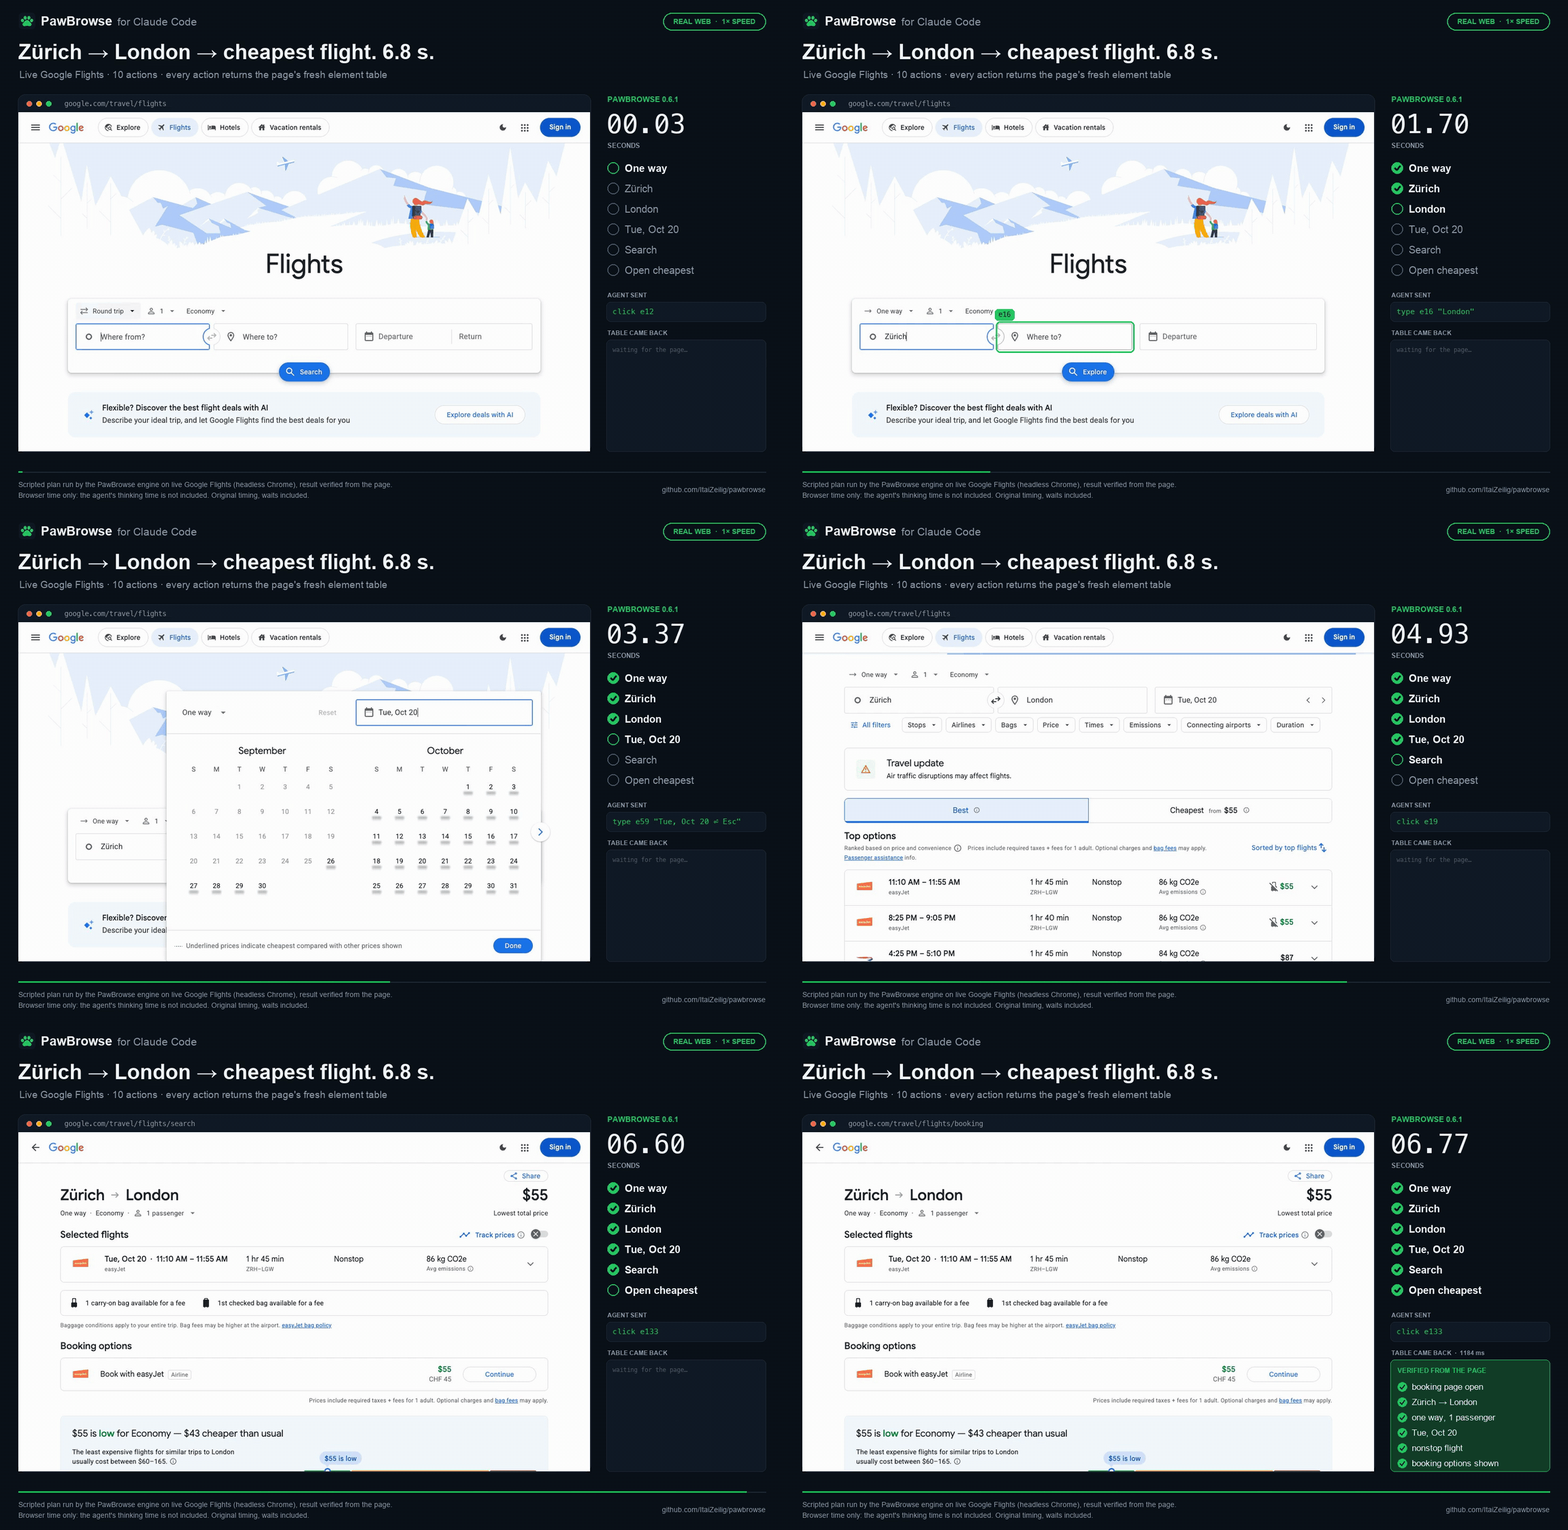
A real run on live Google Flights at 1× speed — every frame is the original screencast, and the result is checked from the page itself. MP4
PawBrowse gives your coding agent hands and eyes in the browser you're already signed into.
It's a small Chrome extension + a one-file MCP server (zero dependencies). Your agent — Claude Code,
Cursor, VS Code, Claude Desktop, anything that speaks MCP — can see and click your actual tabs: your
profile, your logins, your open pages. No remote-debug port, no relaunch, no second AI model, no API
key. The agent you already trust is the only brain in the loop.
The same power as the first-party Claude-in-Chrome extension — but yours, open source, auditable, and
about 2× fewer round-trips because it reads pages as a table instead of screenshotting them.
Try it — about 30 seconds
Two clicks and one line. 👇
1. Add the extension to Chrome

One click on the Chrome Web Store — that's the "hands and eyes" in your browser.
2. Connect your agent



Claude Desktop — click the badge, then double-click the downloaded
pawbrowse.mcpb(or drag it into Settings → Extensions) and hit Install. No command, no config.Cursor / VS Code — click the badge and approve.
Claude Code — paste one line:
claude mcp add --scope user pawbrowse -- npx -y pawbrowse@latest
3. Restart your client and just ask
"use pawbrowse: what's my browser status?"
You should see extension_connected: true, and the extension badge turns green ●. 🎉 You're driving.
Needs Node.js ≥ 18. Nothing to clone or build — the button/line just runs npx -y pawbrowse@latest. Prefer to build from source or contribute? See CONTRIBUTING.md.
What can I ask it?
You never call the tools yourself — you talk to your agent in plain English, and it drives whatever tab you point it at:
- "Open news.ycombinator.com and give me the top 5 story titles."
- "On this tab, search for 'open source license' and open the first result."
- "Fill the signup form with my name and email — but don't submit."
- "Go to my GitHub notifications and tell me what's new."
It works on the tab you already have open and are logged into — no separate window, no re-login. Name a tab and it uses that one; otherwise it uses the active tab.
How it works — it reads pages as a table, not screenshots
Every time it looks, PawBrowse hands your agent a compact, numbered list of the clickable things in view — with real accessible names, current values, and state flags — instead of a screenshot:
Web browser - Wikipedia  —  https://en.wikipedia.org/wiki/Web_browser
scroll 0/6361  ·  83 controls
e2   fill    "Search Wikipedia"
e6   click   "Log in"
e10  click   "2 History"
e13  click ▾ "Toggle Browser market subsection"
e9   click✓  "Remember me"
e3   select  "Country"  opts{US | UK | ...}
Flags after the kind: ✓/· checked/unchecked · ▾/▸ expanded/collapsed · ◉ selected.
Each ref (e10) is a stable handle to a real element, and every action returns the fresh table. So your agent acts in one round-trip — no "screenshot, think, screenshot again." That's the whole speed story (benchmark below), and it's cheaper in tokens too.
Under the hood it's boringly simple: a Chrome MV3 extension drives your tabs through Chrome's built-inchrome.debugger (CDP — no debug port, no relaunch), and a one-file MCP server bridges it to your agent
over localhost. Open as many editors/agents as you like — the first one starts a shared broker, and each
session gets its own 🐾 tab group so nothing fights over the port or a tab.
Claude Code ──stdio (MCP)──▶ mcp/server.mjs ─┐
Cursor      ──stdio (MCP)──▶ mcp/server.mjs ─┼─IPC─▶ broker ──ws://127.0.0.1:10577──▶ Chrome extension ──CDP──▶ your real tabs
VS Code     ──stdio (MCP)──▶ mcp/server.mjs ─┘                                              │
                                                                    each session ⇒ its own 🐾 tab group
Why it's fast
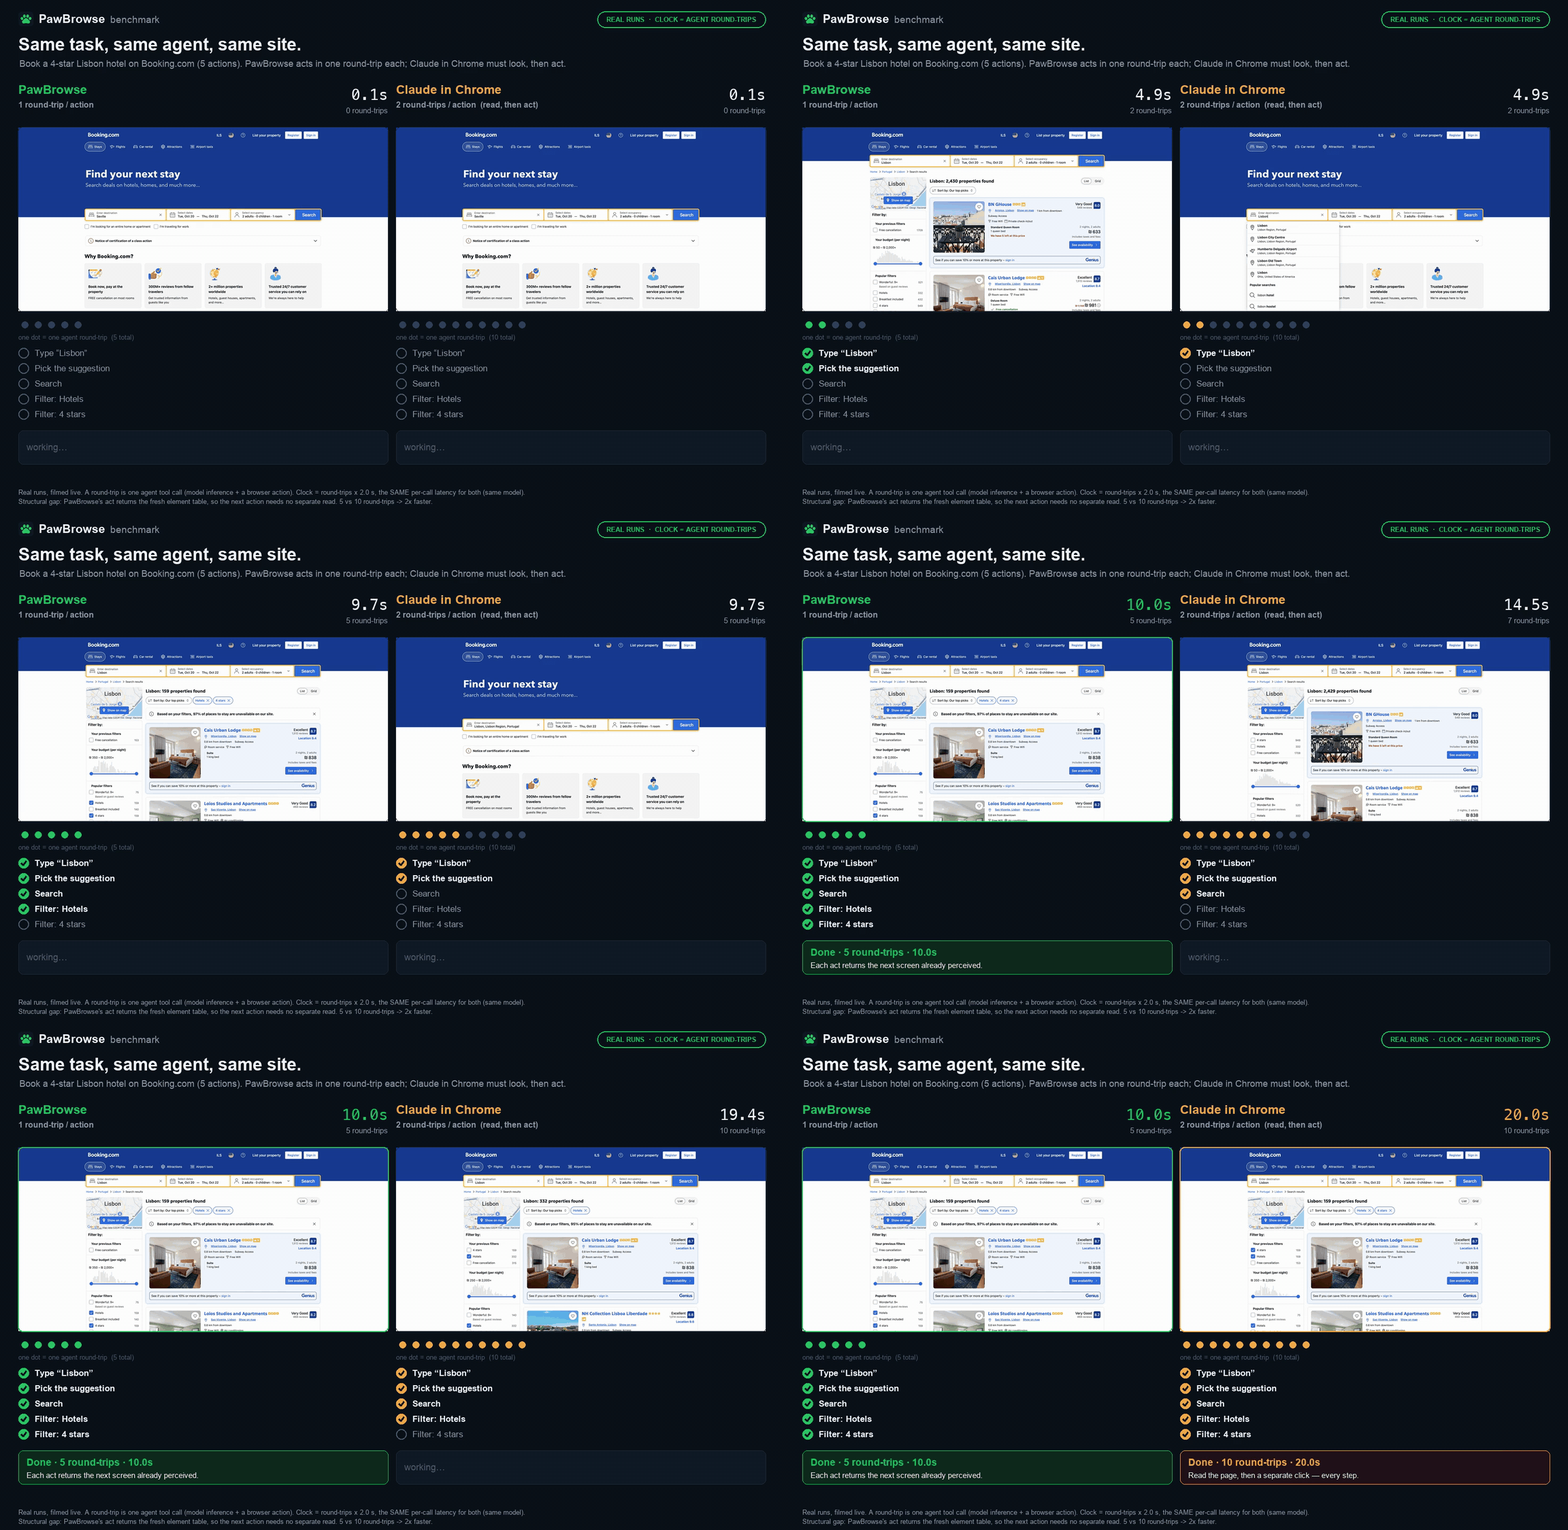
Same task on live Booking.com (book a 4-star Lisbon hotel — 5 actions), same agent (Claude), same real Chrome, both filmed live. The clock counts agent round-trips: one tool call = one round-trip, at the same per-call latency for both. MP4
| PawBrowse | Claude in Chrome | |
|---|---|---|
| Round-trips for the 5 actions | 5 — 1 per action | 10 — 2 per action (read, then act) |
| Screenshots / reads to see the page | 0 — every act returns the fresh table | 5 — one before each action |
| Relative agent time | 1× | ~2× |
Why: the agent loop is round-trip-bound — each tool call is a full model inference. PawBrowse's
actreturns the next screen already perceived, so an action is one round-trip; a perceive-then-act
driver needs two. Same task, same model → same per-call latency, so the round-trip count is the
gap: 5 vs 10 → ~2×.Honest caveats: the clock is round-trips × a fixed, equal per-call latency — it isolates the
structural difference and drops network noise, it's not a stopwatch. One run each; an illustration, not
a statistic. Reproduce:scripts/demo/peek-record.mjsfilms each tab,scripts/demo/render_race.py
renders it.
How it compares
| Claude-in-Chrome | PawBrowse | |
|---|---|---|
| Drives your real, logged-in Chrome | ✅ | ✅ (chrome.debugger, no port) |
| Decision model | Claude | Claude — no second model, no key |
| Perception | screenshots + a11y tree | compact element table |
| Round-trips per action | 2 (perceive → act) | 1 (stable refs) |
| Page data to a third party | no | no |
| Per-site permission gate | yes (allowlist) | no |
| Open source / self-owned | ❌ | ✅ MIT, zero-dep |
| Works with any MCP client | ❌ | ✅ |
The tools
You won't call these directly — your agent does — but here's the whole surface:
| Tool | What it does |
|---|---|
browser_status |
Connection + attached-tab diagnostics. Call first if anything's off. |
browser_tabs |
List open tabs (id, title, url, active). |
browser_navigate |
{ url, tabId? } → element table after load. |
browser_observe |
{ tabId? } → the element table. |
browser_read |
{ tabId?, max_chars? } → the page's readable prose (articles, docs, rules). |
browser_act |
{ ops: [...], tabId? } → runs ops in order, returns a fresh table + a "page changed?" signal. |
browser_assert |
{ contains? | url_includes? | ref_visible?, tabId? } → prove an outcome (pass/fail). |
Ops for browser_act: {op:"click",ref:"e12"} · {op:"click_text",text:"..."} (custom
widgets/menus not in the table) · {op:"click_xy",x,y} (canvas / custom-drawn UI) ·{op:"type",ref:"e7",text:"..."} · {op:"select",ref:"e8",value:"..."} · {op:"hover",ref:"e5"} ·{op:"drag",ref:"e5",to:"e9"} · {op:"upload",ref:"e3",paths:["/abs/file.pdf"]} ·{op:"key",key:"Enter"} · {op:"scroll",dy:600} · {op:"wait",ms:500}.
Built to be trustworthy
Two questions everyone has: does it break? and where does my data go?
It's hardened. Two multi-agent code audits plus live testing on real sites went into these:
- Hit-tested clicks — it re-resolves each element live and checks the center isn't covered before clicking, so it never hits a stale, moved, or occluded target.
- Semantic freshness guard — an element's role + name is fingerprinted, and a silently relabeled target is rejected ("observe again") instead of mis-clicked.
- Robust typing — select-all +
insertText(works with React/controlled inputs); typed comboboxes wait for autocomplete to render. - Background-tab safe — uses
setTimeout-based waits (notrequestAnimationFrame, which Chrome pauses in background tabs), so driving a tab you aren't looking at doesn't hang. - No double-execution & an unwedgeable queue — overlapping calls can't race the debugger, and one hung command can't block the rest.
It stays on your machine. No model, no API key, no telemetry.
- Page content it reads goes only to the local agent you run — never to any third-party server.
password,file, andhiddeninputs are excluded and never exposed (other visible fields are in the table, so treat what's on screen as visible to your agent). - The bridge binds to
127.0.0.1, rejects non-chrome-extension://origins, and trusts only the current extension socket. It assumes other software on your machine is trusted — the same as most localhost dev tools; a per-pair token is planned hardening. - The extension declares
debugger(plustabs,storage,alarms) and no host permissions. The only thing stored is your bridge port number. - Fully auditable: the server is one zero-dependency file, the extension is plain JS.
Full details: SECURITY.md · PRIVACY.md. Found a vulnerability? Please don't open a public issue — see SECURITY.md.
Honest limits
- Attaching shows Chrome's "PawBrowse is debugging this browser" banner — expected.
- One debugger client per tab: a tab with DevTools open (or driven by another extension) can't be attached — switch tabs or close DevTools.
chrome://, the Chrome Web Store, and other browser pages can't be driven (Chrome blocks automation there).- Multiple clients run at once — a shared broker owns the port and gives each session (Claude Code, Cursor, Claude Desktop…) its own 🐾 tab group, so several agents can drive the browser simultaneously. The only catch is the per-tab rule above: two sessions can't drive the same tab.
- Reads open shadow DOM + same-origin iframes — their controls are in the table and clickable. It can also act inside cross-origin iframes (via a child debugger session) and do file uploads (
uploadop, once you enable Allow access to file URLs for the extension). What it can't read is cross-origin iframe text (payment fields stay opaque) and canvas — use the screenshot +click_xythere.
Troubleshooting
| Symptom | Fix |
|---|---|
| Badge never turns green | The server isn't running — make sure you fully restarted your client after claude mcp add (a /mcp reconnect alone won't relaunch it). |
| "No extension connected" | Reload the extension at chrome://extensions, then re-run browser_status. |
| "Another debugger is already attached" | That tab has DevTools open or another extension driving it — close DevTools or switch tabs. |
A chrome:// / Web Store page won't drive |
Those are browser pages Chrome blocks from automation — use a normal web page. |
| Changed the port | Set the same port in the extension's Options and in --env PAWBROWSE_PORT=…. |
Requires Node ≥ 18 (≥ 22 to run the test suite). Works on Chrome, Edge, and Brave.
Contributing
PRs welcome! See CONTRIBUTING.md for dev setup and tests (npm test), and the
Code of Conduct. Questions? SUPPORT.md.
Credits
Built with Claude Code. Some page-perception and action-execution
techniques are adapted from browser-use/jev-ultrafast
(MIT); this credit is kept as required by that project's license.
License
MIT © PawBrowse contributors.
Reviews (0)
Sign in to leave a review.
Leave a reviewNo results found