Tracely-ai
Health Pass
- License — License: MIT
- Description — Repository has a description
- Active repo — Last push 0 days ago
- Community trust — 965 GitHub stars
Code Pass
- Code scan — Scanned 12 files during light audit, no dangerous patterns found
Permissions Pass
- Permissions — No dangerous permissions requested
No AI report is available for this listing yet.
Trace-native CI/CD for AI agents — production failures become regression tests that block the PR. Auto-detect, cluster, freeze into hermetic cases, replay in CI for $0.

Tracely
Production failures become regression tests.
Trace-native CI/CD for AI agents. Tracely grades every agent trace as it lands, clusters the
failures into issues, freezes the bad runs into hermetic replayable cases, blocks the pull request
that would ship them again — and tells you the moment any of it happens.
production trace → failure detection → regression test → CI gate → alert
Website · Docs · Product guide · Agent skill · Guided tour · 2-min demo · Design dossier





Self-host the whole stack in one click — API, worker, UI, Postgres, ClickHouse, Redis and MinIO:

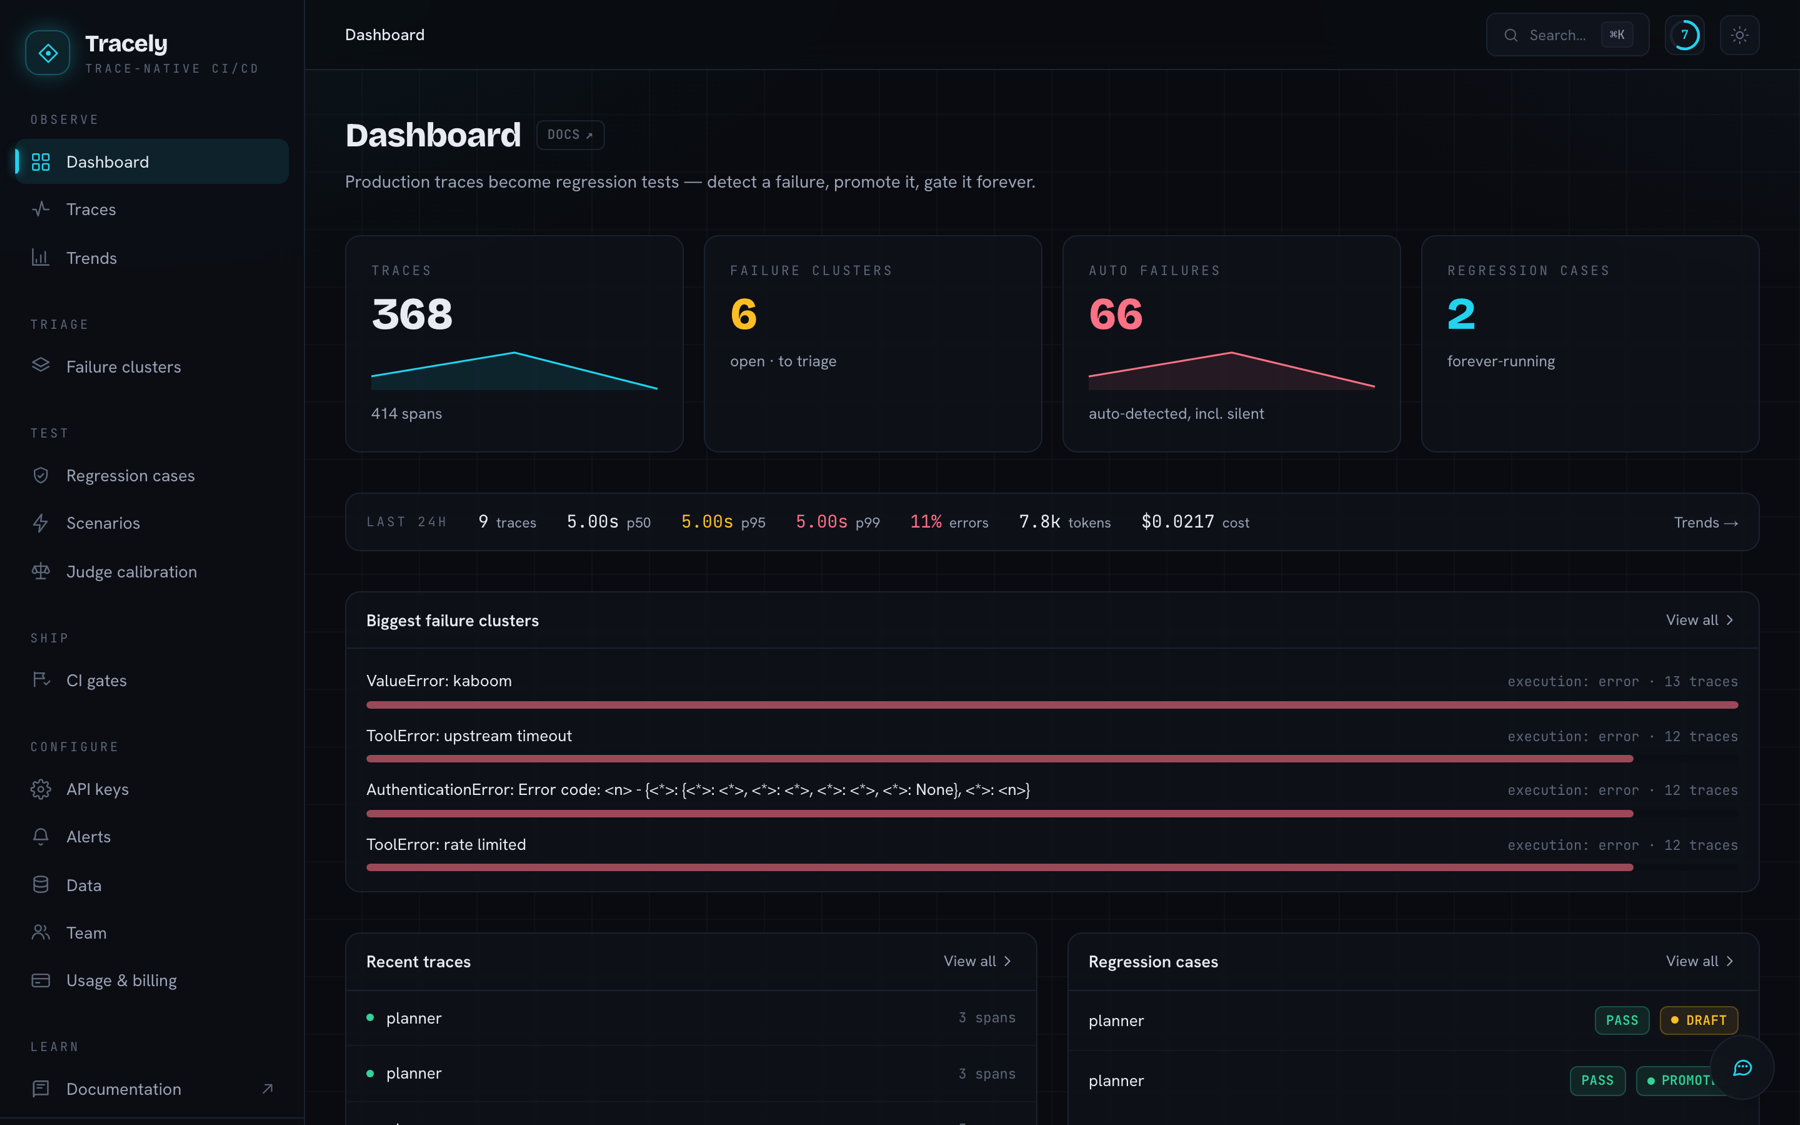
One workspace: what ran, what broke, what is already pinned as a test.
Why another agent-observability tool?
Because observability stops at the dashboard. You can see that your agent broke — then what?
Every eval tool asks you to hand-author a dataset: sit down, invent questions, write ideal
answers, keep them current as the product changes. That dataset is a guess about what might break.
Production already handed you the real thing: a trace of the exact run that failed, with the exact
input, the exact tool calls, the exact model responses.
The recorded run is the test. Tracely freezes that trace into a hermetic regression case and
replays it on every PR. Everything else — quality scores, failure clusters, suggested fixes, CI
verdicts, trends, alerts — is derived from the trace. There are no hand-authored datasets.
| Dataset-first tools | Tracely | |
|---|---|---|
| Where tests come from | You write them | Promoted from real failing traces |
| Fidelity to production | A guess | The exact failing run, byte for byte |
| Cost to replay in CI | Live model calls | $0 — recorded tool/LLM fixtures |
| What happens on regression | A dashboard number moves | The PR is blocked |
| How you find out | You go and look | It comes to you — Slack, email, your own webhook |
The loop
Five steps, five pages in the app.
1 · Observe — every run, hierarchically
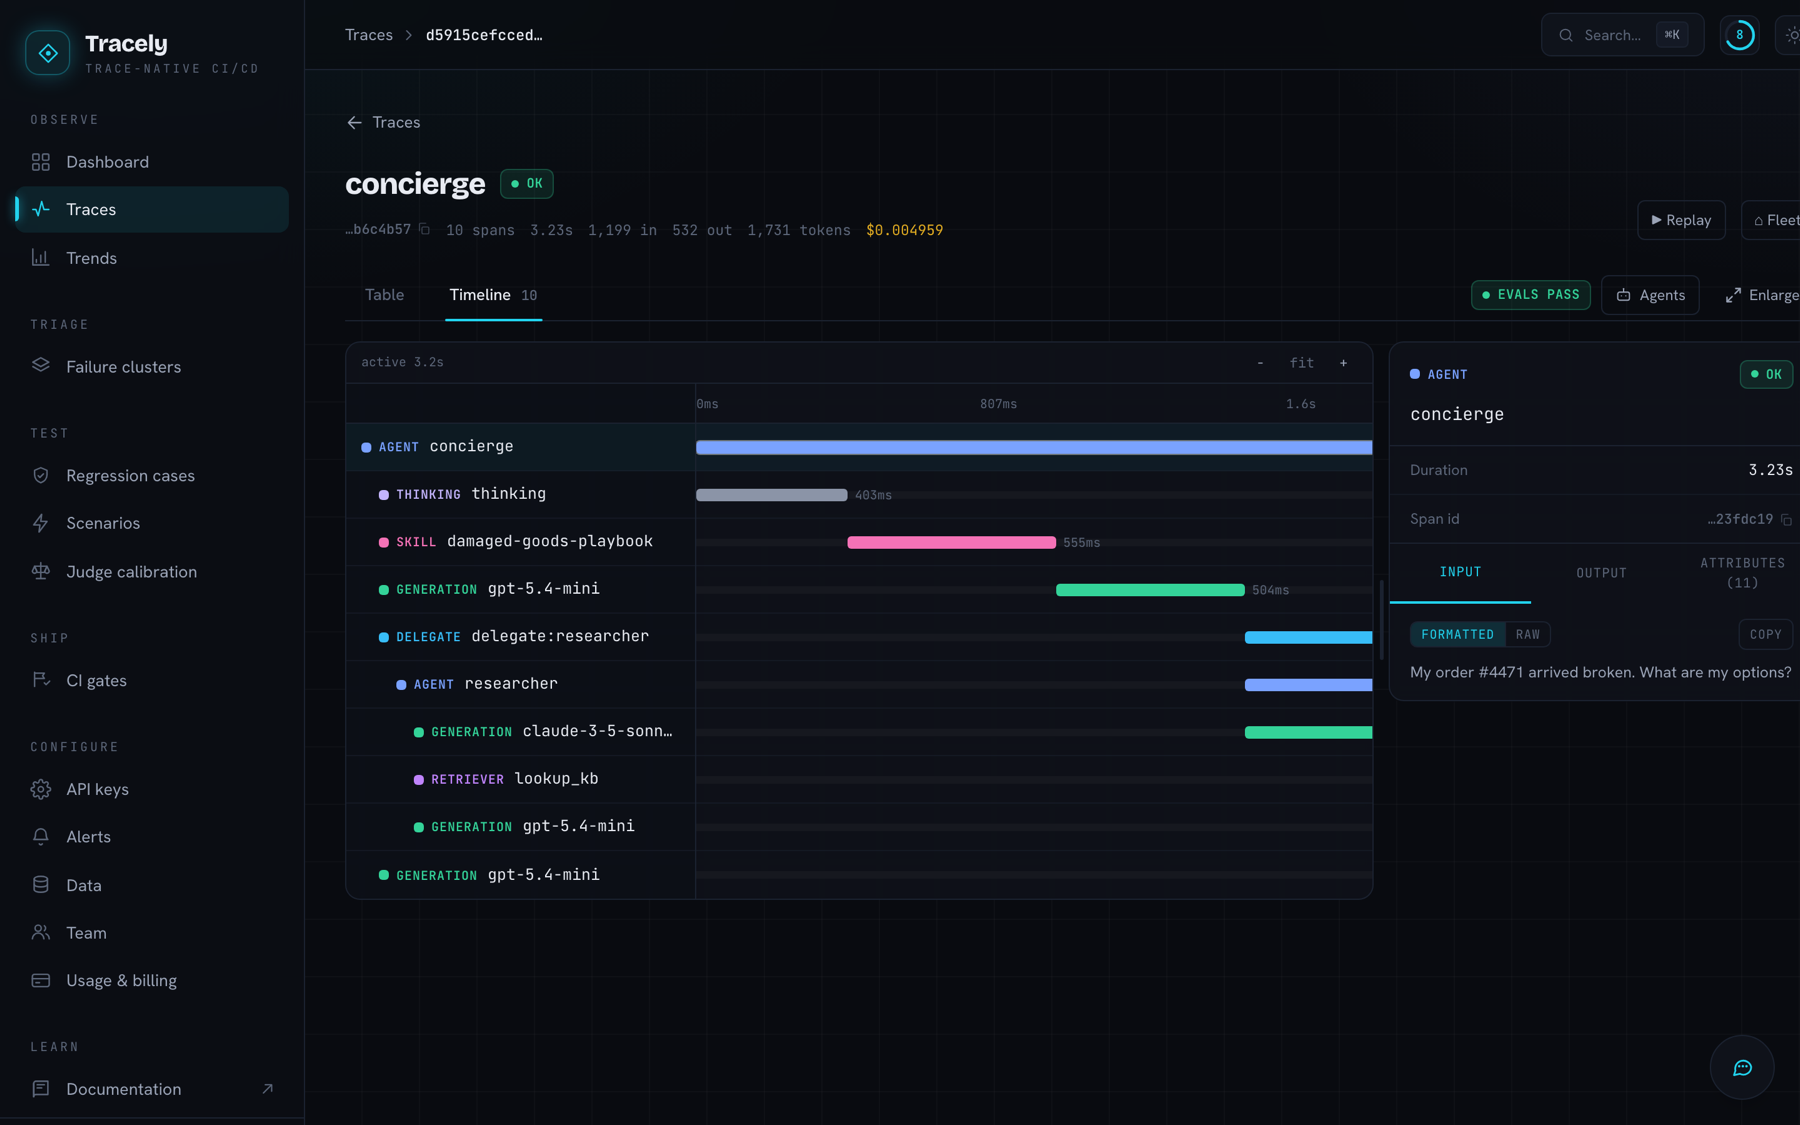
Traces arrive over plain OTLP. Agent semantics (agent.id, conversation.id, turn, step) are
promoted to first-class indexed columns, so runs group into conversation threads instead of a flat
span soup. The waterfall shows agent → thinking → skill → generation → hand-off, with the failing
span in red and its I/O beside it.
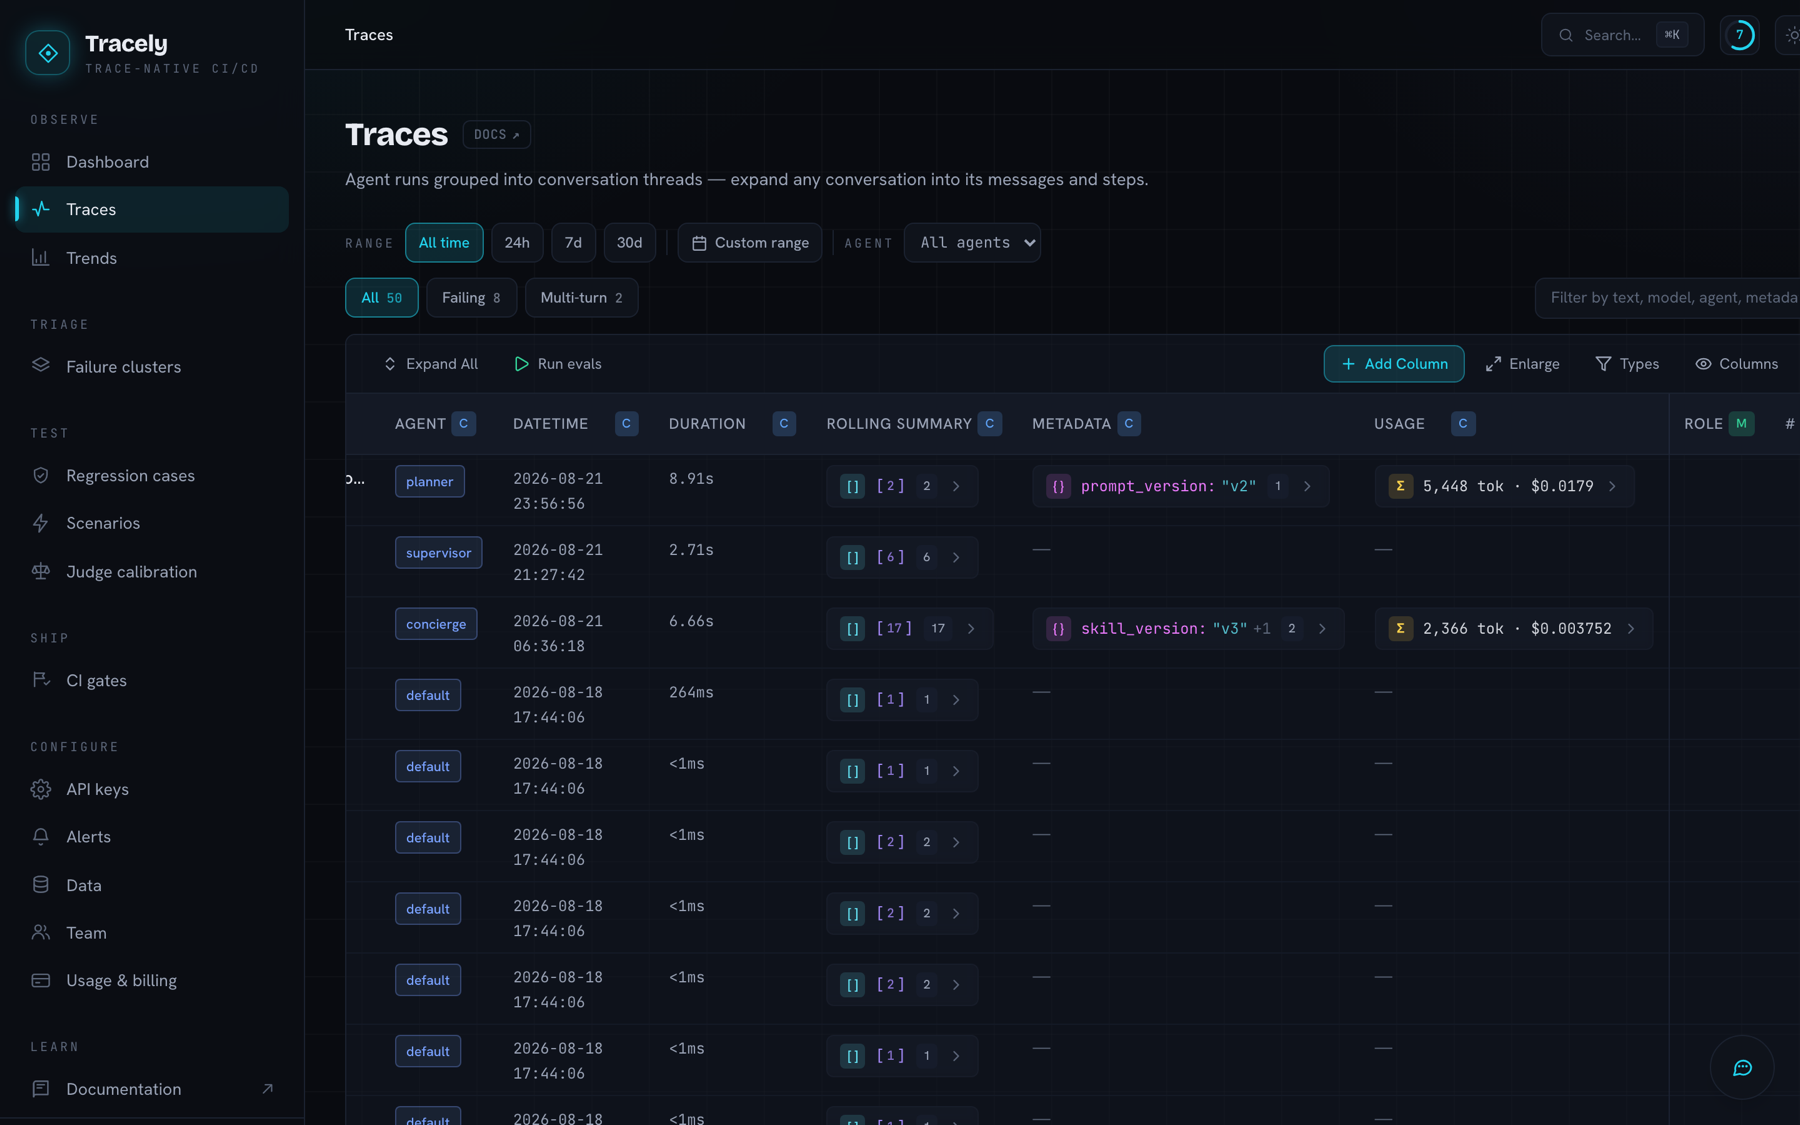
Evaluators are columns on the trace table, not a separate tab — each one grades at conversation,
run or span level and writes its verdict into the grid. Scores stream in live over SSE as judges
finish, so you watch a run get graded in place. Tokens, cost, latency, metadata and the rolling
per-turn summary are columns too.
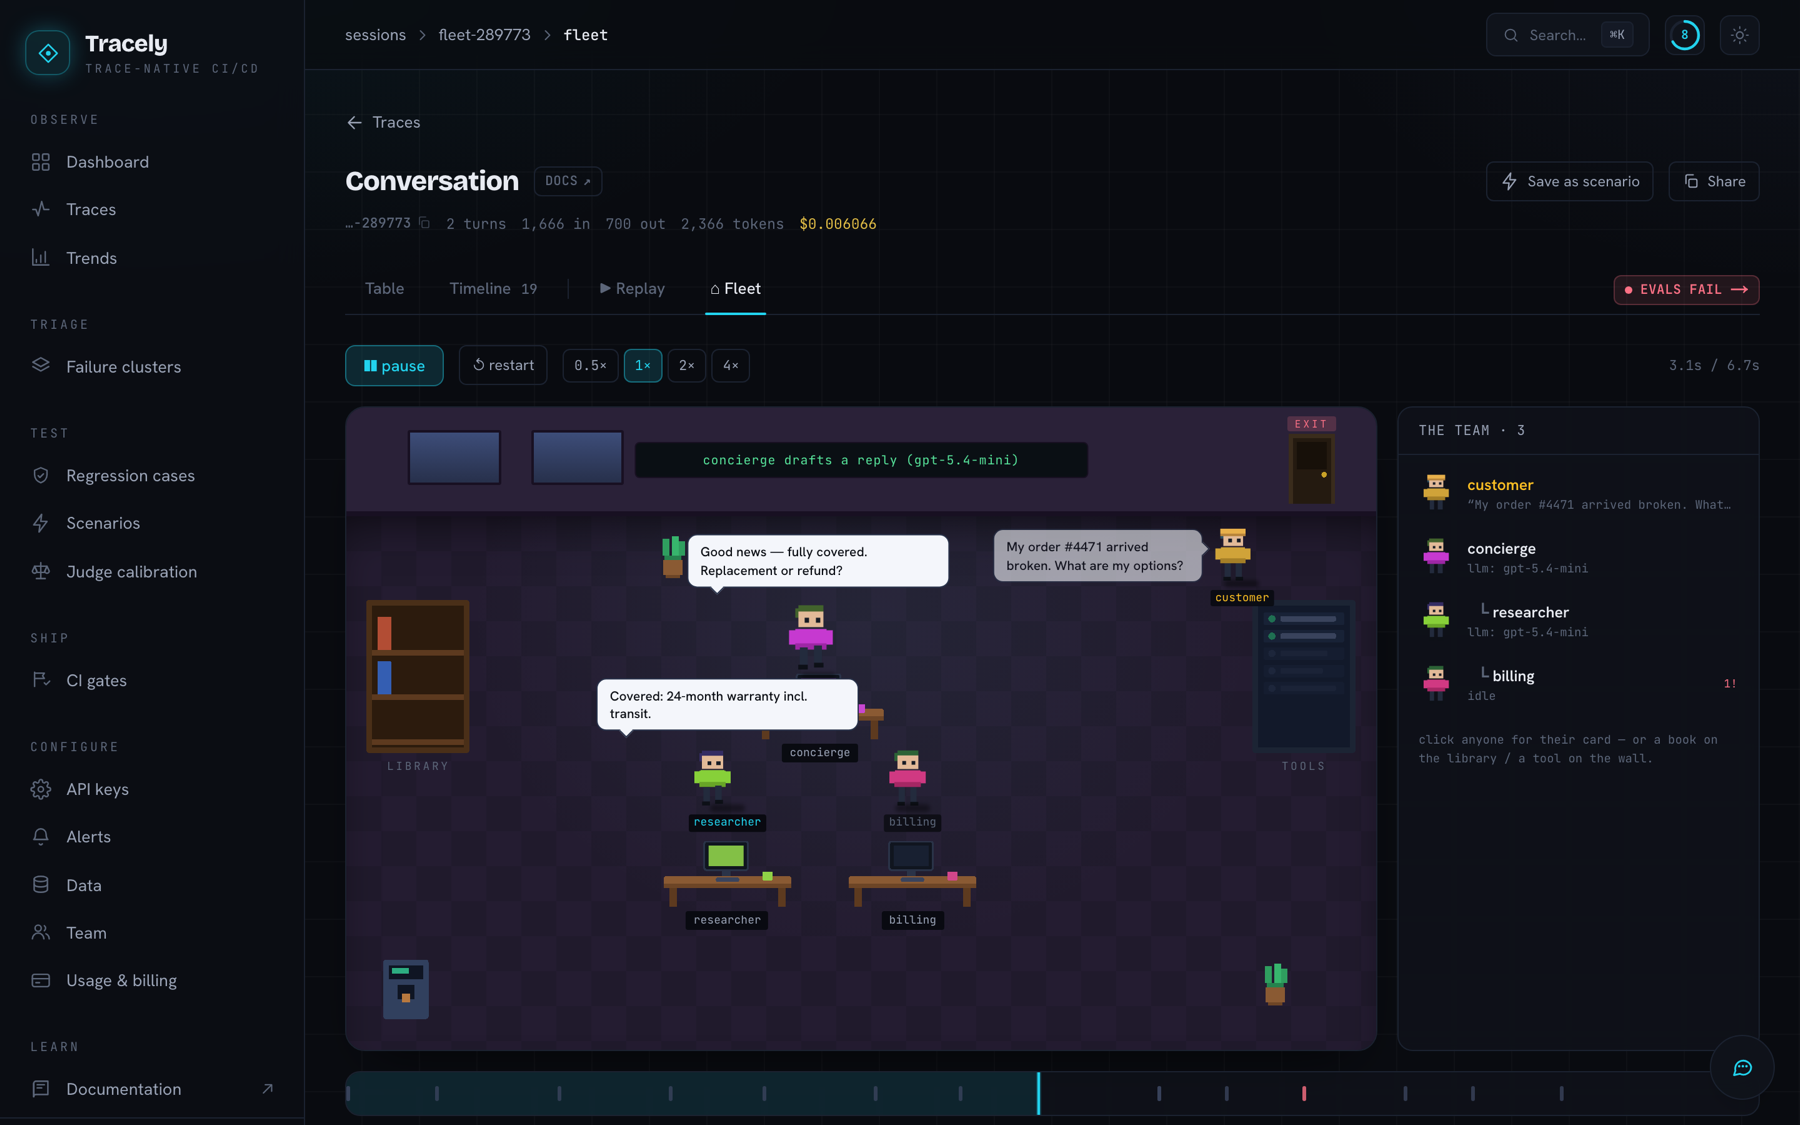
 Two extra ways to read one conversation — a step-by-step replay, and a pixel-art office
Replay walks the conversation event by event on a timeline. Fleet renders the same
conversation as a room: each agent is a character, hand-offs are walks across the floor, tools are
objects on the wall — which turns out to be the fastest way to explain a multi-agent system to
someone who doesn't read waterfalls.
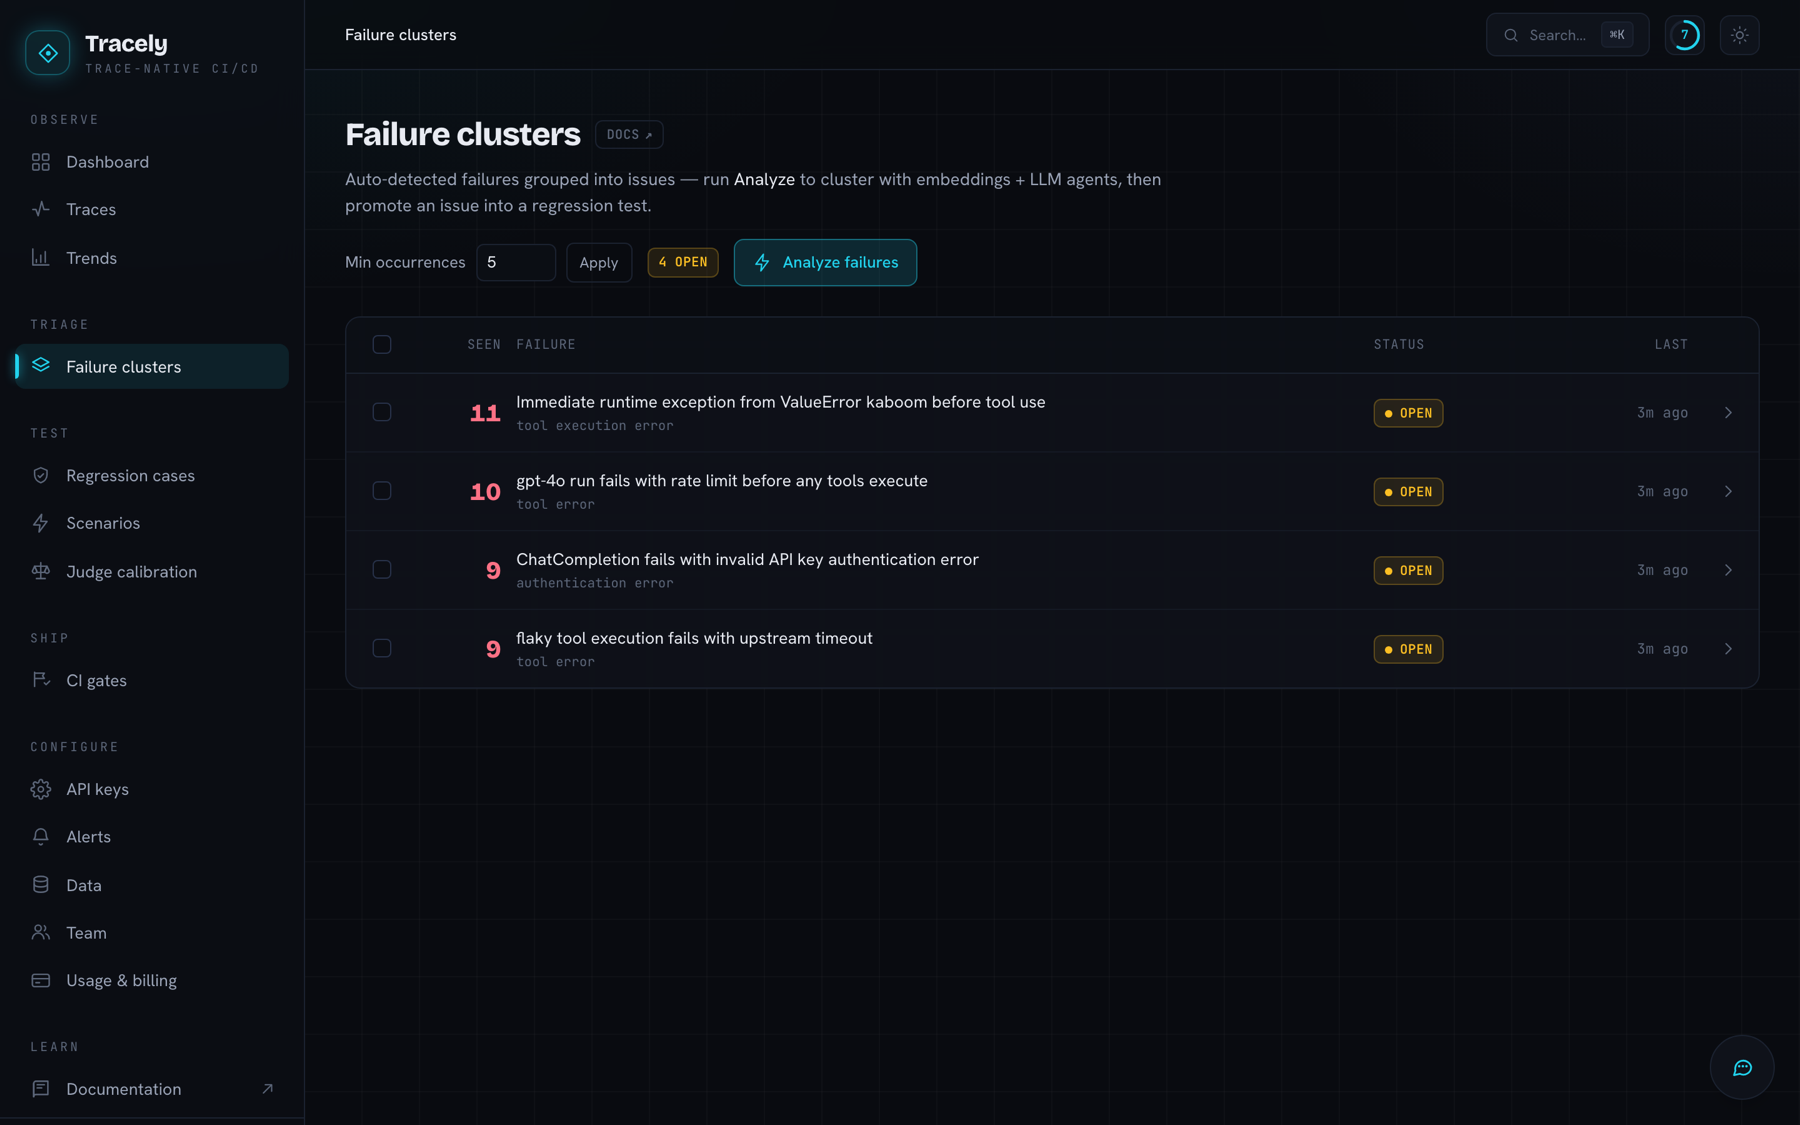
2 · Detect & triage — failures group into issues
Online evaluators grade every run as it lands (LLM-as-judge at conversation / run / span level, plus
structural checks that need no model at all). Failures then cluster — structurally and semantically —
so 31 broken runs become one issue with a count, not 31 rows to read. Each cluster can suggest
the evaluator that would have caught it.
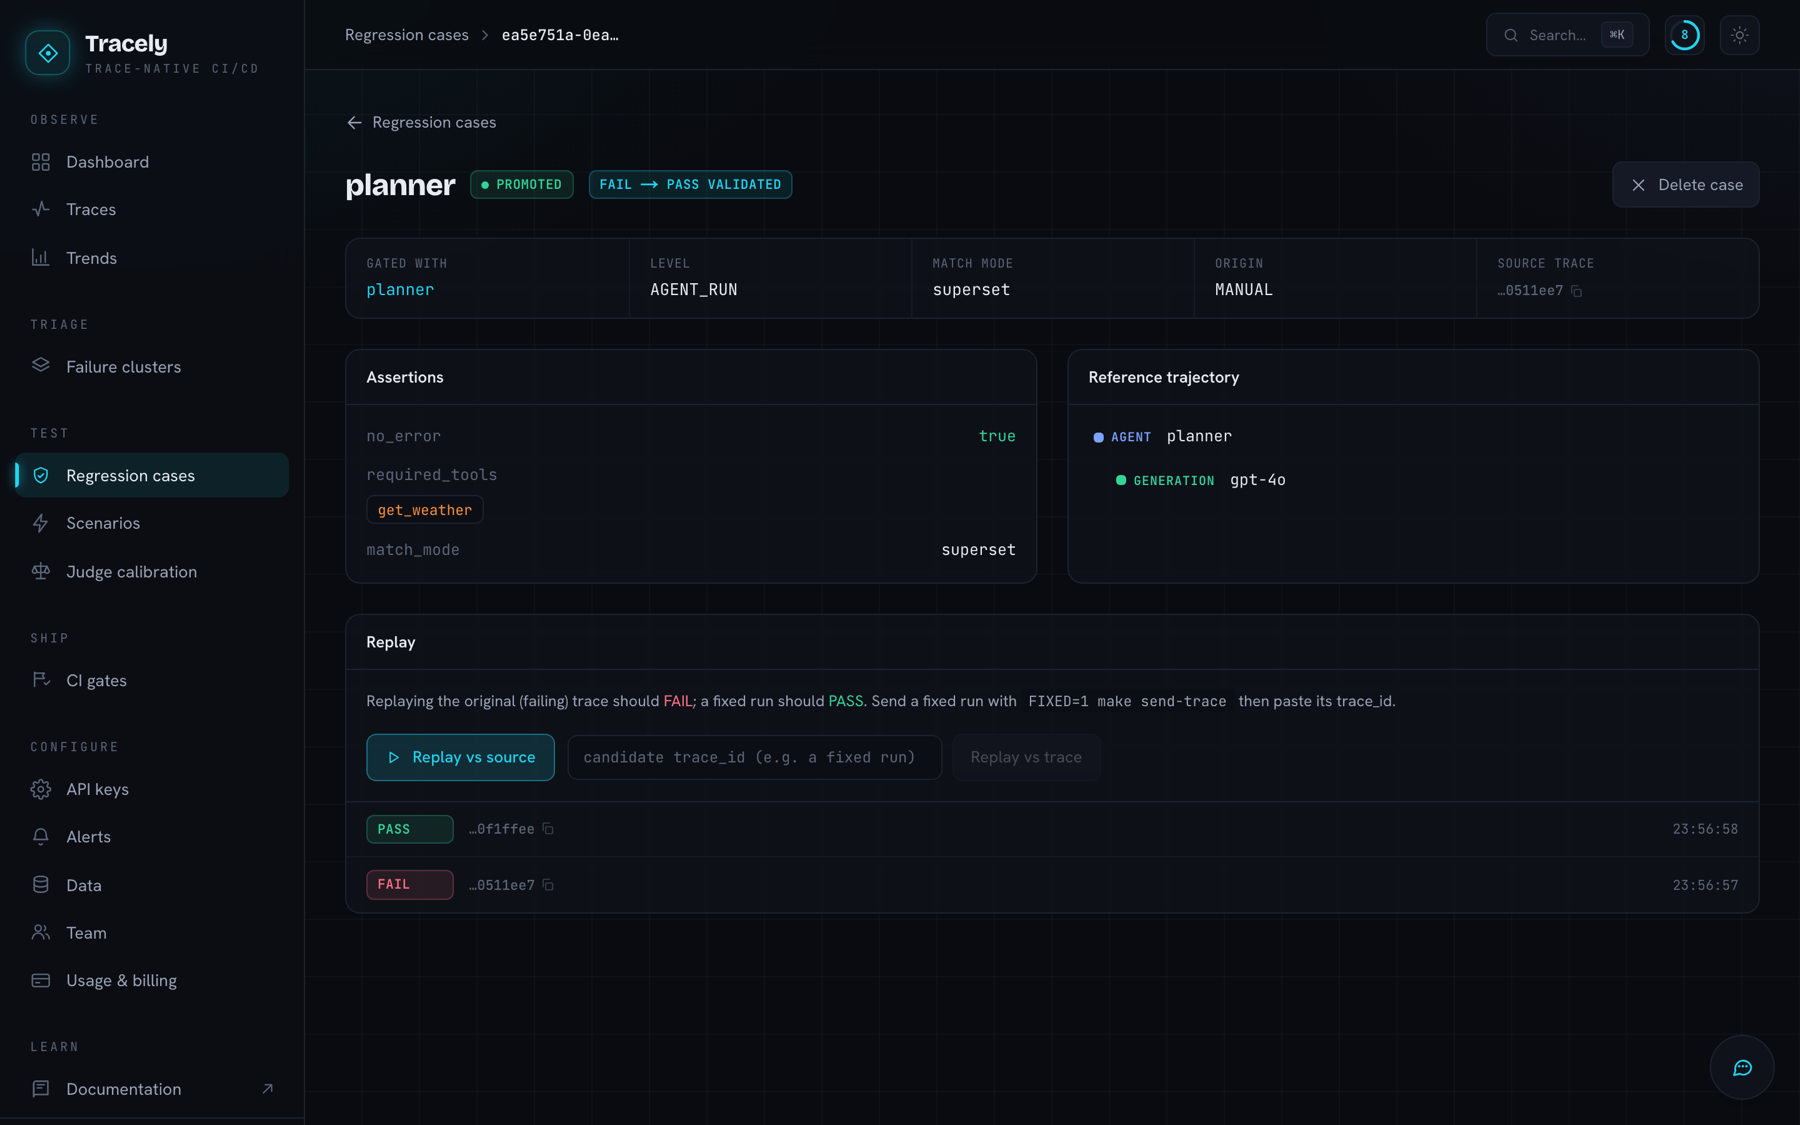
3 · Test — freeze the failure
One click promotes a failing trace into a hermetic case: recorded input, tool and LLM outputs bundled
as fixtures, and a fail-to-pass contract attached — the case must fail on the old code and pass on
the fix, or the promotion isn't trusted. Multi-turn behaviour gets scenarios instead: a scripted
conversation, or an adversarial goal a red-team model improvises against.
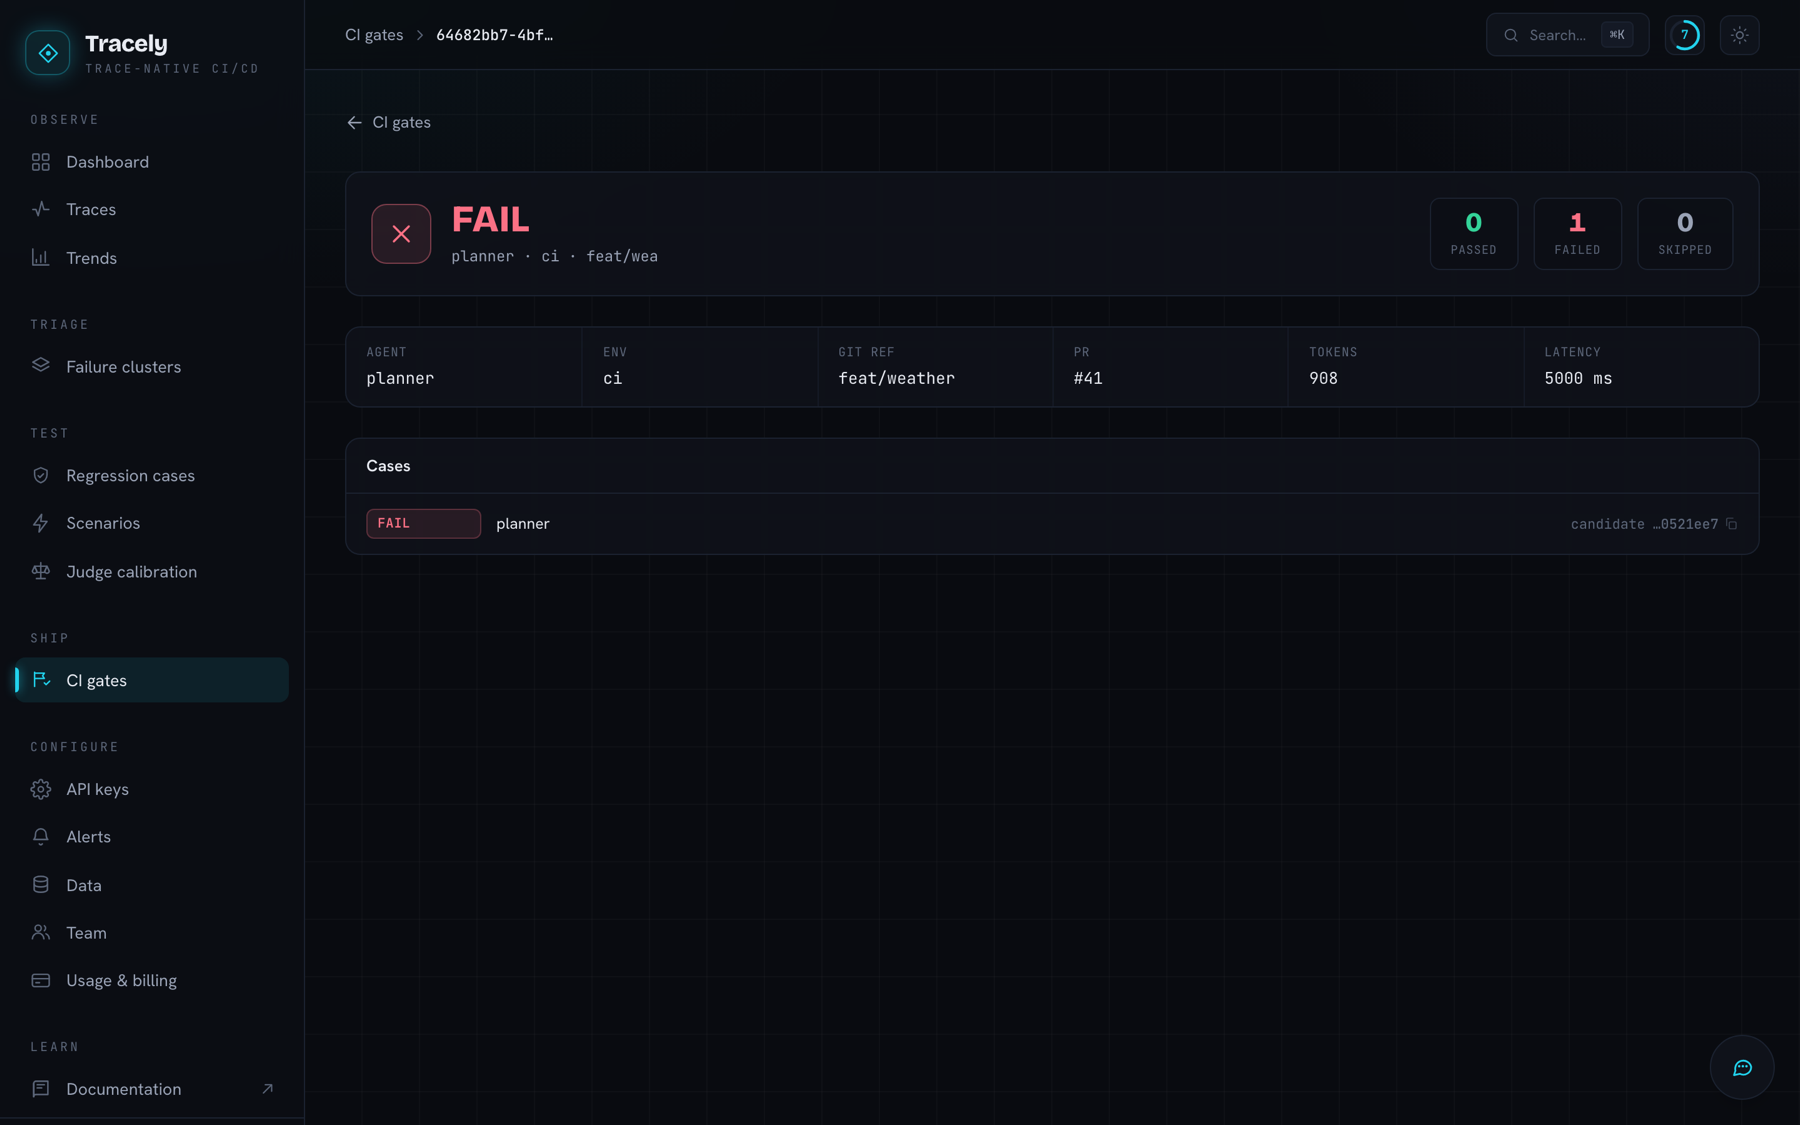
4 · Ship — block the PR
The suite replays in CI against recorded fixtures: deterministic, offline, no API keys and no model
spend. tracely gate exits non-zero, posts a commit status, and upserts a PR comment.
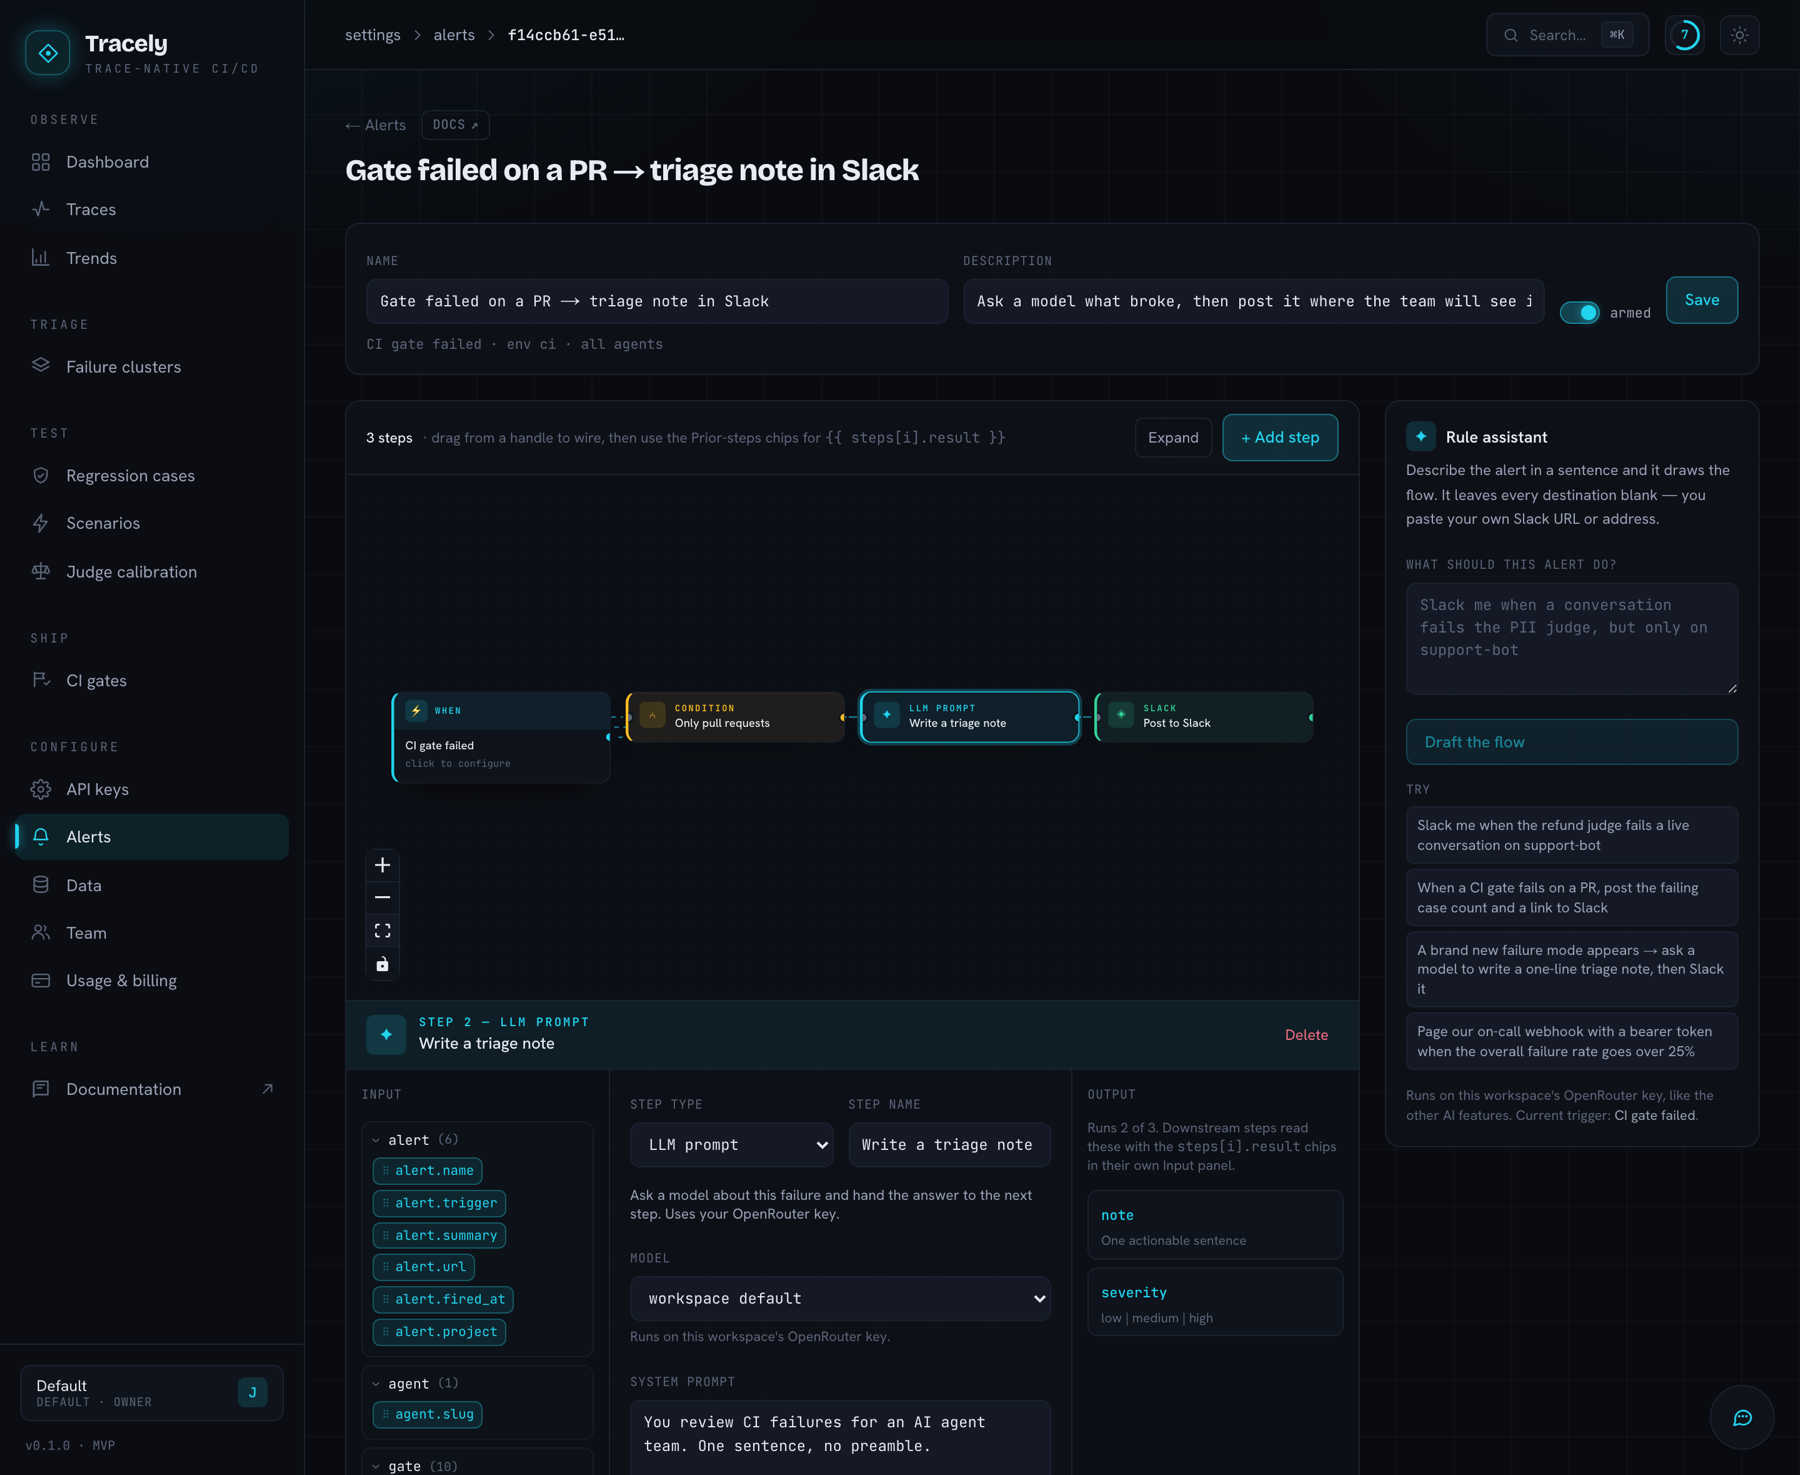
5 · Tell me — alerts as a flow
A rule has two halves: when (a gate fails, a live conversation breaks on a judge, a failure mode
appears that nobody has seen before, or a rate crosses a line) and what happens — drawn on a
canvas. Conditions that gate the rest of the flow, Slack, email, a webhook with your own method and
headers, an LLM step whose answer the next step can use, and a Python expression for a number a
template can't compute. Every field is a template over the failure's own variables, dragged in as
chips. Describe it in a sentence and the rule assistant draws the whole thing.
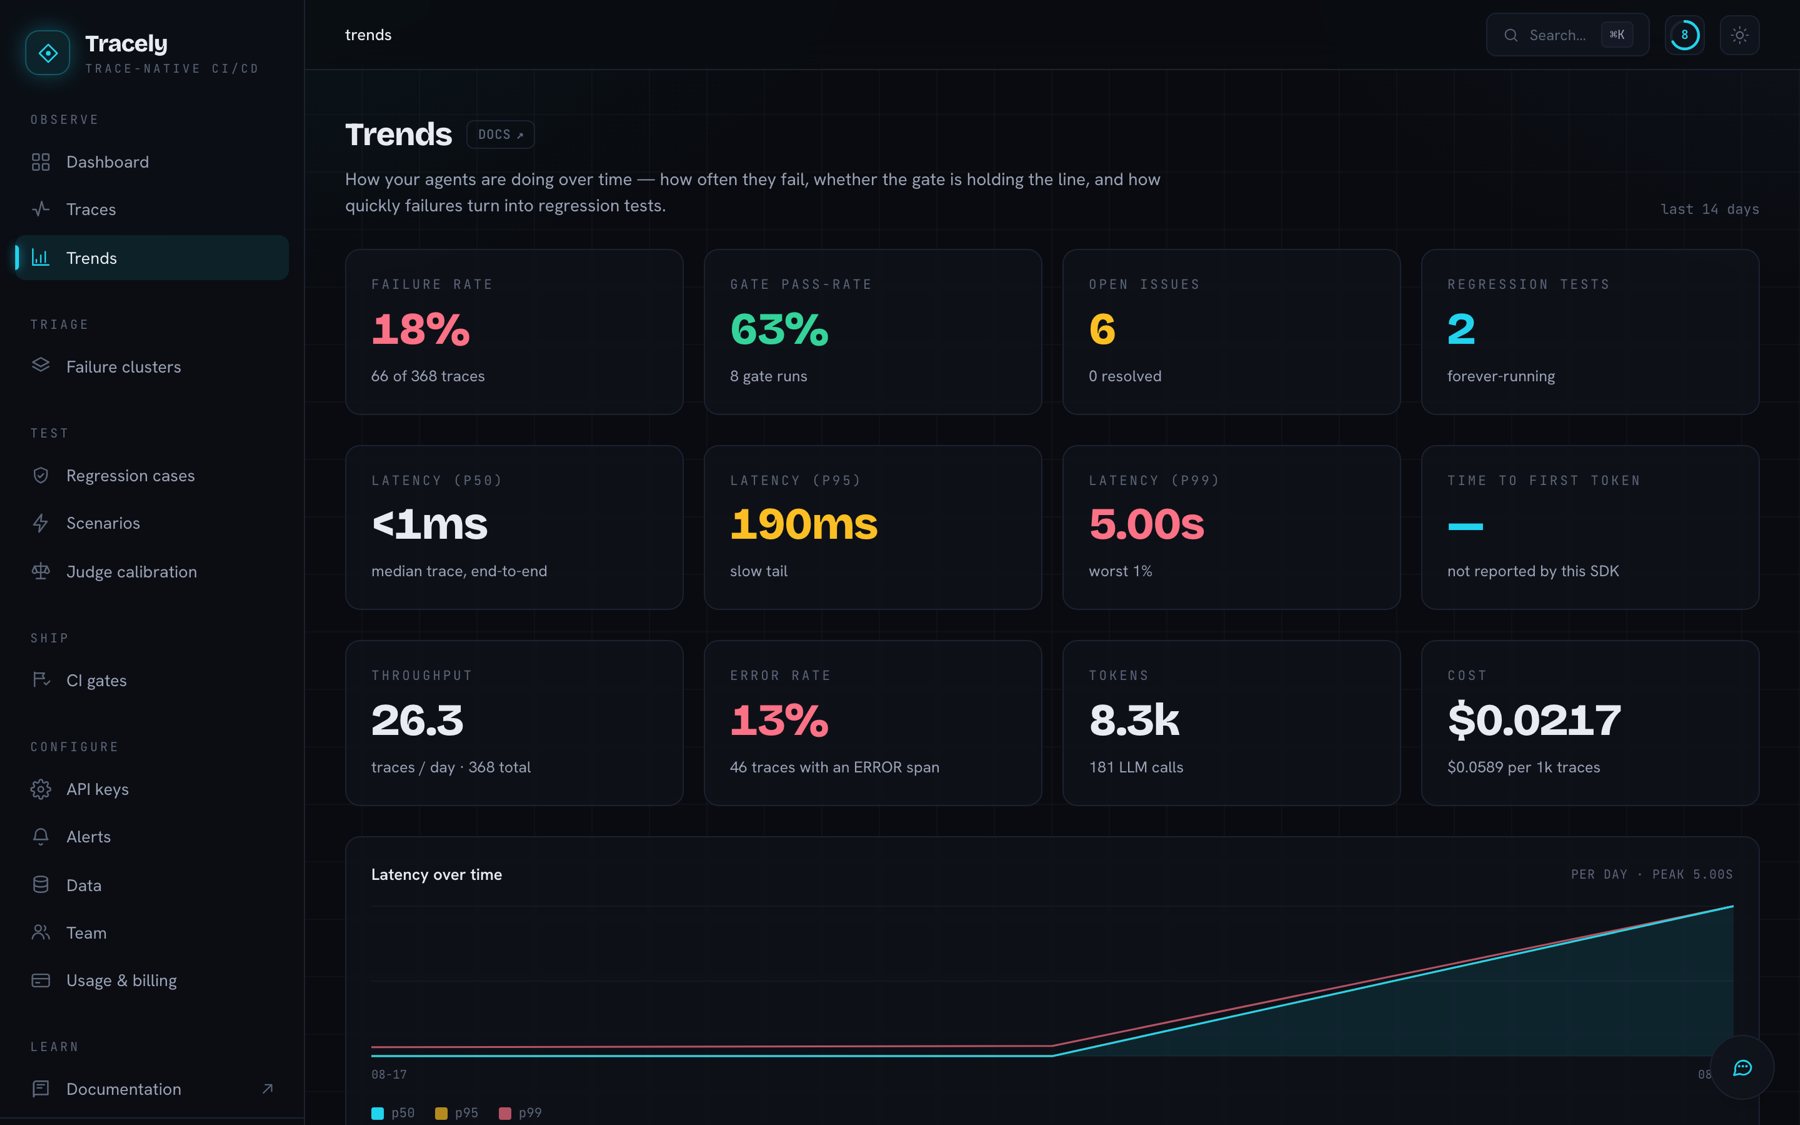
Plus — trends, cross-metric analysis, judge calibration
Daily failure and gate pass-rates, latency percentiles, token spend, per-agent meta-analysis
(Spearman correlations + z-score outliers, LLM-synthesized) — and a calibration screen where you
label judge verdicts against human review and see each judge's agreement, so you catch an
over-flagging judge before you let it gate a release.
Everything in the box
| What it does | Where | |
|---|---|---|
| Ingest | OTLP/HTTP from any language; blob-first durability (S3 before the queue); agent semantics as indexed columns; three message conventions normalized | backend/ |
| Evaluators | Columns on the trace table. Structural checks (no model) + LLM judges at conversation / run / span level, multi-output (score, boolean, number, text, JSON schema), basic or @VARIABLE advanced prompts with live preview, batch or sequential, per-agent/env targeting, deterministic sampling, advisory verdicts |
Docs |
| Failure clusters | Structural signature + semantic embedding clustering, taxonomy, suggested evaluators, promote-to-case | Docs |
| Regression cases | Hermetic fixture bundles, fail-to-pass contracts, assertions, reference trajectory, replay history | Docs |
| Scenarios | Multi-turn conversations Tracely drives at your agent's own endpoint, or an adversarial goal a red-team model pursues (goal achieved = FAIL) | Docs |
| CI gates | tracely simulate / replay / gate + a GitHub Action: commit status, PR comment, non-zero exit |
Docs |
| Alerts | Trigger + visual flow: conditions, Slack, email, webhooks with headers, an LLM step, Python expressions. Event triggers fire inline; thresholds poll a window. Test runs show what each step actually sent | Docs |
| Trends & analysis | Daily traces/failures/gate pass-rate, latency + cost, per-agent cross-metric meta-analysis | Docs |
| Judge calibration | Label judge verdicts against human review; per-evaluator agreement, missed failures vs over-flagging | Docs |
| Conversation intelligence | Rolling per-turn summary (backs the judge's @HISTORY), declared agent catalog, state deltas, Replay + Fleet views, shareable read-only links |
Docs |
| In-app assistant | ⌘J — an agent over your workspace: reads traces, creates evaluators, scenarios, cases and alerts, as you. ⌘K jumps anywhere | Docs |
| MCP server | The API doubles as an MCP endpoint (/mcp) so a coding agent drives the workspace with an ordinary ingest key |
Docs |
| Auth & teams | dev (open) · local (email/password + invites) · clerk. Organizations, workspaces, seats, API keys, per-workspace OpenRouter key |
Docs |
| Ops | Beat self-check (queue depth, worker liveness, ingest freshness) + /health/queue, optional Sentry, optional trace quota + Stripe billing |
guides/DEPLOY.md |
Near-term plan: design/part2-tracely/11-prd-next-steps.md ·
Long-term roadmap: 10-mvp-and-roadmap.md
Quickstart
Prerequisites: Docker + Docker Compose. (For local dev also uv and Node 20+ / pnpm.)
Everything in Docker — the whole product, populated
git clone https://github.com/Jwuthri/Tracely && cd Tracely
docker compose --profile demo up -d --build --wait
open http://localhost:3001
That brings up ClickHouse, Postgres, Redis and MinIO, runs every migration, seeds the default project
and ingest key (tracely_dev_key), then populates traces, clusters, cases and gates — so the app
opens with the screenshots above rather than an empty shell.
docker compose down # stop (add -v to wipe data)
Host ports default to web :3001 and backend :8000; remap with TRACELY_WEB_PORT / TRACELY_BACKEND_PORT.backend/worker/frontend run off source volume-mounts, so most edits need only docker compose restart <svc> —
except the Celery worker, which doesn't hot-reload.
Local dev (hot reload)
cp .env.example .env
make infra-up      # clickhouse, postgres, redis, minio
make install       # uv sync + pnpm install
make migrate       # ClickHouse DDL + Alembic (Postgres)
make seed          # default project + ingest key → tracely_dev_key

make backend       # FastAPI  :8000  (OpenAPI at /docs)   ┐
make workers       # Celery ingestion/eval worker          ├ three terminals
make frontend      # Next.js  :3001                        ┘

make demo          # populate the WHOLE product: traces + clusters + cases + gates
make test          # backend unit tests (no infra, ~6s)
Deploy your own
One click provisions the whole stack on Railway — API, worker, UI, Postgres
(pgvector), ClickHouse, Redis and MinIO, wired together with volumes and private networking.
Migrations and seeding run on the first deploy; set SESSION_SECRET and SECRETS_ENCRYPTION_KEY
(openssl rand -hex 32 each) when prompted, then open the frontend's domain and create your
workspace.
Prefer to wire it yourself, or deploying somewhere else? The manual walkthrough isdeploy/railway/README.md (every variable pre-written in.env.railway.example), and the production-hardening runbook
— auth guards, backups, worker pool, post-deploy verification — isguides/DEPLOY.md.
Send your first trace
pip install "tracely-ai[openai]" # or [anthropic], [langchain], [all]
Initialize once at startup, then wrap a run — your normal provider calls are captured automatically,
with no span code:
import tracely_sdk as tracely

tracely.init(
    endpoint="http://localhost:8000",   # your Tracely API
    api_key="tracely_dev_key",          # an ingest key
    service_name="support-agent",
    env="prod",                         # prod | staging | ci | dev — the gating axis
    instrument="auto",                  # auto-detect openai / anthropic / google / mistral / langchain
)

with tracely.trace(agent="support-agent", conversation="conv-1", user="u_42"):
    client.chat.completions.create(
        model="gpt-4o",
        messages=[{"role": "user", "content": "Where is order ORD-4471?"}],
    )
That produces a GENERATION span with model, messages, tokens, latency, tool calls and cost.
Need spans for your own logic? @observe and the manual agent / tool / llm / retriever /guardrail context managers are all there.
Any OTLP/HTTP exporter works too — point it at POST {endpoint}/v1/traces withAuthorization: Bearer tracely_dev_key. Tracely reads standard gen_ai.* / OpenInference attributes
plus first-class hints: tracely.agent.id (auto-registered), tracely.agent.version,tracely.conversation.id / turn.* / step.*, tracely.observation.type, and tracely.env
(prod|staging|ci|dev — the gating axis).
The agent catalog tells Tracely which agents, tools, prompts and models the conversation has
(not just which ones fired) — it fills the Conversation Agents panel and the Fleet view, and is
readable from judge prompts as @LIST_AGENT. State deltas record what each step wrote to your
shared state, folded into the Conversation State drawer and the per-message State Δ column:
AGENTS = [{
    "name": "support",
    "description": "front-line agent; routes billing questions",
    "system_prompt": "You are the support agent for Acme…",   # free-form keys kept verbatim
    "model": "gpt-5.2",
    "tools": {"lookup_order": {"name": "lookup_order", "description": "order by id",
                               "parameters": {"type": "object", "properties": {"order_id": {"type": "string"}}}}},
}]

with tracely.trace(agent="support", conversation="conv-1", agents=AGENTS):
    ...
    tracely.set_state({"cart": cart, "last_action": "add_to_cart"})   # inside any span/@observe
LangGraph users get state for free (node outputs are captured as deltas automatically), and
non-Python services can push the catalog with POST /api/sessions/{conversation_id}/config.
Full instrumentation guide → doc.tracely-ai.com · sdk/README.md
Gate your PRs
A promoted production failure becomes a regression test that blocks the PR that reintroduces it.
All you need is your ingest key (it identifies your workspace) and your Tracely API URL. Three ways to
wire it, depending on how your CI can reach your agent.
Register your agent's HTTP endpoint once, author scenarios —
multi-turn conversations, or an adversarial goal a red-team model improvises against — and Tracely
drives them itself. Nothing to install, import or shim, so a TypeScript or Go service gates exactly
like a Python one.
      - uses: Jwuthri/Tracely/.github/actions/tracely-gate@master
        with:
          api:   https://tracely.your-co.dev
          key:   ${{ secrets.TRACELY_KEY }}
          # agent: planner,support-agent   ← a subset; omit it to gate EVERY agent with scenarios
Scenarios belong to an agent, so leaving agent blank gates each one in its own run and fails the job
if any of them fails — a new agent is covered the day someone writes its first scenario.
If your pipeline already runs your agent instrumented with tracely.env=ci, the gate matches those
traces to your promoted cases (by input) and returns PASS/FAIL.
# .github/workflows/tracely.yml
name: Tracely gate
on: pull_request
permissions:
  contents: read
  statuses: write          # post the blocking commit status
  pull-requests: write     # upsert the results comment
jobs:
  gate:
    runs-on: ubuntu-latest
    steps:
      - uses: actions/checkout@v4
      # → your existing step(s) that run the agent and emit env=ci traces go here ←
      - uses: Jwuthri/Tracely/.github/actions/tracely-gate@master
        with:
          mode:  gate                          # grade the ci traces this workflow emitted
          agent: planner                       # which agent's promoted suite to run
          api:   https://tracely.your-co.dev   # your Tracely backend (TRACELY_API)
          key:   ${{ secrets.TRACELY_KEY }}    # your ingest key = your workspace
Re-runs your agent on each promoted case's recorded input, serving the recorded tool/LLM outputs as
fixtures — deterministic, offline, no API keys, no cost — then gates. Guarantees the exact failing
inputs are tested.
      - run: pip install tracely-ai
      - run: tracely replay planner --entrypoint my_pkg.agent:run    # a Python agent
        # …or any language:  tracely replay planner --cmd "node run.js"  (reads $TRACELY_INPUT)
        env:
          TRACELY_API: https://tracely.your-co.dev
          TRACELY_KEY: ${{ secrets.TRACELY_KEY }}
Hermetic replay requires your agent to route tool/model calls through the SDK's call_tool /call_llm seam (see the SDK guide); add --live to make real calls instead.
Both commands auto-detect the PR/commit from the Actions context; web-url / TRACELY_WEB_URL is
optional and only builds the "view gate run" link in the PR comment.
ℹ️ The repo's own
.github/workflows/tracely-gate.ymlis
Tracely dogfooding itself — it replays the bundledweather_agentexample, which is why it uses
an in-repopip install ./sdk. Your integration is one of the three options above, not that file.
Get told, don't go looking
Settings → Alerts. Pick what fires the rule, then draw what happens.
| Trigger | Fires when |
|---|---|
CI gate failed |
a gate run finished FAIL — or NO_COVERAGE, the suite that could not run, which is the quietly-green failure nobody notices |
Conversation failed |
a live turn failed a non-advisory evaluator. Filter by evaluator, or by the text of the judge's own reason |
New failure mode |
a failure signature no trace has produced before — the alert you cannot get from logs |
Evaluator FAIL rate / Average score / Overall failure rate |
a rate or average crosses a line over a sliding window |
Steps: condition (a Jinja gate that stops the rest of the flow), Slack, email,
webhook (any verb, your own headers — Authorization: Bearer … — and a templated JSON body),
LLM prompt (with declared output fields the next step reads as {{ steps[0].result.field }}),
Python expression. Run test executes the flow against a real recent failure and shows what
each step actually sent, after templating.
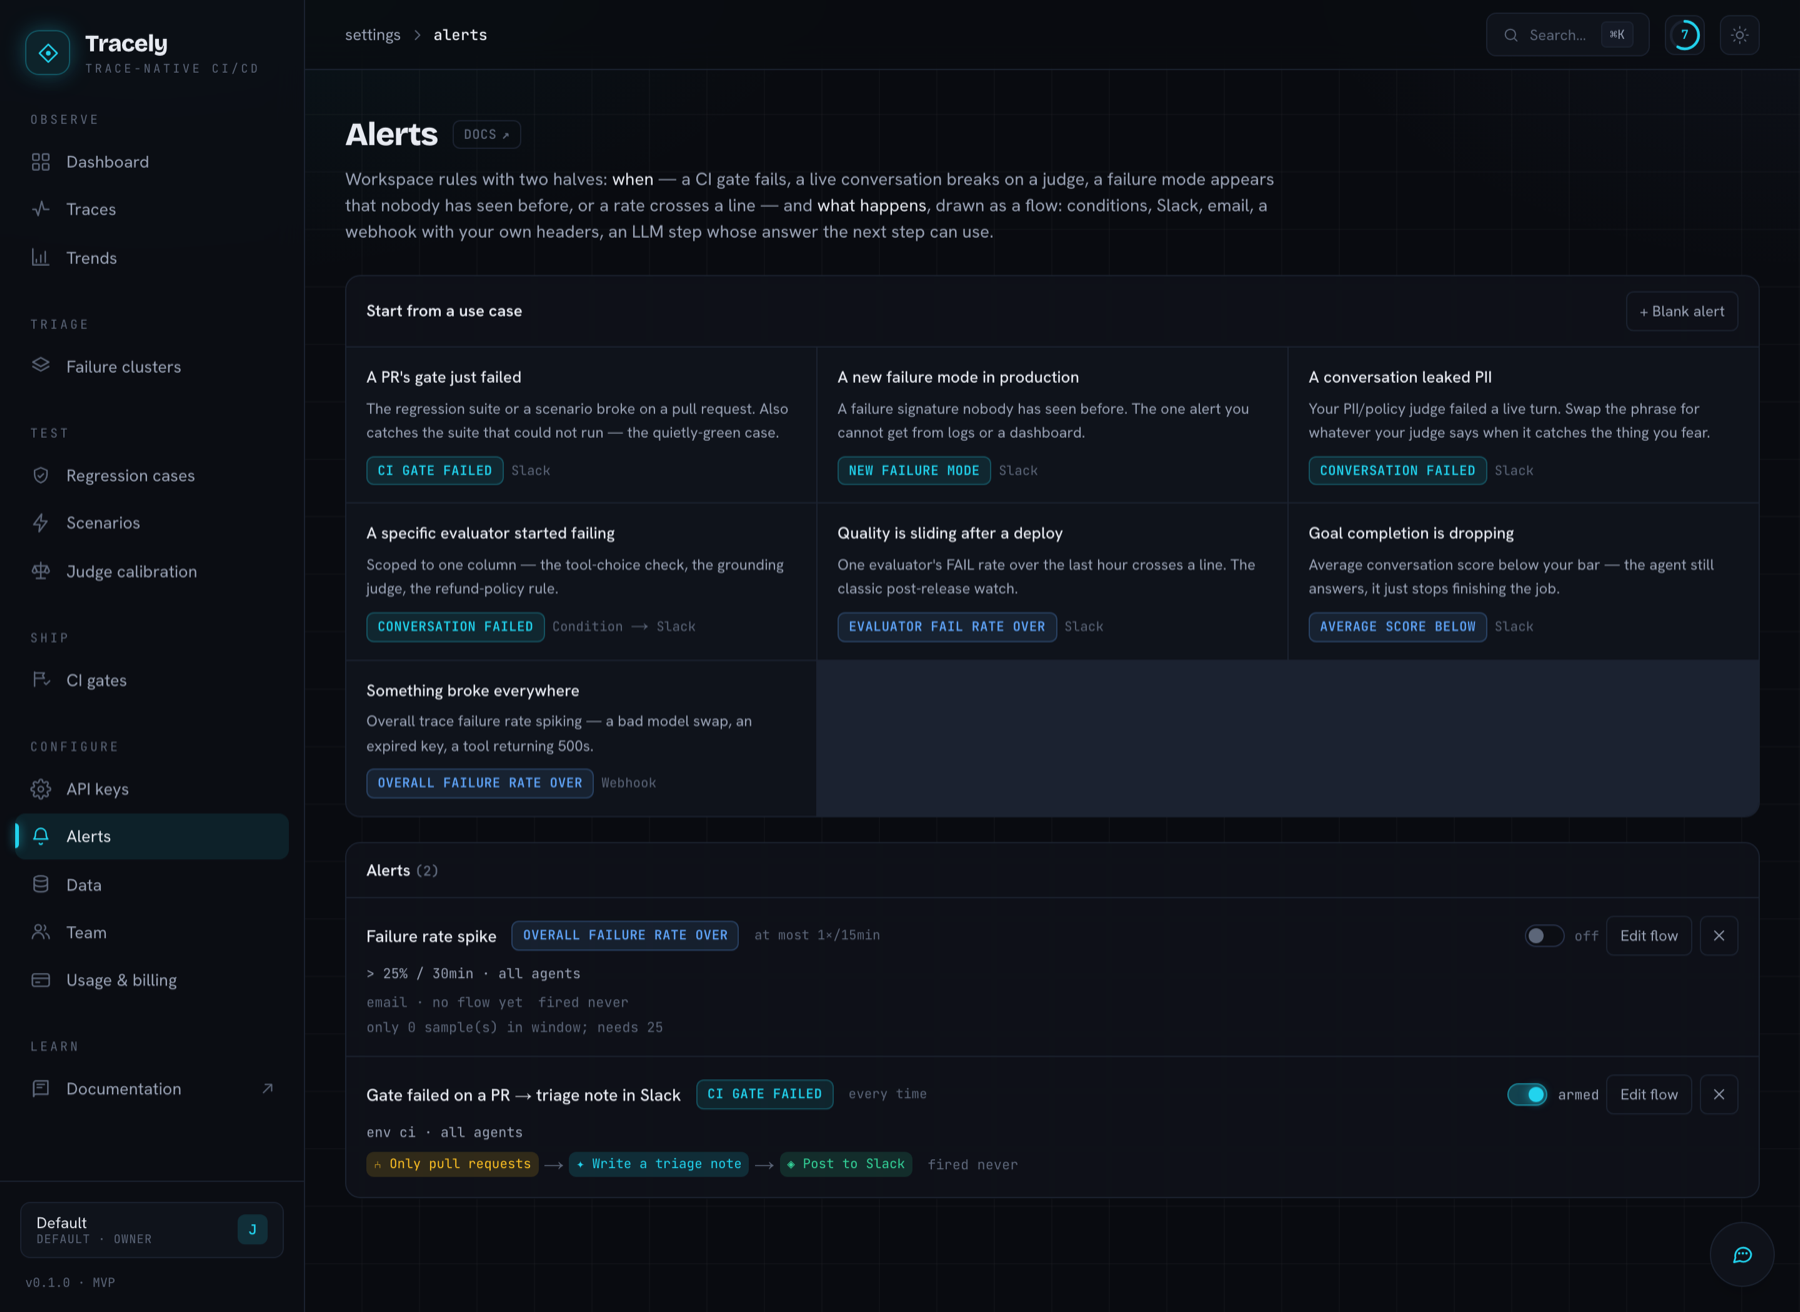
The same rules are reachable from the in-app assistant
("Slack me when the refund judge fails a conversation") and from the MCP server, so an agent can
arm one for you. Alerts guide →
Drive it from your editor
Every backend serves an MCP endpoint at /mcp, so a coding agent
reads your traces and writes your evaluators without any glue code:
claude mcp add --transport http tracely http://localhost:8000/mcp \
  --header "Authorization: Bearer tracely_dev_key"
Then: "look at the last 20 traces, find what's failing, and add an evaluation column that catches
it." Tools over traces, failure clusters, evaluators and trends — scoped to the key's workspace,
same as every other call. On hosted Tracely the endpoint ishttps://api.tracely-ai.com/mcp. Docs
Teach your coding agent Tracely
MCP gives your agent your data. The Tracely skill gives it the know-how — how to instrument,
what to evaluate, and how to wire the gate — so "add Tracely to this agent" is one sentence instead
of a docs tab.
npx skills add https://github.com/Jwuthri/Tracely --skill tracely
Works with Claude Code, Cursor, Copilot, Antigravity and anything else theskills CLI supports — add -g for a global install,--agent '*' for every agent on the machine.
|
Knows the whole surface
|
And the traps that silently produce a useless workspace
|
Prefer to read it yourself? It's plain Markdown: skills/tracely/.
Architecture
The write path deliberately mirrors Langfuse's proven design — reimplemented in Python, with agent
semantics promoted to first-class indexed columns (Langfuse keeps them as read-time strings):
SDK/OTLP → POST /v1/traces → S3 blob (durable FIRST) → Redis/Celery
  → worker: otel mapping → registry upsert → ClickHouse events
  → evaluate_run_task → scores + structural clustering → alert flows
| Layer | Tech | Where |
|---|---|---|
| Backend (API + domain) | FastAPI + Pydantic v2 | backend/ |
| Workers | Celery + Redis | workers/ |
| Traces + scores (OLAP) | ClickHouse (ReplacingMergeTree) |
backend/tracely/infrastructure/clickhouse/ddl |
| Registry (OLTP) | Postgres + pgvector + SQLAlchemy 2.0 + Alembic | backend/migrations |
| Queue / Blobs | Redis / MinIO·S3 (blob-first, source of truth) | — |
| Frontend | Next.js 15 (App Router) + Tailwind + React Flow | frontend/ |
| SDK + CI gate CLI | tracely-ai (OTel wrapper + tracely CLI) |
sdk/ |
| Tooling | uv workspace (Python) · pnpm (web) | — |
One deliberate adaptation: ClickHouse server-side async_insert instead of an in-process write buffer
(Celery tasks don't share memory). Why
Repo map — each folder has its own detailed README
| Folder | What's inside |
|---|---|
backend/ |
The tracely package: FastAPI API + shared domain (OTLP mapping, ClickHouse/Postgres/S3, registry, evaluators, failure intelligence, regression, gate, alert flows, auth, Celery tasks). |
workers/ |
The deployable Celery worker runtime. |
frontend/ |
The Next.js web app — trace explorer, clusters, cases, gates, trends, alerts builder, settings, auth. |
sdk/ |
The Python SDK (instrument agents over OTLP, hermetic record-replay) + the tracely CI gate CLI. |
docs/ |
The published docs site (Nextra) — SDK reference and the per-screen product guide. make docs → :3002. |
skills/ |
The Tracely agent skill — npx skills add https://github.com/Jwuthri/Tracely --skill tracely. |
scripts/ |
Dev/demo helpers (raw-OTLP sender, one-command seed_demo.py, gate shim). |
design/ |
The full design dossier — reverse-engineered Langfuse + every Tracely design decision. |
Key environment variables
| Variable | Default | Purpose |
|---|---|---|
AUTH_MODE |
dev |
dev (open, no login) · local (email/password, self-host) · clerk (hosted SaaS). |
SESSION_SECRET |
— | Required when AUTH_MODE=local: HS256 signing key for JWTs (≥32 chars). |
SECRETS_ENCRYPTION_KEY |
— | Encrypts a workspace's own OpenRouter key at rest (≥32 chars). |
CLERK_ISSUER |
— | Required when AUTH_MODE=clerk. |
OPENROUTER_API_KEY |
— | Server-wide LLM access for judges, failure intelligence, meta-analysis. Workspaces can bring their own key instead. |
RESEND_API_KEY |
— | Transactional email: invites, password resets, and the alert flow's email step. |
ALLOW_PRIVATE_URLS |
unset | Whether outbound calls (agent endpoints, alert webhooks) may target private addresses. Unset = allowed everywhere except prod. |
TRACELY_BACKEND_PORT |
8000 |
Backend host port (Docker compose override). |
TRACELY_WEB_PORT |
3001 |
Frontend host port (Docker compose override). |
With no LLM key at all the pipeline still runs — judges, failure intelligence and meta-analysis
degrade rather than crash. Full list: backend/tracely/config.py.
Contributing
Issues and PRs welcome. Before pushing:
uv run pytest -q backend/tests sdk/tests    # what CI runs
uv run ruff check . && uv run ruff format .
cd frontend && pnpm test && pnpm build      # vitest + tsc typecheck + lint
License
MIT © Julien Wuthrich
tracely-ai.com · Docs · Product guide · Star on GitHub
If Tracely is useful to you, a ⭐ helps other people find it.
Reviews (0)
Sign in to leave a review.
Leave a reviewNo results found