llm.log
Health Pass
- License — License: MIT
- Description — Repository has a description
- Active repo — Last push 0 days ago
- Community trust — 11 GitHub stars
Code Pass
- Code scan — Scanned 12 files during light audit, no dangerous patterns found
Permissions Pass
- Permissions — No dangerous permissions requested
This is a lightweight, local proxy tool that sits between your applications and LLM APIs. It logs every request and response, tracking tokens and calculating costs without requiring any changes to your existing code.
Security Assessment
Overall Risk: Low. Because the tool operates as a proxy to capture prompts and API responses, it inherently handles highly sensitive data (your LLM inputs and outputs). However, this data is stored securely on your local machine in an SQLite database rather than being sent to an external cloud service. The automated code scan found no hardcoded secrets, dangerous patterns, or requests for elevated system permissions. It does make network requests, but only to route traffic to your configured LLM providers (like OpenAI or Anthropic) as expected.
Quality Assessment
The project exhibits strong health and maintenance signals. It is licensed under the permissive MIT license and was updated very recently (pushed to 0 days ago). While it is a relatively new tool with a modest community footprint (11 GitHub stars), it features excellent documentation and passed all automated health and security checks.
Verdict
Safe to use. The proxy nature of this tool requires you to trust it with your LLM traffic, but its local-first architecture, transparent codebase, and zero dangerous permissions make it a reliable choice for local observability.
Know what you spend, see what you send. Lightweight local proxy that logs every LLM call — costs, tokens, full prompts and responses.
llm.log
Lightweight LLM observability — costs, tokens, and full request/response capture.
Three commands to start. Local proxy, single binary, zero config.
Install · Quick Start · Dashboard · CLI · Export · Data Management · How it Works
![]()


TUI — llm-log dash
 |
 |
 |
 |
Web UI — llm-log ui
What is llm.log?
A lightweight local proxy for LLM observability. It sits between your apps and LLM APIs, captures every request and response, tracks token usage, and calculates costs — all stored locally in SQLite, without changing a single line of code.
Not as heavy as enterprise platforms (Langfuse, Helicone, etc.) that need Docker, databases, and cloud accounts. Not as limited as log parsers (ccusage, tokscale) that only show token counts. llm.log gives you full prompt/response capture with cost tracking in a single binary you can install in seconds.
- Zero code changes — works via
HTTPS_PROXY, picked up by most apps automatically - Full request/response capture — every prompt and response stored, searchable, exportable
- Real costs — auto-updated pricing for 800+ models, cache token breakdowns
- All major providers — OpenAI, Anthropic, OpenRouter, Groq, DeepSeek, Mistral, and more
- All API formats — Chat Completions, Responses API, Anthropic Messages
- Claude Code aware — on a subscription? see what you'd pay without it. On API keys? see your actual spend
- Web UI + TUI — browser dashboard with analytics, or terminal dashboard with interactive heatmap and mouse support
- Minimal overhead — async logging, never blocks your requests
- Single binary — pure Go, no CGO, no dependencies, no Docker
Install
# macOS / Linux (Homebrew)
brew install lanesket/tap/llm-log

# or with Go
go install github.com/lanesket/llm.log/cmd/llm-log@latest

# or from source
git clone https://github.com/lanesket/llm.log.git && cd llm.log && make build
Pre-built binaries for macOS and Linux on the Releases page.
Quick Start
llm-log setup   # one-time: generate CA cert, trust it, configure shell
llm-log start   # start the proxy
llm-log dash    # open the dashboard
After setup, open a new terminal (or run source ~/.zshrc) — then every LLM API call is logged automatically.
Already running apps need a restart to pick up the proxy.
On macOS, new apps from Dock pick it up automatically.
Note: llm.log intercepts requests that go directly from your machine to LLM APIs.
Tools that route through their own servers (Cursor Pro, VS Code Copilot with built-in subscription) won't be logged.
If the tool supports your own API key, requests go directly to the provider and llm.log captures them.
Web UI
llm-log ui # opens http://localhost:9923
| Page | What it shows |
|---|---|
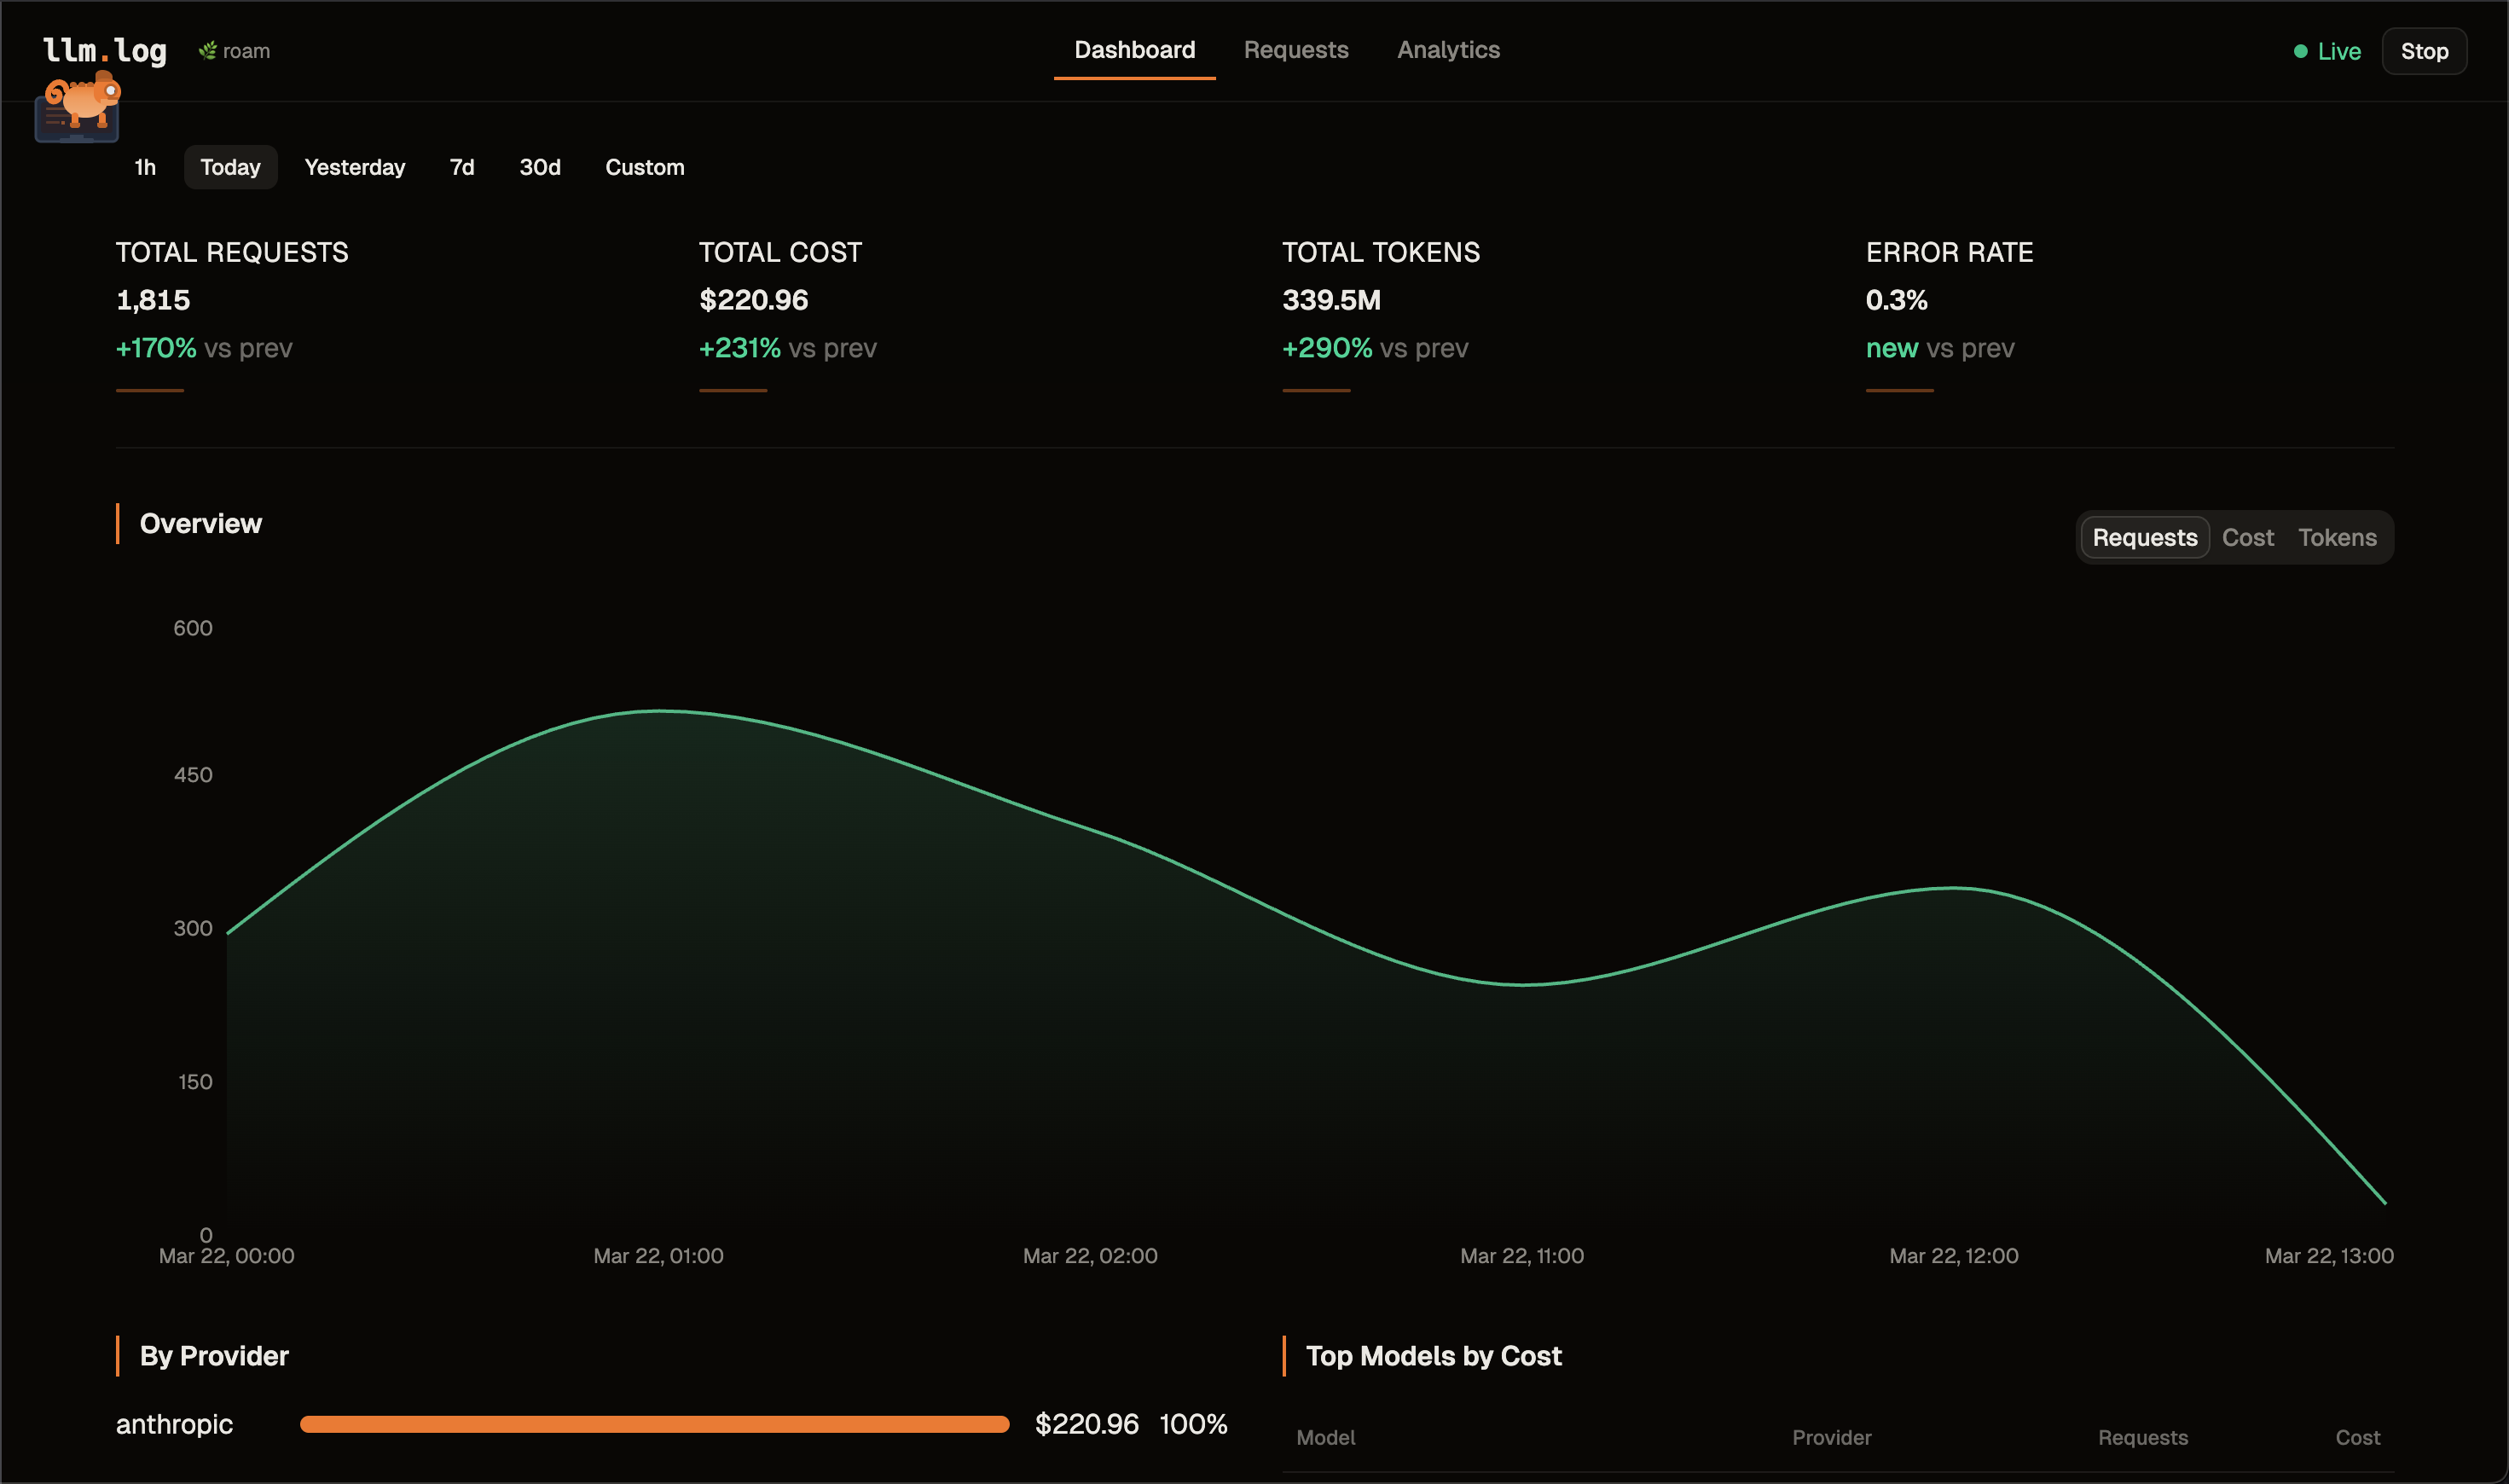
| Dashboard | Real-time metrics, contribution heatmap, area charts, provider breakdown, top models |
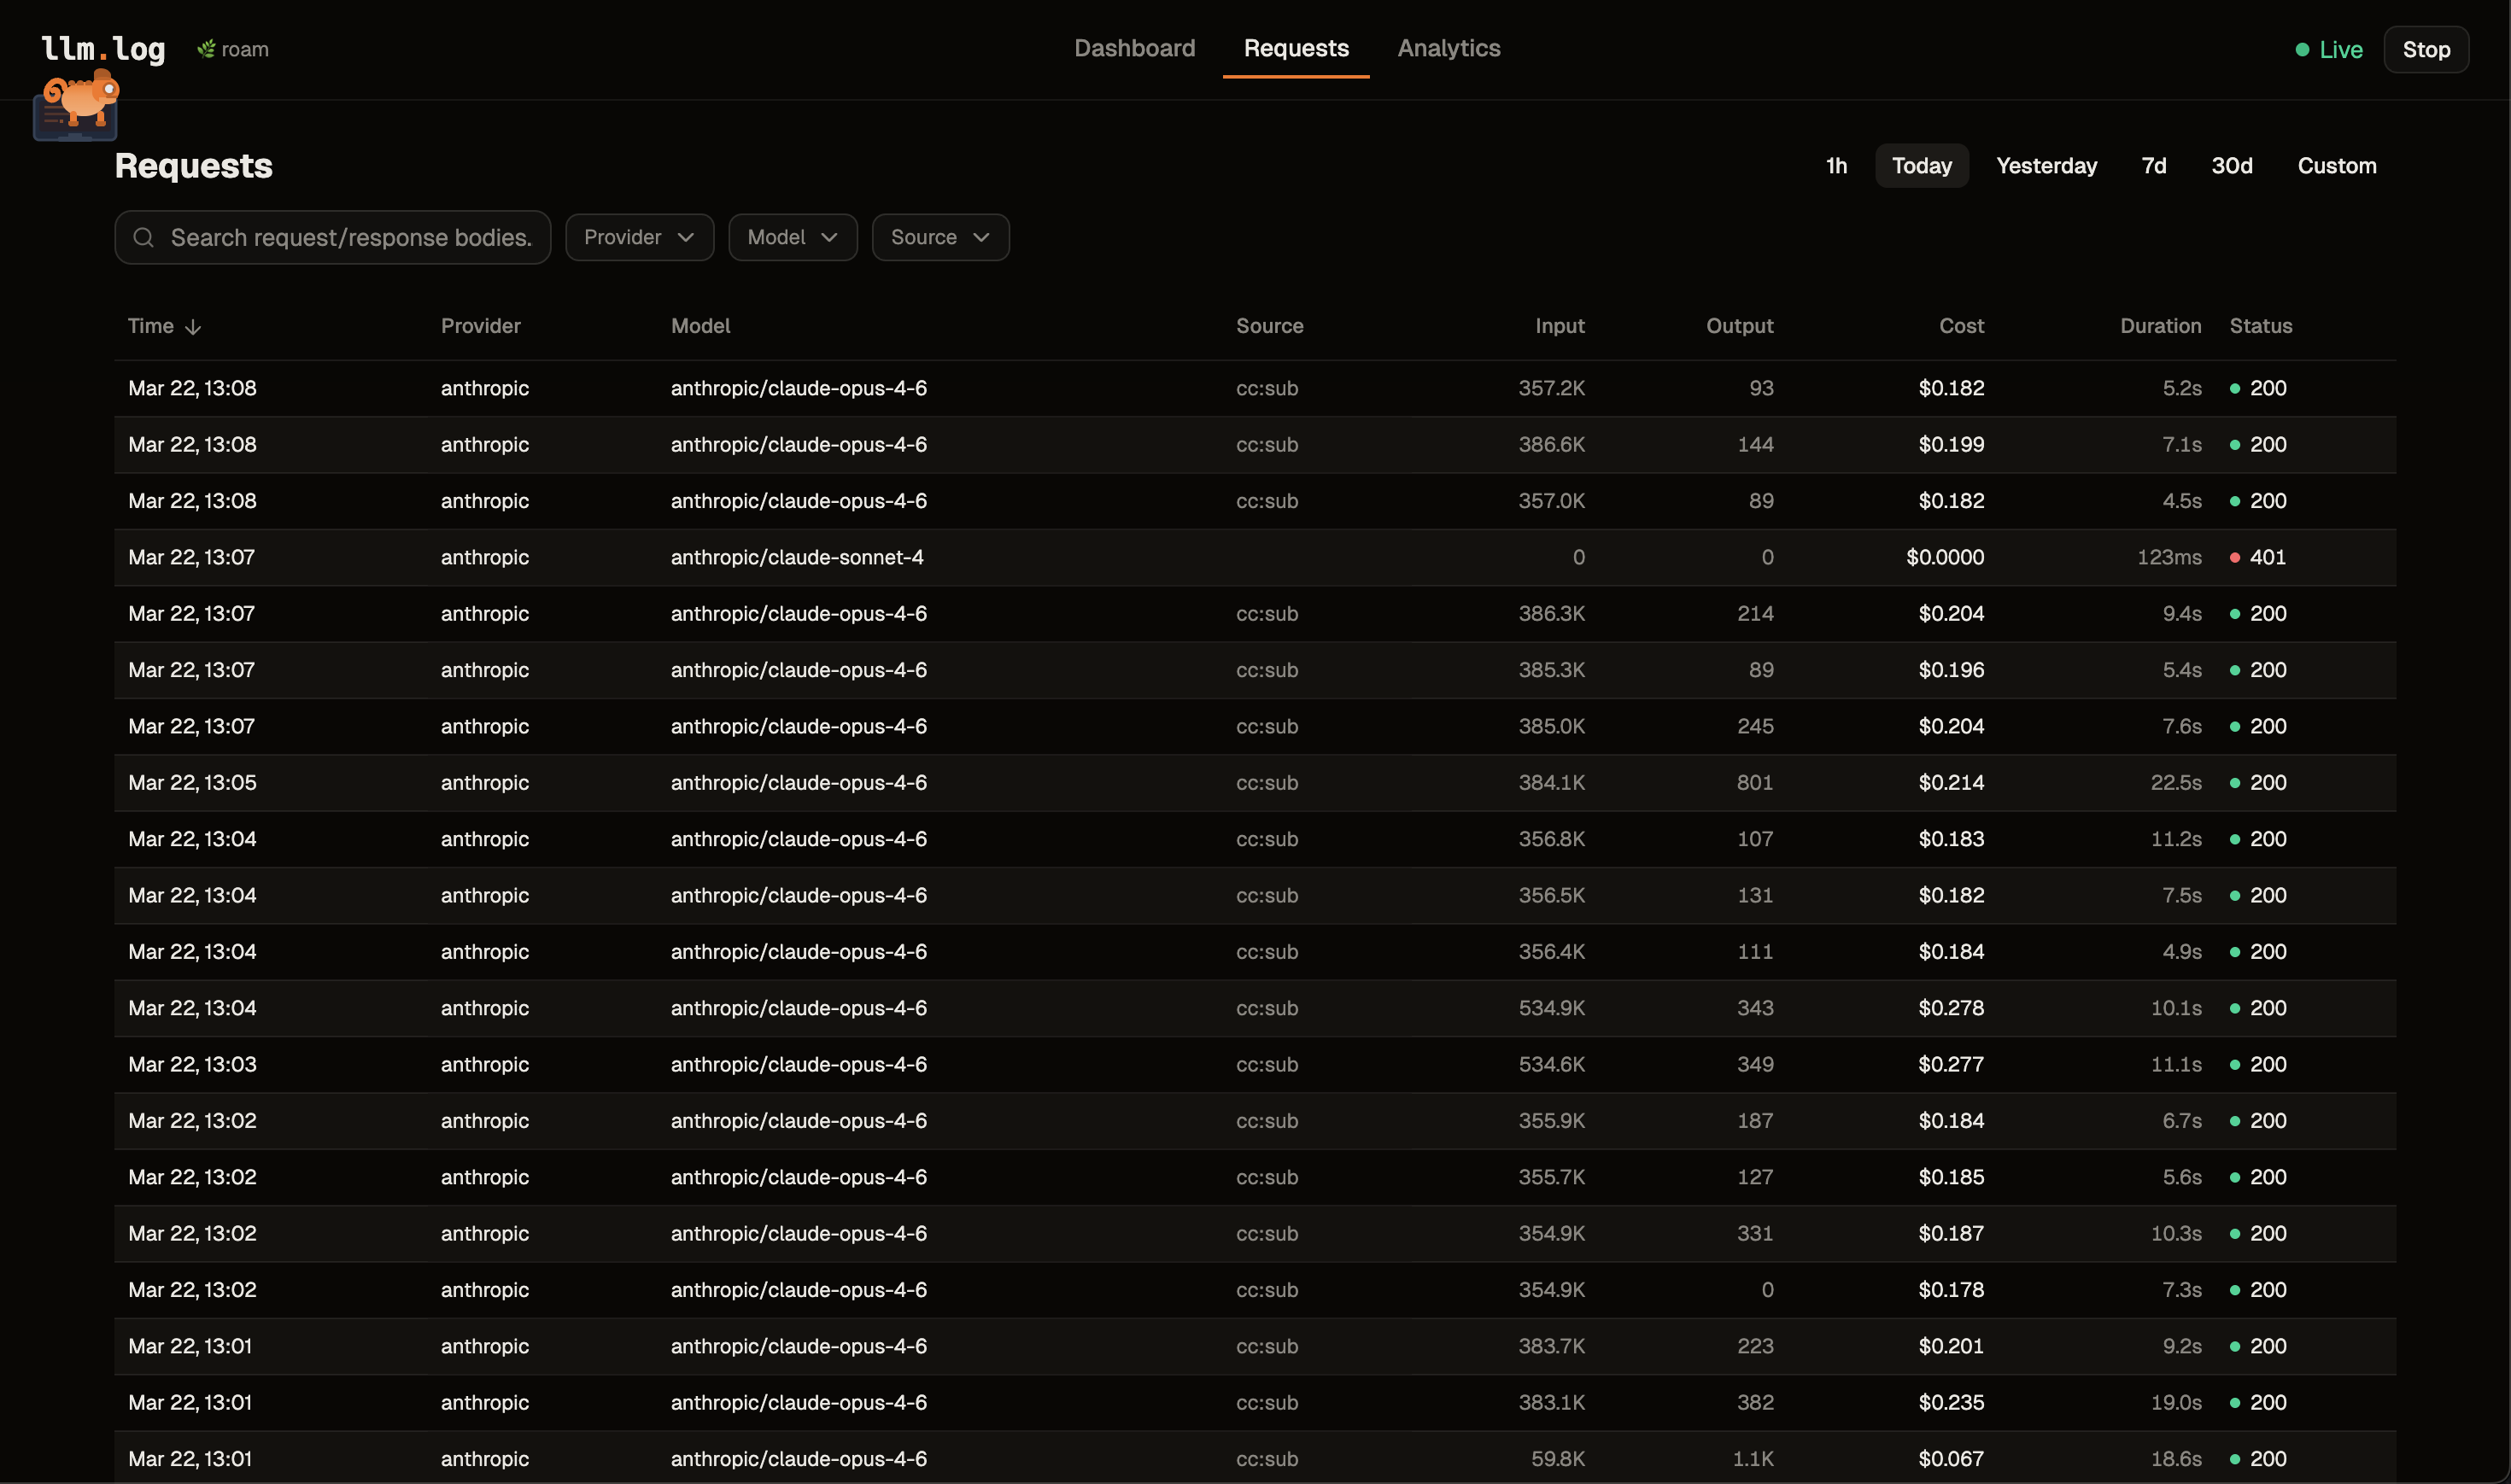
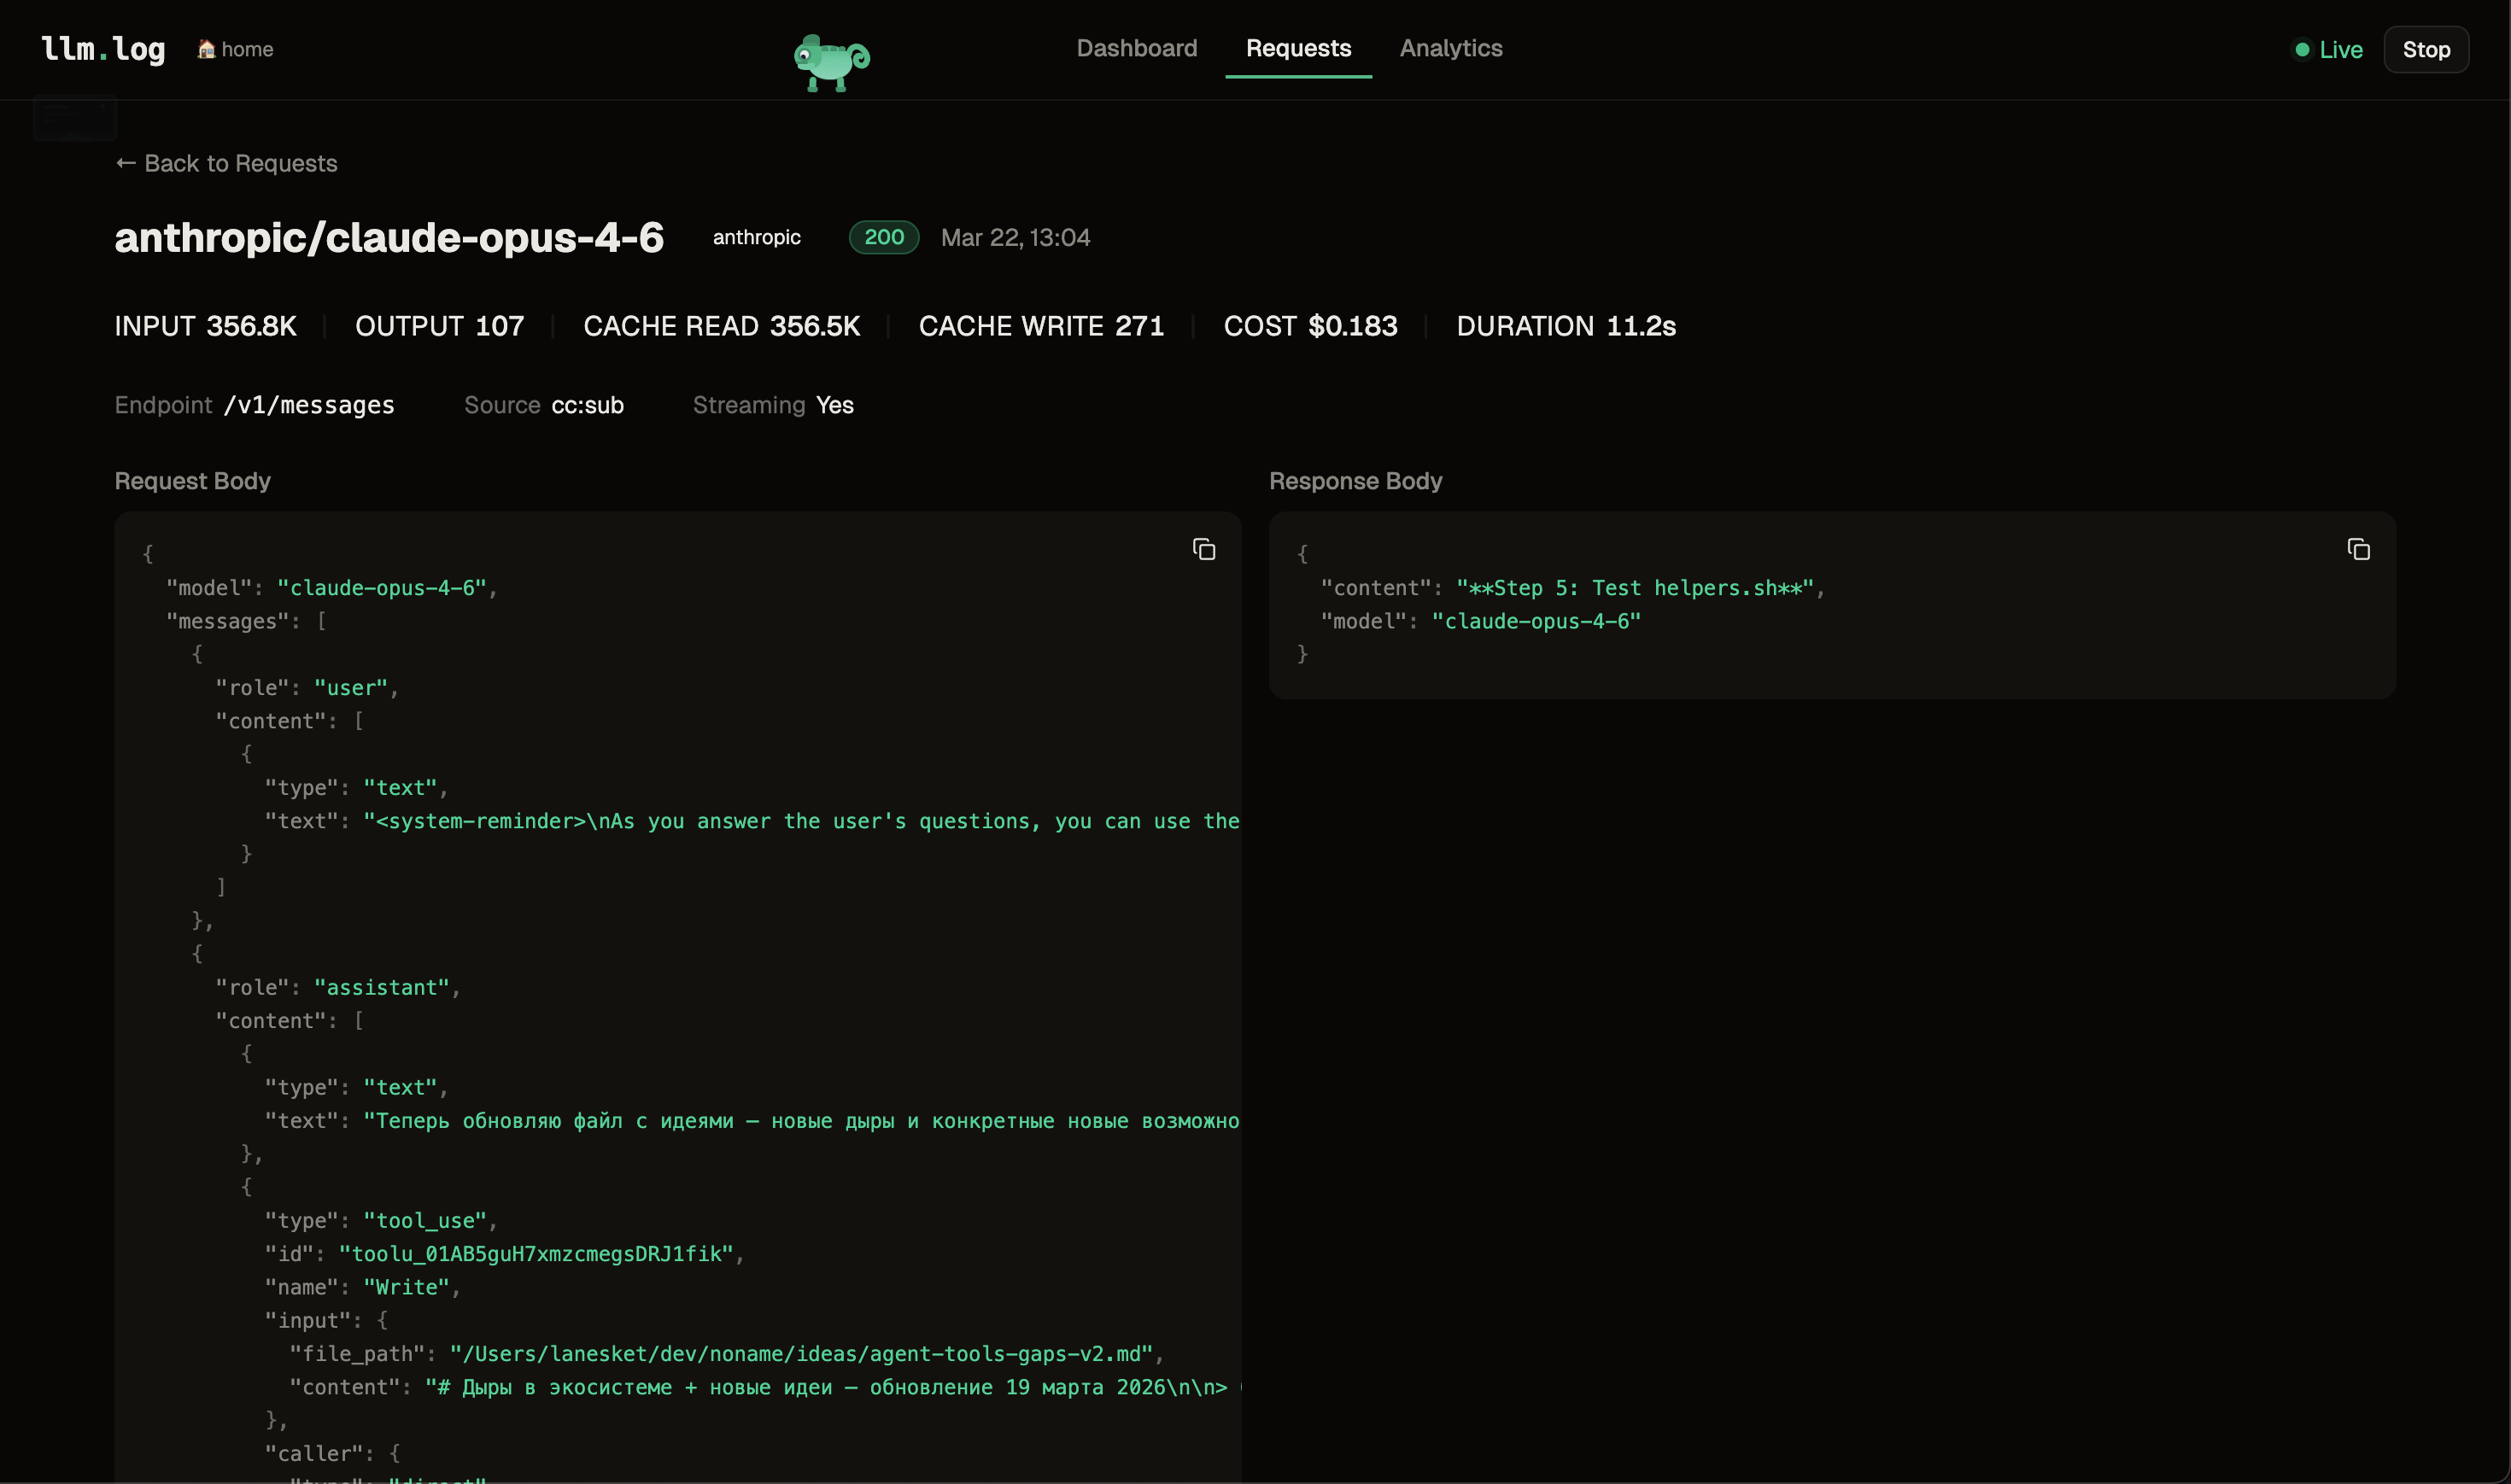
| Requests | Paginated table with sorting, filters, search. Click a row to see full detail with copyable values |
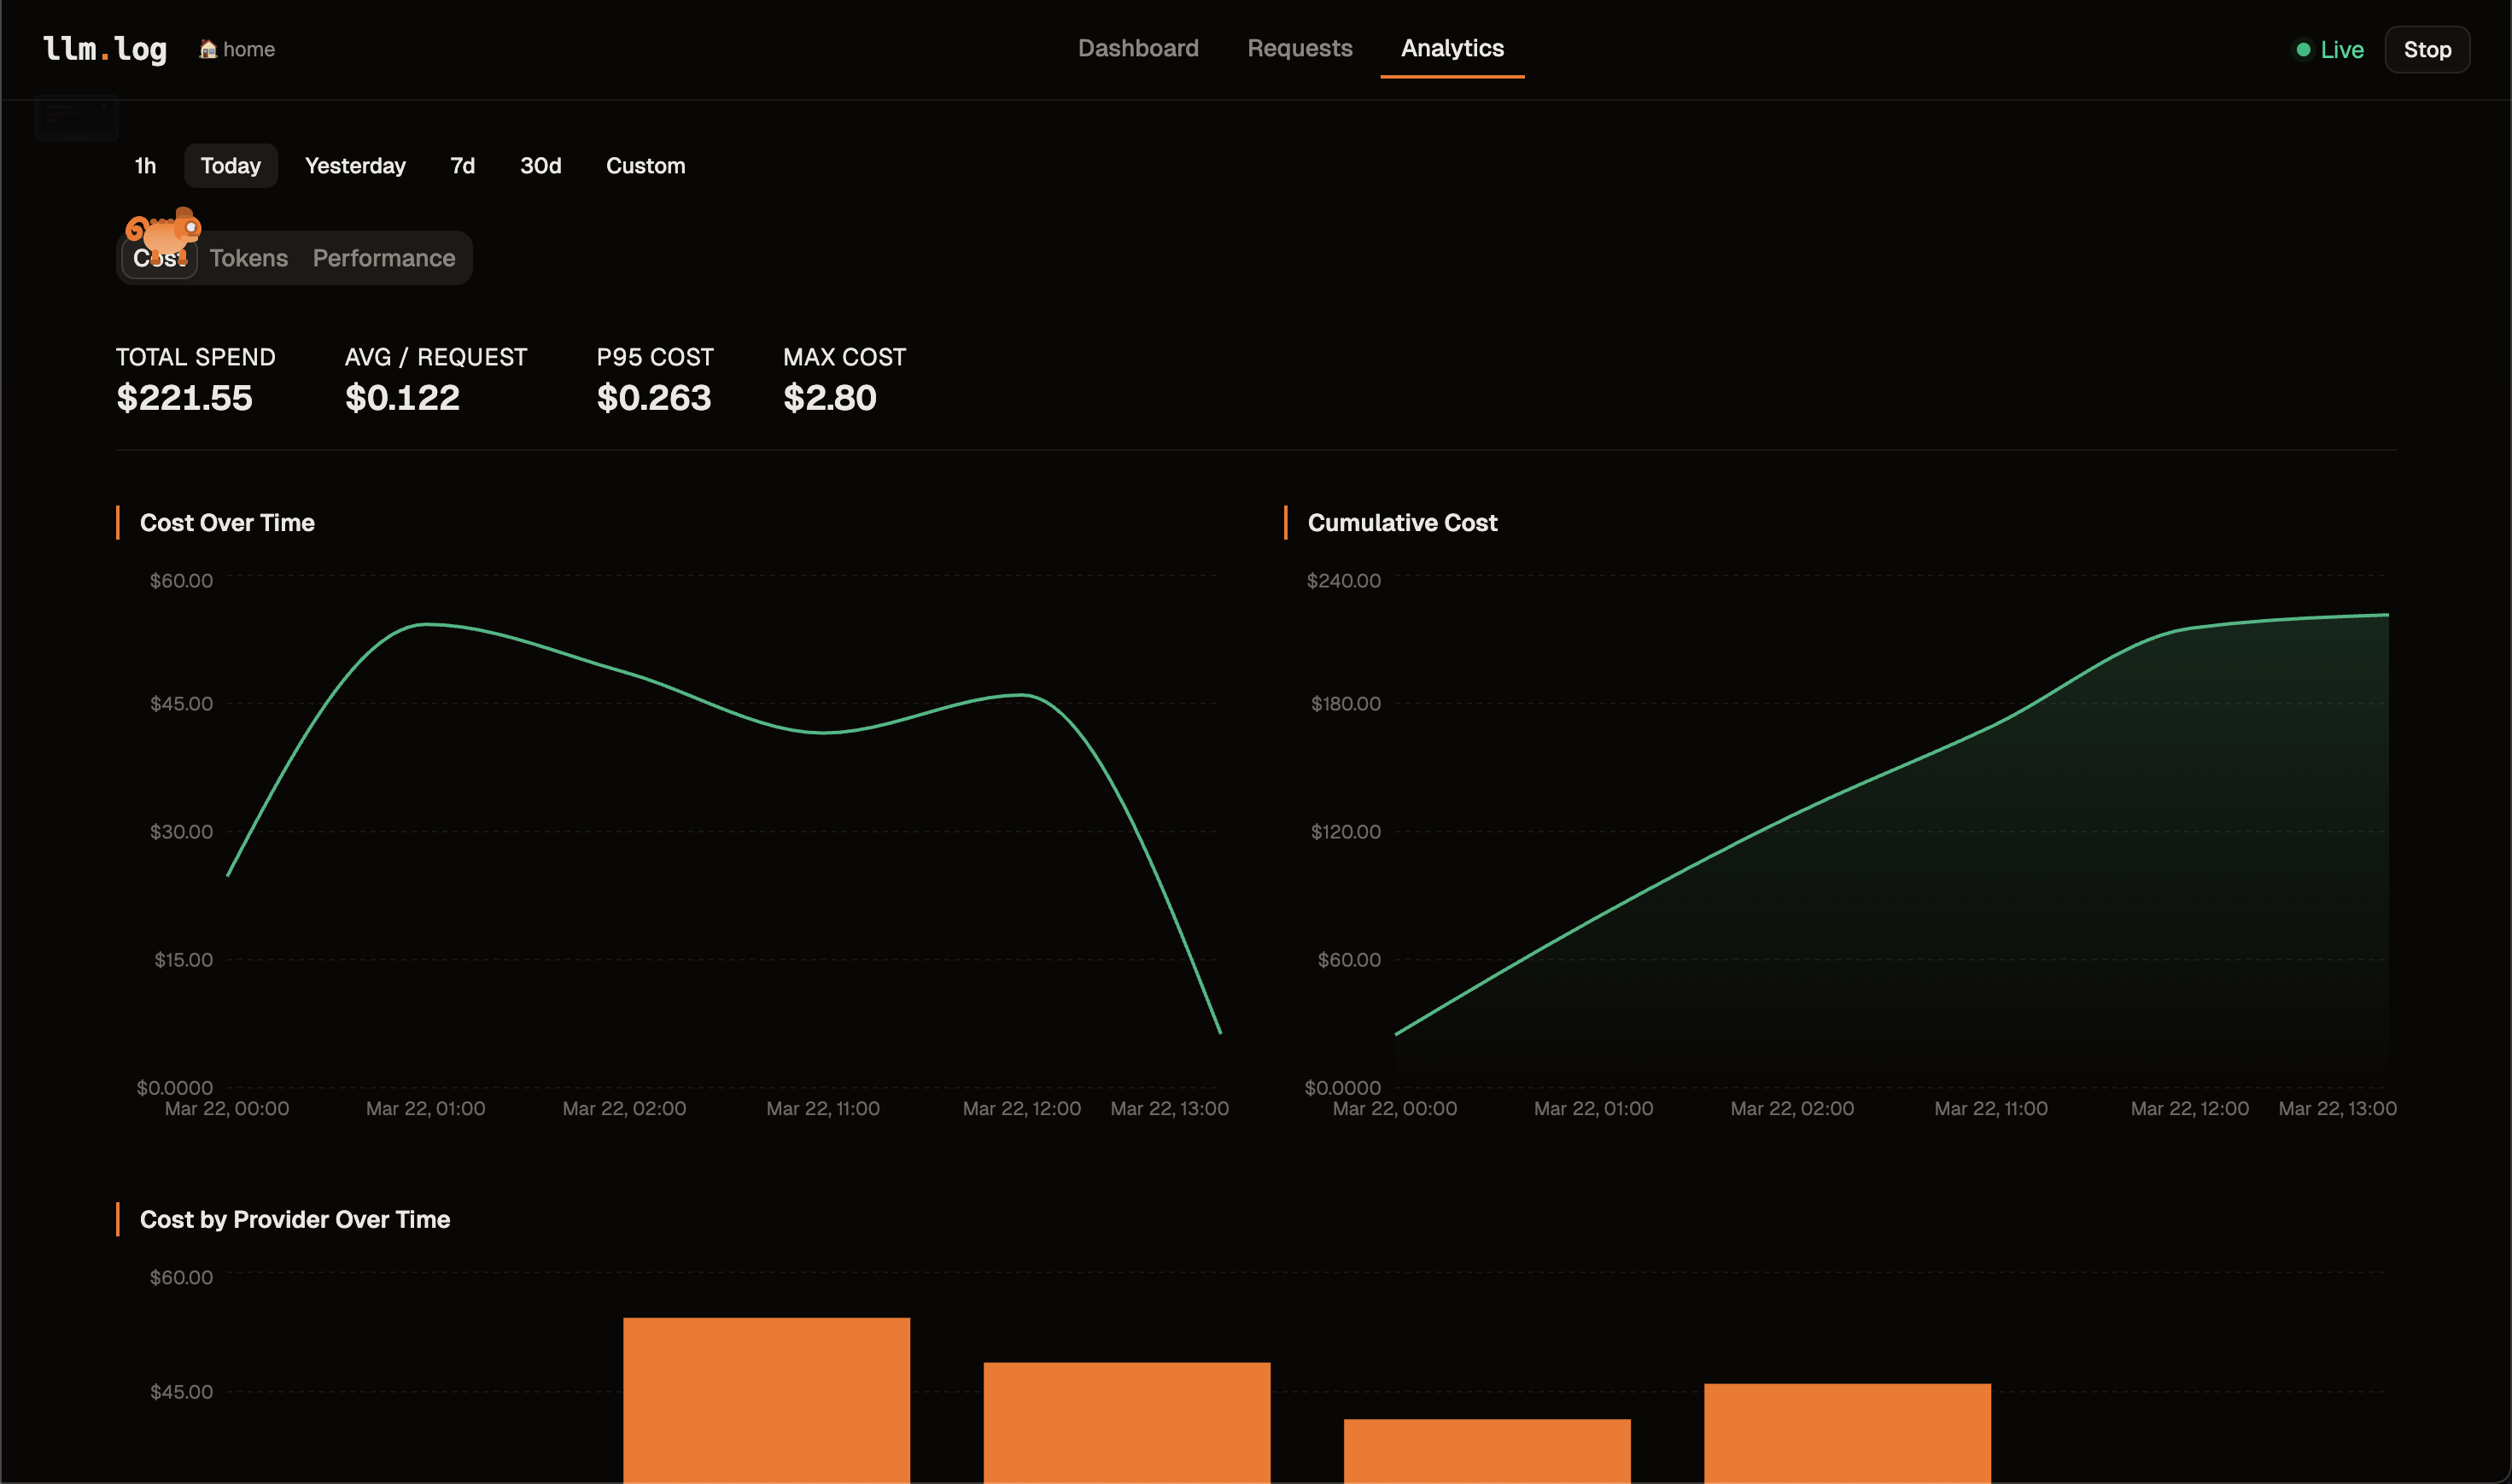
| Analytics | Tabbed sections — Cost (over time, cumulative, by provider, distribution, top expensive), Tokens (over time, avg/model, cache hit rate), Performance (latency, heatmap) |
TUI Dashboard
llm-log dashboard # or: llm-log dash
| Tab | What it shows |
|---|---|
| Overview | Total spend, request count, cache hit rate, interactive contribution heatmap with per-day breakdown, top models |
| Chart | Cumulative cost, requests, tokens, cache hit rate over time |
| Cost | Breakdown by provider/model with percentages, latency, bars |
| Requests | Browse requests, inspect full prompt/response JSON |
Keys: 1-4 tabs · tab switch · hjkl/arrows navigate · p period · s source · f provider · m model/provider · enter detail · c/p/r copy · e export · ? help · q quit
Mouse: click tabs, heatmap cells, request rows · scroll wheel to navigate lists
CLI
llm-log status                    # daemon status + today's summary
llm-log logs                      # recent requests
llm-log logs --id 42              # full detail with prompt/response
llm-log logs -s cc:sub            # filter by source
llm-log stats                     # usage stats by provider
llm-log stats -b model -p week   # by model, last week
llm-log stats --json              # JSON output
Export
Export logged data to CSV, JSON, or JSONL for analysis in Excel, Jupyter, pandas, etc.
llm-log export                            # CSV to stdout (last month)
llm-log export -f json -o data.json       # JSON to file
llm-log export -f jsonl -p week           # JSONL, last week
llm-log export --from 2025-03-01 --to 2025-03-15  # date range
llm-log export -s cc:sub --provider anthropic      # filtered
llm-log export --with-bodies -p today     # include request/response bodies
| Flag | Description | Default |
|---|---|---|
-f, --format |
Output format: csv, json, jsonl |
csv |
-p, --period |
Period: today, week, month, all |
month |
--from |
Start date (YYYY-MM-DD) |
— |
--to |
End date (YYYY-MM-DD) |
— |
-s, --source |
Filter by source | all |
--provider |
Filter by provider | all |
-o, --output |
Output file (default: stdout) | stdout |
--with-bodies |
Include request/response bodies | false |
--from/--to override --period when both are provided.
In the dashboard, press e to quick-export the current filtered view to llm-log-export-{timestamp}.csv in the current directory.
Data Management
Request/response bodies can grow large over time. Use prune to delete old bodies while keeping all metadata (tokens, costs, timestamps).
llm-log prune --older-than 30d              # delete bodies older than 30 days
llm-log prune --older-than 30d --dry-run    # preview without deleting
llm-log prune --older-than 6m --force       # skip confirmation (for cron)
Supported durations: 7d, 30d, 6m, 1y.
How it Works
Your app ──HTTPS_PROXY──▸ llm.log (127.0.0.1:9922)
                              │
                              ├─ LLM provider? ──▸ MITM ──▸ parse usage ──▸ SQLite
                              └─ Other?         ──▸ tunnel through (no interception)
llm-log setupgenerates a CA certificate and adds it to your system trust storellm-log startlaunches a daemon and setsHTTPS_PROXY+ CA env vars for all major tools- The proxy MITMs only known LLM domains — everything else tunnels untouched
- Streaming responses are tee'd — client gets data in real-time, proxy parses accumulated result
- Costs are calculated from auto-updated pricing data (780+ models)
Providers and formats
| Provider | Domain | API formats |
|---|---|---|
| OpenAI | api.openai.com | Chat Completions, Responses API |
| Anthropic | api.anthropic.com | Anthropic Messages |
| OpenRouter | openrouter.ai | All three |
| Groq | api.groq.com | Chat Completions |
| Together AI | api.together.xyz | Chat Completions |
| Fireworks | api.fireworks.ai | Chat Completions |
| DeepSeek | api.deepseek.com | Chat Completions (custom cache tokens) |
| Mistral | api.mistral.ai | Chat Completions |
| Perplexity | api.perplexity.ai | Sonar, Chat Completions |
| xAI | api.x.ai | Chat Completions |
Providers and wire formats are extensible — see Extending llm.log.
Proxy activation
| Mechanism | Scope | Platform |
|---|---|---|
~/.llm.log/env |
New terminal sessions | macOS, Linux |
launchctl setenv |
GUI apps from Dock | macOS |
systemctl --user |
GUI apps from menu | Linux (systemd) |
CA trust is configured for Node.js, Python, curl, Go, and Ruby via NODE_EXTRA_CA_CERTS, SSL_CERT_FILE, REQUESTS_CA_BUNDLE, and CURL_CA_BUNDLE.
Data storage
Everything in ~/.llm.log/ — SQLite (WAL mode), CA cert, cached pricing, env file, PID. Request/response bodies are gzip-compressed in a separate table.
License
MIT
Reviews (0)
Sign in to leave a review.
Leave a reviewNo results found