claudetop
Health Pass
- License — License: MIT
- Description — Repository has a description
- Active repo — Last push 0 days ago
- Community trust — 181 GitHub stars
Code Pass
- Code scan — Scanned 12 files during light audit, no dangerous patterns found
Permissions Pass
- Permissions — No dangerous permissions requested
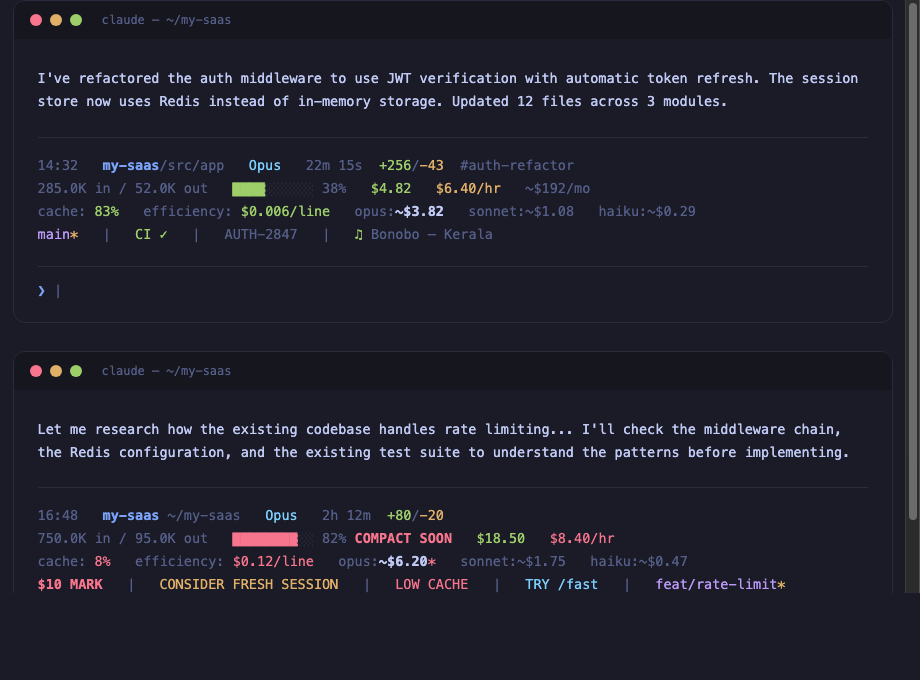
This tool provides a real-time terminal dashboard — similar to htop — designed to monitor token usage, costs, and cache efficiency during Claude Code sessions.
Security Assessment
Overall risk: Low. The automated code scan checked 12 files and found no dangerous patterns, hardcoded secrets, or requests for risky permissions. The tool is written in Shell and executes locally to read your local session data and calculate your spending. While the README offers a one-liner remote install command via `curl | bash` (which always requires caution), cloning the repository manually is recommended and allows for a full review of the script. As a monitoring utility, it does not appear to make external network requests or expose sensitive data.
Quality Assessment
The project is actively maintained, with its most recent push occurring today. It is properly licensed under the permissive and standard MIT license. With 181 GitHub stars, it demonstrates a solid baseline of community trust and indicates that other developers are actively finding the tool useful. The repository includes a clear description and highly detailed documentation.
Verdict
Safe to use.
htop for your Claude Code sessions — real-time cost, cache efficiency, model comparison, and smart alerts
claudetop
You're spending $20/day on Claude Code and can't see it.
claudetop shows you exactly where your tokens and dollars go — in real time.
14:32  my-project/src/app  Opus  20m 0s  +256/-43  #auth-refactor
152.3K in / 45.2K out  ████░░░░░░ 38%  $3.47  $5.10/hr  ~$174/mo
cache: 66%  efficiency: $0.012/line  opus:~$3.20  sonnet:~$0.88  haiku:~$0.23
in:80% out:20% (fresh:15% cwrite:7% cread:76%)
$5 MARK  |  main*  |  ♫ Artist - Song  |  PROJ-123  |  CI ✓
The problem
Claude Code doesn't show you what you're spending. You finish a session, check your billing dashboard, and discover a $65 charge for what felt like 30 minutes of work. You have no idea which session caused it, which model was wasteful, or whether your cache was even working.
I built claudetop after noticing my model estimate showed $10 but the actual bill was $65. Turns out, compaction was hiding 80% of my token usage. The cost was real — the visibility wasn't.
Install
Clone and install (recommended)
git clone https://github.com/liorwn/claudetop.git
cd claudetop && ./install.sh
One-liner
curl -fsSL https://raw.githubusercontent.com/liorwn/claudetop/main/install.sh | bash
As a Claude Code plugin
claude plugin marketplace add liorwn/claudetop
claude plugin install claudetop
This gives you the SessionEnd hook + all slash commands (/claudetop:stats, /claudetop:dashboard, /claudetop:branch, /claudetop:export, /claudetop:pricing) automatically.
Then restart Claude Code.
What you see
Before claudetop
>
A blank prompt. No context. No cost. No idea.
After claudetop
14:32  my-project/src/app  Opus  20m 0s  +256/-43  #auth-refactor
152.3K in / 45.2K out  ████░░░░░░ 38%  $3.47  $5.10/hr  ~$174/mo
cache: 66%  efficiency: $0.012/line  opus:~$3.20  sonnet:~$0.88  haiku:~$0.23
$5 MARK  |  TRY /fast  |  main*  |  CI ✓  |  ♫ Bonobo - Kerala
Every response, you see:
- What project you're in and how deep
- What model is running and for how long
- What it costs right now, per hour, and projected monthly
- How efficient your cache is (are you wasting tokens?)
- What it would cost on a different model (should you switch?)
- Smart alerts when something is wrong
Features
Real-time cost tracking
Your actual session cost (green), burn rate per hour, and monthly forecast extrapolated from your history. No more billing surprises.
Model cost comparison
See what your session would cost on Opus, Sonnet, or Haiku — with cache-aware pricing that accounts for your actual cache hit ratio. The current model is bolded so you can instantly compare.
Pricing updates automatically from the pricing.json in this repo — when Anthropic changes prices, claudetop stays current.
Cache efficiency
Your cache hit ratio tells you if you're being efficient. Green (≥60%) means most of your input tokens are being reused. Red (<30%) means something is forcing full re-reads — maybe compaction, maybe a model switch.
Smart alerts
Only appear when something needs your attention:
| Alert | What happened | What to do |
|---|---|---|
$5 MARK / $10 / $25 |
Cost milestone crossed | Gut-check: am I getting value? |
OVER BUDGET |
Daily budget exceeded | Wrap up or switch models |
CONSIDER FRESH SESSION |
>2hrs + >60% context | Start fresh — diminishing returns |
LOW CACHE |
<20% cache after 5min | Context was reset, tokens being re-read |
BURN RATE |
>$15/hr velocity | Runaway subagents or tight loops |
SPINNING? |
>$1 spent, zero code output | Stuck in a research loop |
TRY /fast |
>$0.05/line on Opus | This task doesn't need the biggest model |
COMPACT SOON |
Context window >80% full | Auto-compaction is imminent |
Session history & analytics
Every session is automatically logged. See where your money goes:
claudetop-stats              # Today's summary
claudetop-stats week         # This week
claudetop-stats month        # This month
claudetop-stats all          # All time
claudetop-stats tag auth     # Filter by tag
claudetop-stats  This Week
──────────────────────────────────────────────────────

Summary
  Sessions:     12
  Total cost:   $47.30
  Avg / session:  $3.94
  Daily avg:      $9.46

Cost by model
  claude-opus-4-6:       $38.20
  claude-sonnet-4-6:     $9.10

Top projects by cost
  rri-os                 $22.50  (4 sessions)
  pistol-claw            $14.80  (5 sessions)
  the-table              $10.00  (3 sessions)
Deep analytics engine
The analytics engine scans all Claude Code JSONL session files — not just hook-recorded ones. It captures your complete history including sessions from before claudetop was installed, subagent costs, and per-turn token breakdowns.
claudetop-engine scan       # Scan all JSONL files → SQLite
claudetop-engine today      # Today (with per-turn tool breakdown)
claudetop-engine stats      # All-time (subagents, top tools, projects)
claudetop-engine dashboard  # Live web dashboard at localhost:8080
The live dashboard features an activity heatmap, cost-by-model charts, project and tool breakdowns, subagent cost attribution, and a sortable session table — all with model filtering and time range selection. Auto-refreshes every 30 seconds.
Zero dependencies — uses only Python 3 standard library (sqlite3, http.server, json).
Session tagging
Track costs per feature, bug, or initiative:
export CLAUDETOP_TAG=auth-refactor
# ... work on auth ...
claudetop-stats tag auth-refactor
# Total cost: $12.40 across 3 sessions
Daily budget
export CLAUDETOP_DAILY_BUDGET=50
Shows budget: $12 left at 80% → OVER BUDGET ($52/$50) when exceeded.
Themes
export CLAUDETOP_THEME=full      # Default: 3-5 lines
export CLAUDETOP_THEME=minimal   # 2 lines
export CLAUDETOP_THEME=compact   # 1 line
iTerm2 integration
Push claudetop data into iTerm2's chrome — tab titles, status bar, and badge watermark:
export CLAUDETOP_ITERM=all           # Enable everything
export CLAUDETOP_ITERM=title         # Tab/window title only
export CLAUDETOP_ITERM=badge         # Watermark overlay only
export CLAUDETOP_ITERM=statusbar     # User variables for status bar
export CLAUDETOP_ITERM=bgcolor       # Background color tint by state
export CLAUDETOP_ITERM=title,badge   # Combine any options
Tab title — Shows project | $4.21 | Opus 4.6 | ctx:38% in your iTerm2 tab. Zero configuration.
Badge — Faint watermark in the terminal background with cost, model, and context at a glance. Great for keeping cost visible while scrolling through output.
Background color — Subtly tints the terminal background based on session state:
| Tint | Meaning |
|---|---|
| Green | Healthy session (low context, under $5) or session ended (idle/waiting) |
| Amber | Caution — cost milestone, compact soon, low cache, spinning |
| Red | Alert — over budget, burn rate spike, $25 mark |
| Default | Normal — no special state, uses your profile's background |
When a session ends, the background stays green so you can see at a glance which terminals are idle vs active. Resets to default when the next session starts clean.
Status bar — Sets iTerm2 user-defined variables that you can display in the status bar (top or bottom of terminal). Configure in iTerm2: Preferences > Profiles > Session > Status Bar > add "Interpolated String" components:
| Variable | Content | Example |
|---|---|---|
\(user.claudetop_cost) |
Session cost | $4.21 |
\(user.claudetop_model) |
Current model | Opus 4.6 |
\(user.claudetop_ctx) |
Context usage | 38% |
\(user.claudetop_project) |
Project name | my-project |
\(user.claudetop_duration) |
Session time | 20m 0s |
\(user.claudetop_cache) |
Cache hit ratio | 66% |
\(user.claudetop_velocity) |
Burn rate | $5.10/hr |
\(user.claudetop_tokens_in) |
Input tokens | 152.3K |
\(user.claudetop_tokens_out) |
Output tokens | 45.2K |
\(user.claudetop_lines) |
Lines changed | +256/-43 |
\(user.claudetop_tag) |
Session tag | #auth-refactor |
No-op on non-iTerm2 terminals — escape sequences are silently ignored.
Context composition
See what's eating your context window:
in:80% out:20% (fresh:15% cwrite:7% cread:76%)
High cread = cache is working well. High fresh = re-reading files every turn.
Plugins
Drop any executable script into ~/.claude/claudetop.d/ — it becomes part of your status line.
Included (enabled by default):
| Plugin | What it shows |
|---|---|
git-branch.sh |
main* (branch + dirty indicator) |
Example plugins (copy to enable):
cp ~/.claude/claudetop.d/_examples/spotify.sh ~/.claude/claudetop.d/
| Plugin | What it shows |
|---|---|
spotify.sh |
♫ Artist - Song (macOS) |
gh-ci-status.sh |
CI ✓ or CI ✗ (GitHub Actions) |
meeting-countdown.sh |
Mtg in 12m: Standup (macOS Calendar) |
ticket-from-branch.sh |
PROJ-123 (from branch name) |
weather.sh |
Current weather (wttr.in) |
news-ticker.sh |
Top HN story |
pomodoro.sh |
Focus timer |
system-load.sh |
CPU load average |
Write your own in 4 lines:
#!/bin/bash
JSON=$(cat)
COST=$(echo "$JSON" | jq -r '.cost.total_cost_usd')
printf "\033[32m\$%s\033[0m" "$COST"
Make it executable, drop it in ~/.claude/claudetop.d/, done.
Dynamic pricing
Pricing updates daily from this repo. When Anthropic changes prices, we update pricing.json and everyone gets the new rates next morning.
Current pricing (Claude 4.6, March 2026):
| Model | Input | Cache Write | Cache Read | Output | Notes |
|---|---|---|---|---|---|
| Opus 4.6 | $5/MTok | $6.25/MTok | $0.50/MTok | $25/MTok | |
| Sonnet 4.6 | $3/MTok | $3.75/MTok | $0.30/MTok | $15/MTok | 2x input / 1.5x output when >200K tokens |
| Haiku 4.5 | $1/MTok | $1.25/MTok | $0.10/MTok | $5/MTok |
Extended thinking tokens are billed at standard output rates. No additional charge.
To update manually: ~/.claude/update-claudetop-pricing.sh
Color coding
Every metric uses traffic-light colors — green means healthy, red means act:
| Metric | Green | Yellow | Red |
|---|---|---|---|
| Cost velocity | <$3/hr | <$8/hr | ≥$8/hr |
| Cache ratio | ≥60% | ≥30% | <30% |
| Efficiency | <$0.01/line | <$0.05/line | ≥$0.05/line |
| Context bar | <50% | 50-80% | ≥80% |
| Time of day | 6am-10pm | — | Magenta after 10pm |
Requirements
- Claude Code with status line support
jq—brew install jq/apt install jqbc— pre-installed on macOS and most Linux
Contributing
Pricing changed? Model added? Open a PR updating pricing.json. Everyone gets the update next morning.
Built a useful plugin? PRs welcome in plugins/examples/.
License
MIT
Reviews (0)
Sign in to leave a review.
Leave a reviewNo results found