costdeck
Health Pass
- License — License: Apache-2.0
- Description — Repository has a description
- Active repo — Last push 0 days ago
- Community trust — 14 GitHub stars
Code Pass
- Code scan — Scanned 12 files during light audit, no dangerous patterns found
Permissions Pass
- Permissions — No dangerous permissions requested
No AI report is available for this listing yet.
Open-source Kubernetes FinOps operator: cost per namespace, team, GPU and LLM token, schedules that scale idle environments and cloud databases to zero, budgets, chargeback and right-sizing with a rollback guard. Helm chart, dashboard, REST API, MCP server.

Kubernetes FinOps operator: see what every namespace costs, and stop paying for idle infrastructure.


Cost Deck runs in your cluster. It shows what the cluster, each namespace and each team
cost and waste, including what applications pay LLM APIs and what GPUs and self-hosted
models cost, sets budgets that warn you before the month runs over, and scales
non-production environments to zero when nobody needs them, then brings them back on
time. It advises on requests and node shapes and, if you allow it, applies the advice
with a guard that puts it back, or opens a pull request with it. There is no external
service: one operator in your cluster does it all.
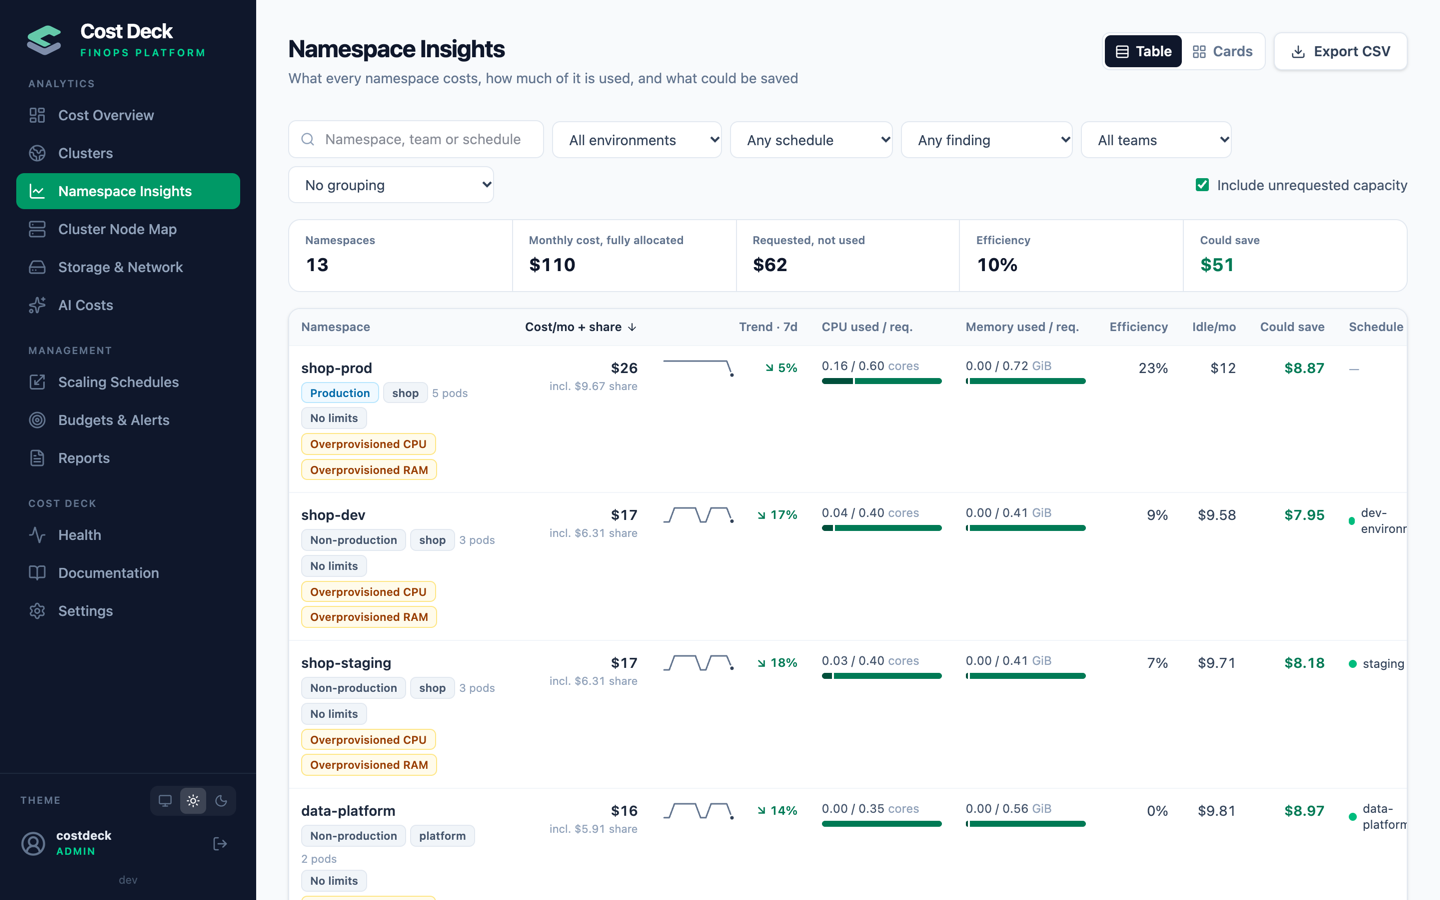 Namespace Insights: cost, usage, trend and what could be saved, per namespace |
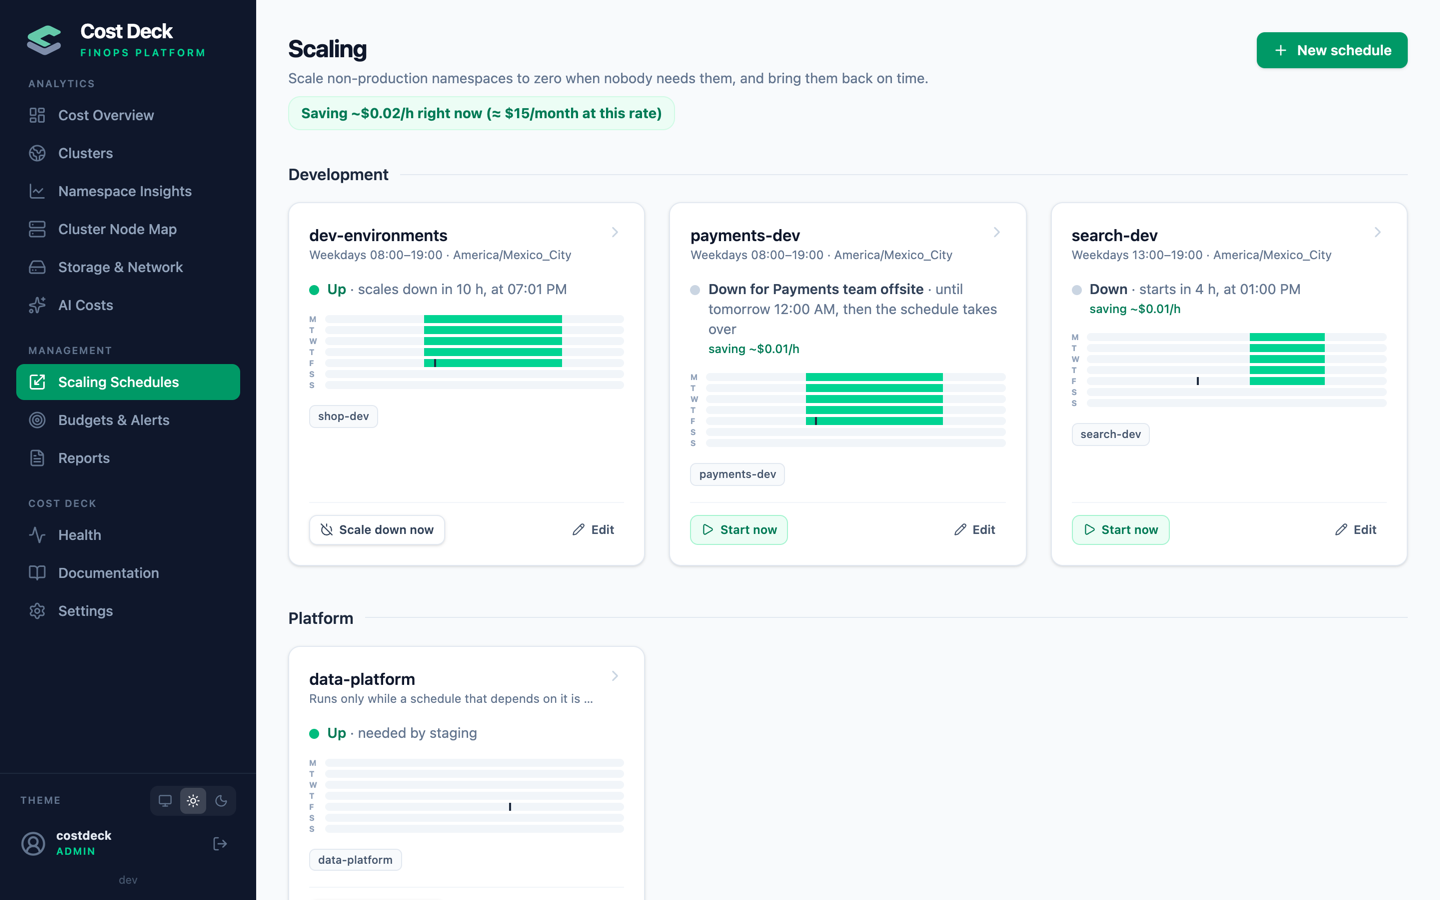 Scaling Schedules: working hours, platforms on demand, holidays and exceptions |
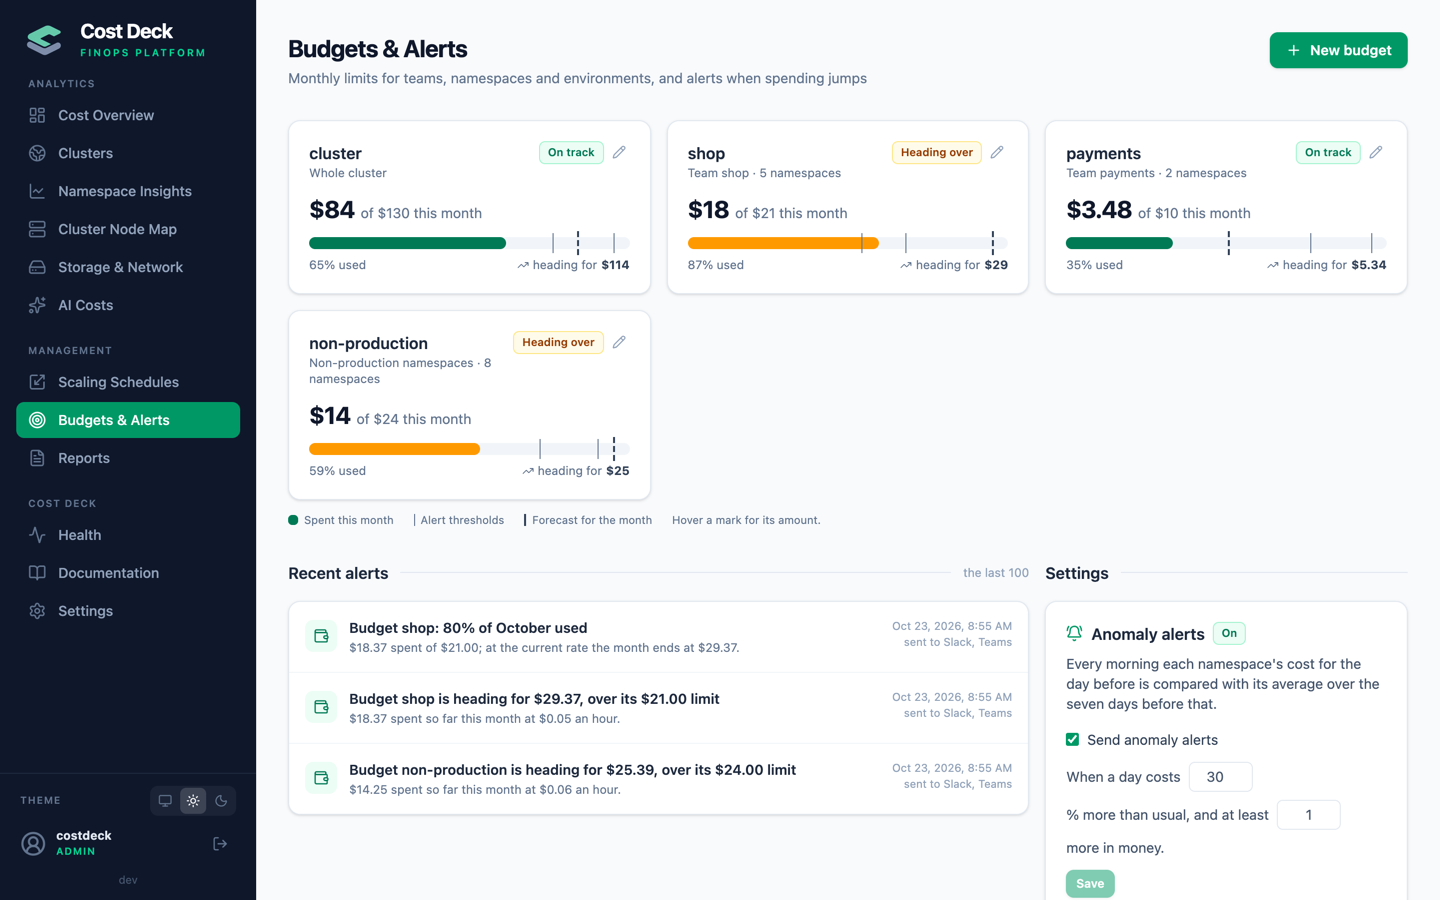 Budgets & Alerts: monthly limits, forecasts and alerts sent to Slack and Teams |
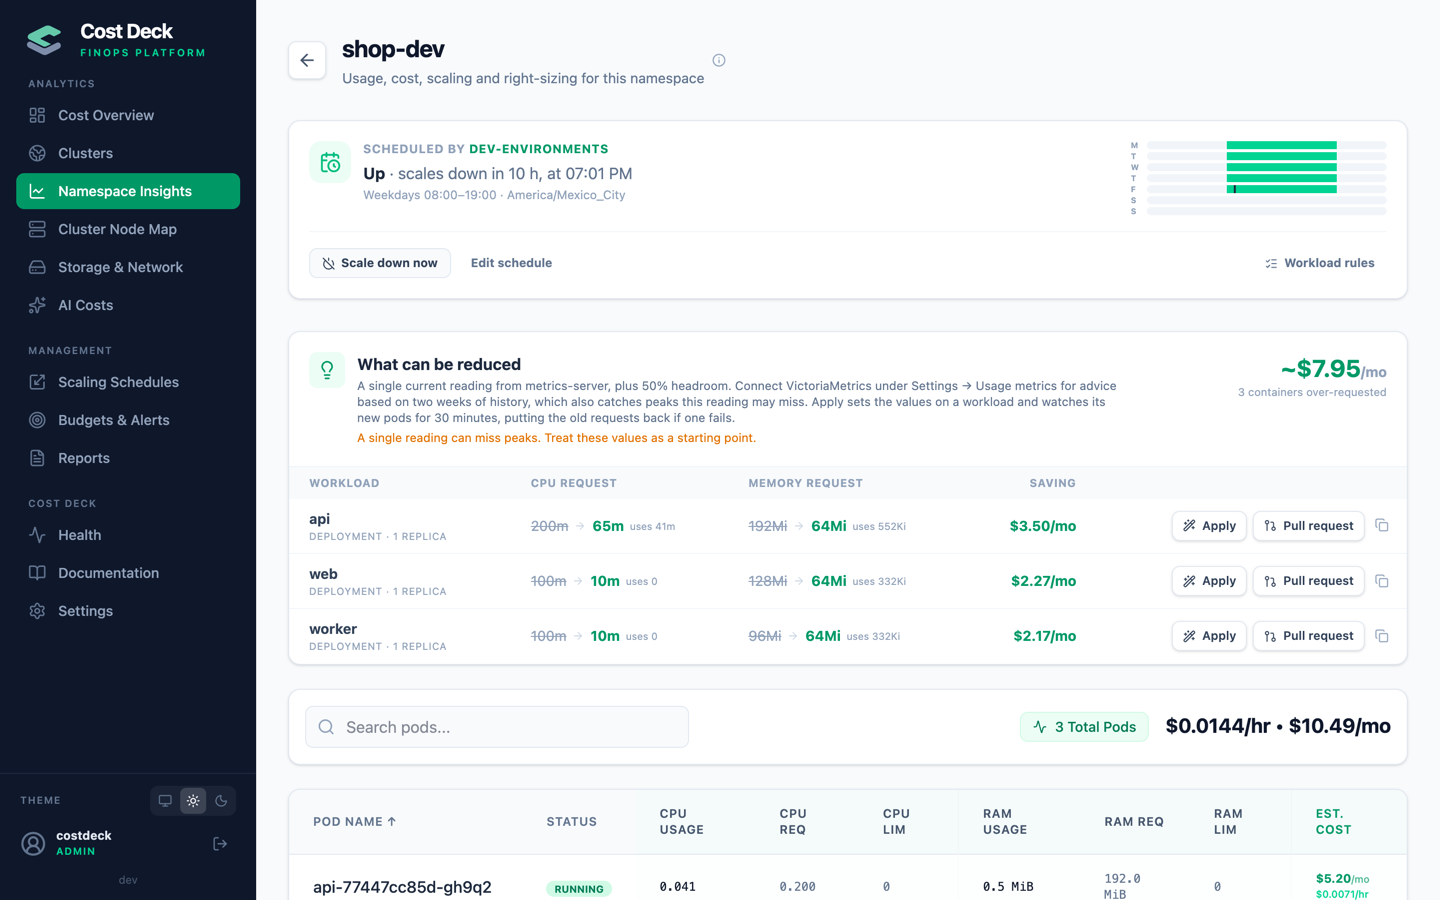 Right-sizing: what each workload could request, applied with a guard or as a pull request |
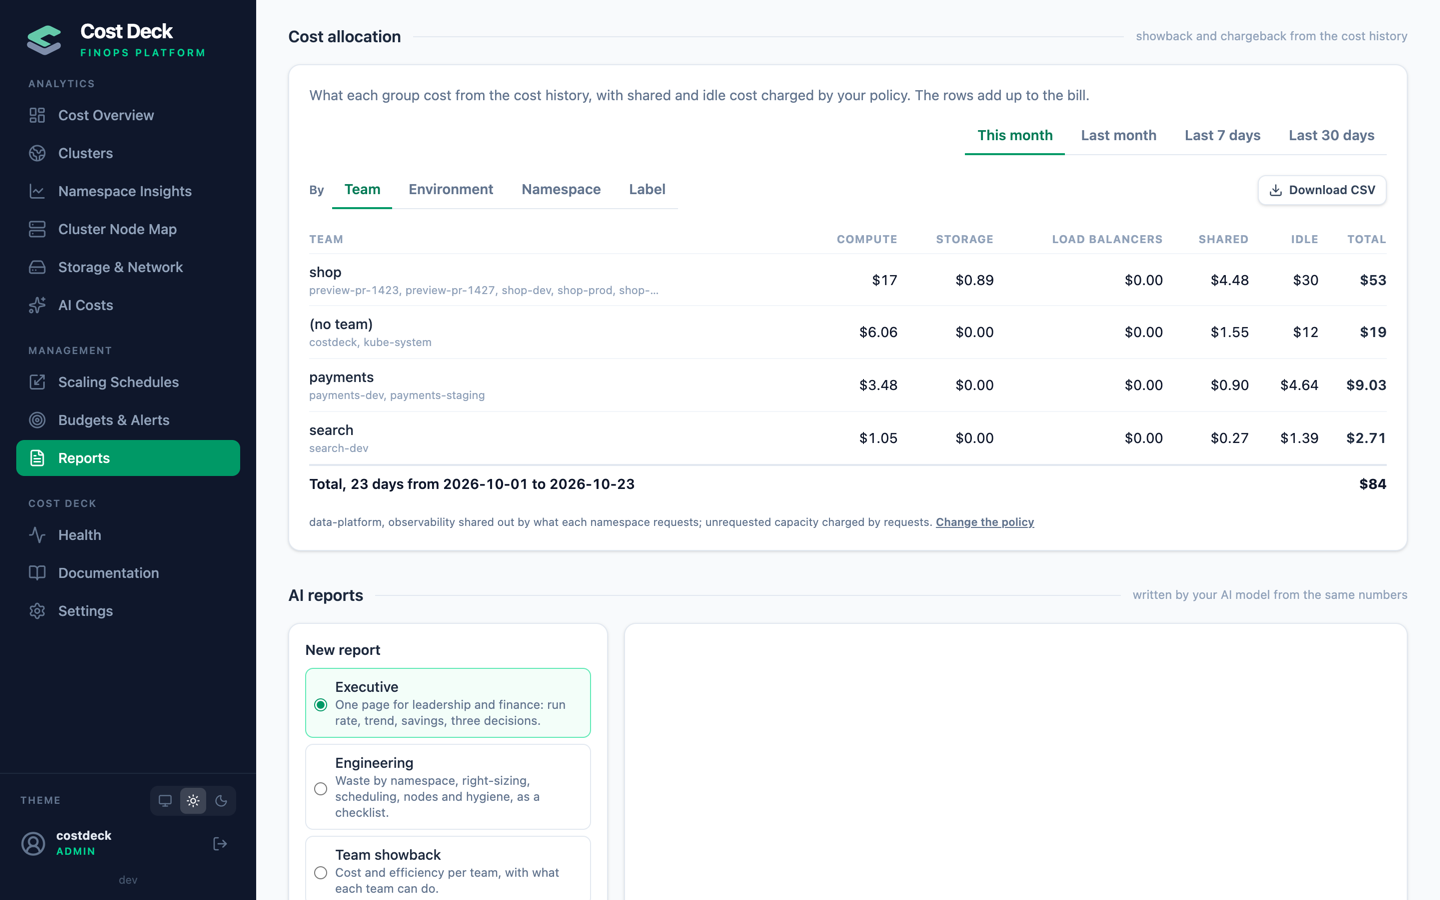 Cost allocation: a period's cost by team with shared and idle cost, as CSV |
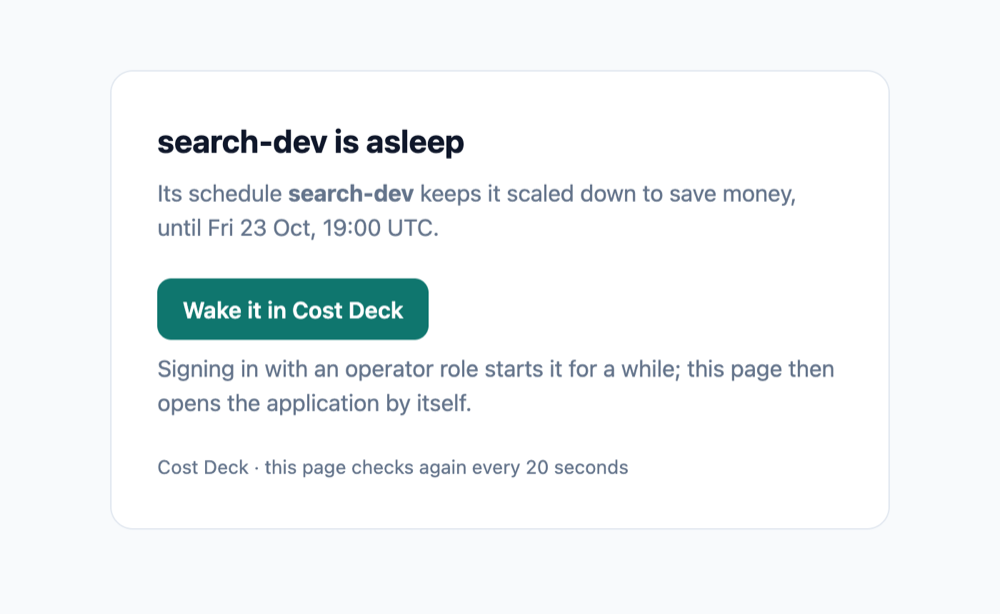 Sleep page: what people see on a scaled-down environment, with a way to wake it |
Features
See the cost
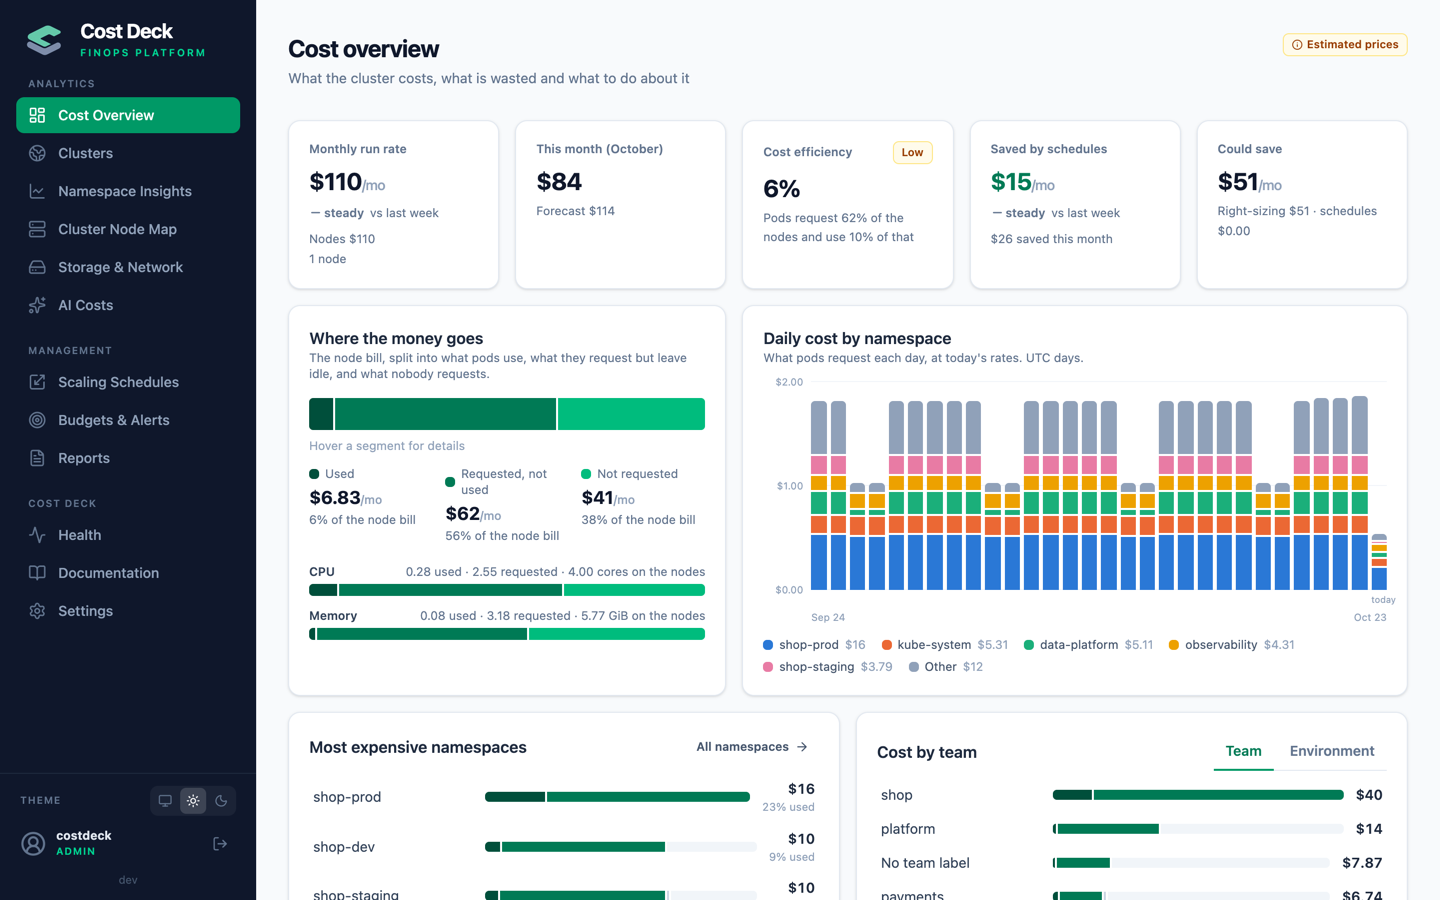
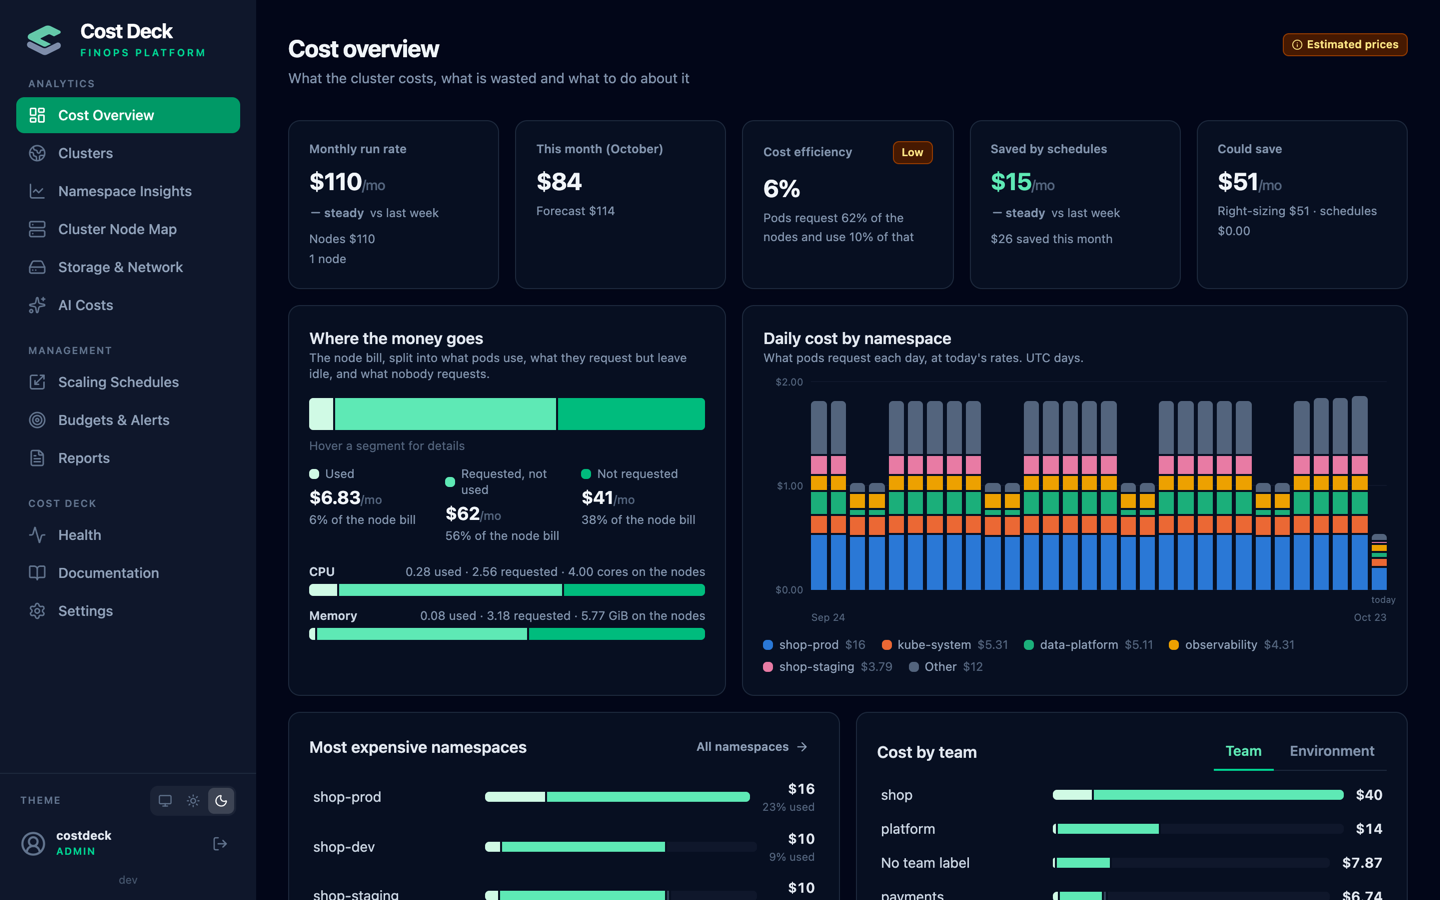
- Cost overview. The node bill split into what pods use, what they request but leave
idle, and what nobody requests; the month to date with a forecast; week-over-week
changes; cost by team and environment; and the savings opportunities, ranked. - Namespace Insights. Every namespace with its cost, usage, efficiency, trend and
findings, filtered by environment, team, schedule or finding, and exported as CSV. - Storage, network and the real bill. Persistent volumes and load balancers are priced
and charged to their namespace, and unused volumes and idle load balancers are found.
Costs can be reconciled with the AWS, Azure or Google Cloud bill, so discounts,
reservations, savings plans and spot prices show in every figure. - Prices you can check. AWS and Azure list prices per instance type, your own rates,
or an estimate in line with cloud list prices. Every figure says which basis it uses. - Several clusters. One installation shows the others side by side, read with a viewer
API token each: cost, savings, this month so far and totals.
AI and GPU costs
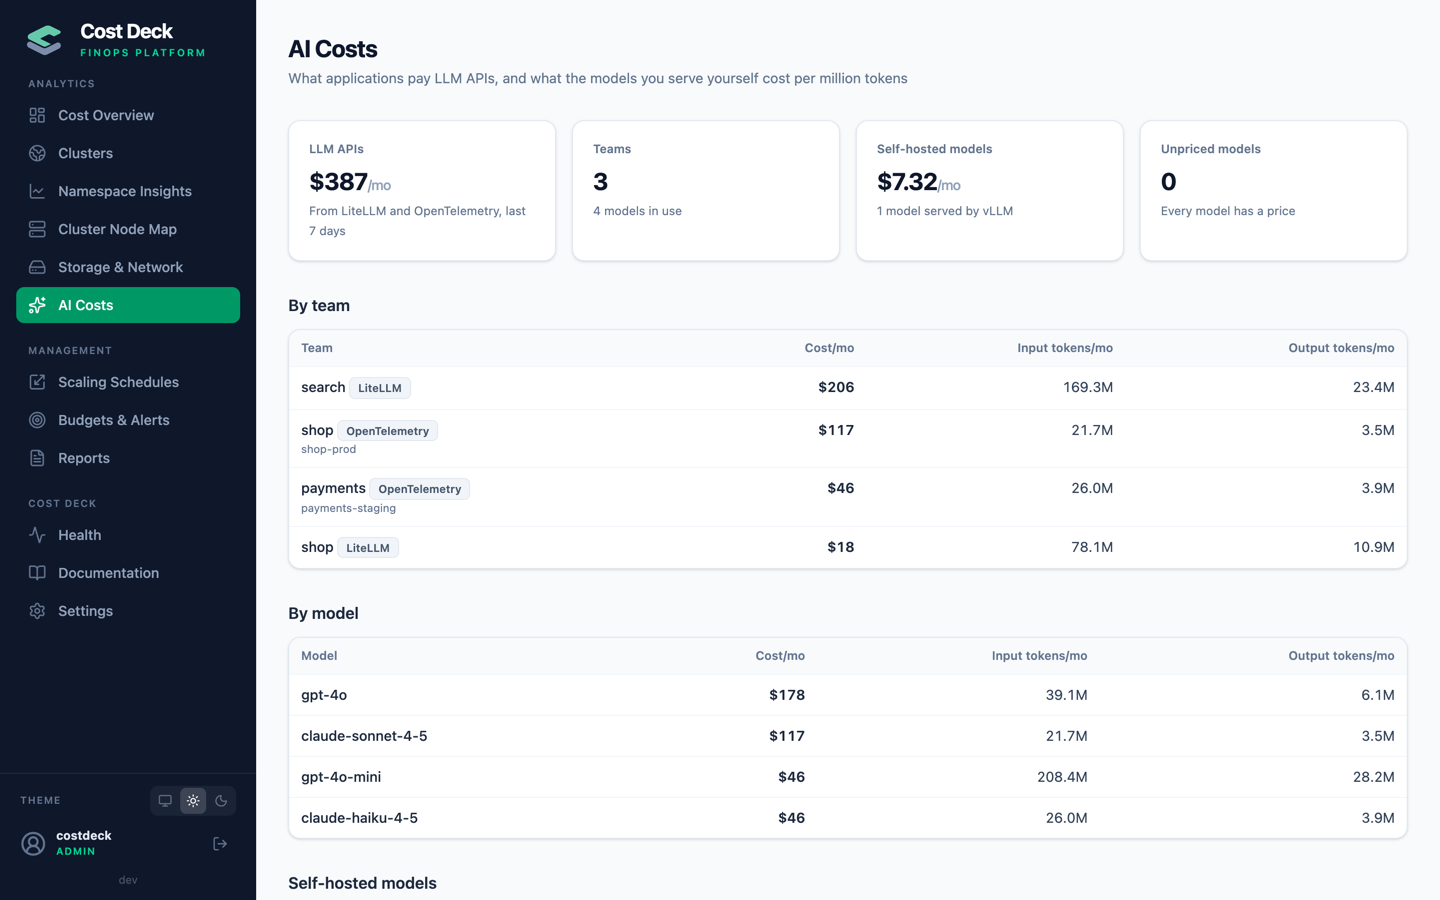
- LLM API spend by team and model. What applications pay OpenAI, Anthropic, Google
and others, read from LiteLLM's spend or from OpenTelemetry GenAI token counts
(gen_ai.client.token.usage) priced at your model prices, with every model that has no
price yet called out. - Self-hosted models. What a model you serve with vLLM costs per million tokens: its
namespace's run rate, GPUs included, divided by the tokens it serves. - GPUs. GPUs are priced apart from CPU and memory (their share of the node's list price,
or an estimate per model) and charged to the namespaces that request them. With NVIDIA's
DCGM exporter in VictoriaMetrics, Cost Deck finds idle GPUs, GPUs workloads could share
through MIG or time-slicing, and cheaper models with enough memory, and a namespace
whose GPUs sit idle can go to sleep. - Asked from anywhere. The assistant and MCP clients get the same numbers
(get_ai_costs,get_gpu_usage), and the assistant's own tokens have a monthly budget.
Scale non-production to zero
- Scaling schedules. Pick namespaces and when they should run: working hours, the work
week non-stop, or any custom windows, in any time zone. Outside those hours workloads go
to zero; their replica counts are restored afterwards. - Shared platforms on demand. A schedule can depend on another one. An on-demand
platform (databases, Kafka, logging) starts only while an environment that needs it is
up, and environments wait until it is fully up. - Schedules suggested from usage. One click reads a week of a namespace's CPU usage and
fills in the hours it is busy, with the saving. - Overrides that end on their own. "Start now" or "Scale down now" holds until the next
scheduled change, or for a time you choose, then the schedule takes over again. - Holidays and release weekends. Dated exceptions and shared holiday calendars keep a
schedule down (or up) on given days without editing its hours. - Namespaces by label. A schedule can take every namespace with a label, so preview
environments join as they are created and leave when the label goes. - Preview and dry run. See what a schedule would stop, when, and what it saves before
saving it, or let it run in a dry run that decides but scales nothing. - Sleep when unused. An environment nobody has sent a request to for an hour (Envoy
Gateway, Istio or ingress-nginx metrics), or whose GPUs sat idle (DCGM), goes down
inside its schedule's hours too. - A sleep page while down. A sleeping environment's Gateway API routes show a page that
says it is asleep and links to waking it for an hour or two, instead of a gateway error. - Everything that runs in a namespace. Deployments, StatefulSets and Argo Rollouts
(canary and blue-green, including those that take their pods from a Deployment); CronJobs
are suspended and KEDA ScaledObjects paused while the namespace is down. CloudNativePG and
Zalando Postgres clusters, Strimzi Kafka Connect, MirrorMaker 2 and Bridge, or any
operator's resource with a replica field, stop after the namespace's workloads and start
before them. - GitOps-aware. Workloads managed by Argo CD or Flux are named in the preview, and a
schedule can pause the tool while it keeps them down and resume it afterwards. - Cloud resources too. Namespaces start stage by stage and stop in reverse, and the
stages can include AWS Aurora and EC2, Azure VMs and PostgreSQL/MySQL flexible servers,
and Google Cloud Compute Engine and Cloud SQL. - Savings that reach the bill. After a scale-down, each schedule shows which nodes the
autoscaler removed and what keeps the others: a PodDisruptionBudget,do-not-disrupt,safe-to-evict: "false", local storage, or other namespaces still using them.
Right-size and clean up
- Right-sizing advice. Which requests can shrink (p95 usage when VictoriaMetrics is
connected), with the saving per workload. Cost Deck never touches nodes. - Applied with a guard, or as a pull request. If you allow it, operators apply the
advice from a namespace's page: the new pods are watched, and the old requests come back
(with an alert) if one is OOMKilled, restarts or crash-loops. Workloads a GitOps tool
manages get a pull request in your GitHub, GitLab or Gitea repository instead, with the
manifest's comments kept. Every change is listed with who made it. - Node advice. Per node pool, the instance type and count that fit the requests, arm64
alternatives and spot capacity for non-production workloads. - Cost in pull requests. A GitHub Action (or the image in any CI) comments on a pull
request with what its manifests change will cost a month, at your cluster's rates and
schedules, and can fail the check above a limit. - Preview cleanup. Namespaces of preview environments are deleted some time after
they were created, with a warning first, a dry run and a way to keep one longer. Off
unless you turn it on, twice: in the chart and in the settings.
Budgets and reports
- Budgets and alerts. Monthly budgets per cluster, team, environment or any set of
namespaces, alerting at thresholds and when the month is heading over, and daily cost
anomaly alerts. - Showback and chargeback. A period's cost by team, environment, namespace or any label
such ascost-center, with shared namespaces and idle capacity charged by your policy,
adding up to the bill, as a table and a CSV for finance. - Digests and AI reports. A weekly or monthly cost digest, and reports for leadership,
engineers and teams written by your AI model from the same numbers.
Fits your team
- Access. Local users with viewer, operator and admin roles, single sign-on with
Microsoft Entra ID, Keycloak or any OpenID Connect provider with group-to-role mapping,
API tokens, and least-privilege RBAC: Secrets are only read in the operator's own
namespace. Applying right-sizing advice and deleting preview namespaces are off until
an admin turns them on. - Where you already work. Alerts, digests and scaling changes in Slack, Microsoft
Teams, email and Webex, a Webex bot, an AI assistant (Claude, OpenAI-compatible or
Gemini) that proposes actions for you to confirm, an MCP server for AI clients, and
Prometheus metrics. - A dashboard to share. Every page has its own address, a light and a dark theme, and
every setting is in one place.
Quick start
helm upgrade --install costdeck-operator \
  oci://ghcr.io/migalsp/costdeck/charts/costdeck-operator \
  --version <version> --namespace costdeck --create-namespace

kubectl get secret costdeck-operator-admin-credentials -n costdeck \
  -o jsonpath='{.data.password}' | base64 -d; echo
kubectl port-forward -n costdeck svc/costdeck-operator-api 8082:8082
Open http://localhost:8082 and sign in as costdeck. Pick the latest version from
the releases. The
installation guide covers Ingress, SSO, cloud accounts, monitoring
and every chart value.
Documentation
- In the dashboard: the Documentation page has step-by-step guides (schedules,
cloud resources, cost and savings, nodes, storage and network, budgets, reports, access
and sign-in, the AI assistant, MCP clients, Slack, Teams and email, Webex, monitoring
Cost Deck, troubleshooting) and a REST API reference generated from the live OpenAPI
document. - Installation guide: chart values, Ingress, single sign-on,
cloud permissions, monitoring, upgrades. - API: Swagger UI at
/api/docs, the specification at/api/openapi.yamland/api/openapi.json. Every operation names the role it needs.
How it fits together
graph TD
    subgraph Clients
        UI[Dashboard]
        AI[AI clients via MCP]
        CHAT[Slack, Teams, email, Webex]
        CI[CI: cost estimate]
        PR[Prometheus]
    end

    subgraph Operator["Cost Deck operator (one binary)"]
        API[REST API, sign-in, MCP, sleep page]
        CTRL[Controllers: schedules, dependencies, discovery, usage, idle]
        FIN[FinOps: cost ledger, budgets, allocation, digests, bill reconciliation]
        OPT[Right-sizing guard, preview cleanup]
        NOTIFY[Notifications, Webex bot]
        MET[metrics endpoint]
    end

    subgraph Cluster["Kubernetes"]
        CRD[CRDs: ScalingGroup, ScalingConfig, NamespaceFinOps, CostDeckConfig]
        WL[Deployments, StatefulSets, Argo Rollouts, CronJobs, KEDA, operator-run databases]
        GW[Gateway API routes]
        INF[Nodes, volumes, load balancers]
        MS[metrics-server]
    end

    subgraph External
        VM[VictoriaMetrics]
        CLOUD[AWS, Azure, Google Cloud: resources, prices, bill]
        GIT[GitHub, GitLab, Gitea]
        LLM[AI provider]
        SSO[Entra ID, Keycloak, OpenID Connect]
        OTHER[Other Cost Deck clusters]
    end

    UI --> API
    AI --> API
    CI --> API
    CHAT <--> NOTIFY
    PR --> MET
    API --> CRD
    API --> OTHER
    CTRL --> CRD
    CTRL --> WL
    CTRL --> GW
    CTRL --> MS
    CTRL --> VM
    CTRL --> CLOUD
    CTRL --> NOTIFY
    FIN --> INF
    FIN --> CLOUD
    FIN --> NOTIFY
    OPT --> WL
    API --> GIT
    OPT --> NOTIFY
    API --> LLM
    API --> SSO
Development
make test        # unit and envtest tests
make lint        # golangci-lint
make ui-lint     # TypeScript and ESLint
make ui-test     # dashboard unit and component tests (Vitest)
make ui build    # dashboard + manager binary with the dashboard embedded
make test-e2e    # Kind cluster + Helm install + the regression scenarios in hack/e2e
The end-to-end suite runs in CI on every pull request. Every scenario in hack/e2e
covers behaviour users depend on, against real pods and real dependencies: scheduling,
dependencies, stage timeouts, workload rules, holiday exceptions, namespace selectors,
preview and dry run, GitOps pausing, operator-run services, realized savings, GPUs, AI
costs, auth with Keycloak, the API, VictoriaMetrics history, MCP, the sleep page, sleep
when unused, Slack, Teams and email, Argo Rollouts, preview cleanup, cost allocation,
several clusters, cost estimates, and right-sizing applied, guarded and proposed in a
real Gitea. A change that breaks one fails the build. A feature or fix that changes
behaviour adds or extends a scenario. To run it against an existing test cluster instead
of a new Kind cluster:
SKIP_INSTALL=1 ./hack/e2e-smoke.sh                 # skips the settings-changing scenarios
SKIP_INSTALL=1 DISPOSABLE=1 E2E_ONLY='30|40' ./hack/e2e-smoke.sh
SKIP_INSTALL=1 DISPOSABLE=1 E2E_PART=2/3 ./hack/e2e-smoke.sh   # one of the three parts CI runs
Pull requests run the suite in three parts at once, each in its own Kind cluster on
Kubernetes 1.35; hack/e2e/durations.txt keeps the parts the same length, and a new
scenario joins one by itself. Every night the whole suite runs in order on Kubernetes 1.31
and 1.37. The pull request check to require is CI result, which fails when any job of
the run fails: Go, UI, Helm, the install bundle, known vulnerabilities, dependency review,
conventional commit messages, zizmor on the workflows, shellcheck, the image scan and the
end-to-end parts.
Schedule windows, the next schedule change, holiday exceptions and cost estimates also
have Go fuzz tests. go test runs their seed inputs, and every night each one is fuzzed
for ten minutes; a failing input is kept as a workflow artifact, to be copied intotestdata/fuzz as a regression test. To fuzz one locally:
go test ./internal/scaling -run '^$' -fuzz '^FuzzScheduleWindow$' -fuzztime 1m
License
Reviews (0)
Sign in to leave a review.
Leave a reviewNo results found