agentwatch
Health Warn
- License — License: MIT
- Description — Repository has a description
- Active repo — Last push 0 days ago
- Low visibility — Only 5 GitHub stars
Code Fail
- rm -rf — Recursive force deletion command in docs/demo-mock/setup.py
- rm -rf — Recursive force deletion command in src/adapters/claude-code.test.ts
- os.homedir — User home directory access in src/adapters/codex.ts
- process.env — Environment variable access in src/adapters/detect.ts
- process.env — Environment variable access in src/adapters/fs-watcher.ts
Permissions Pass
- Permissions — No dangerous permissions requested
This tool provides local-only observability for multiple AI coding agents running on your machine. It unifies event streams from various CLI and IDE agents into a single timeline with a terminal UI and browser dashboard for monitoring, cost tracking, and policy management.
Security Assessment
Overall Risk: Medium. The tool naturally requires access to sensitive areas to function—specifically, it reads user home directory paths (via `os.homedir`) and environment variables to locate and monitor various agent log files. The scan flags `rm -rf` commands, but these appear in a mock demo setup file and test scripts rather than production code, which is an expected testing practice. It does not request dangerous system permissions, and the architecture explicitly promises no network telemetry or cloud connections, keeping all data strictly on localhost. No hardcoded secrets were identified.
Quality Assessment
The project is very new and has low community visibility with only 5 GitHub stars, meaning it has not yet been widely battle-tested by a large audience. However, it shows strong active maintenance indicators, with repository updates pushed as recently as today. It is properly licensed under the permissive and standard MIT license.
Verdict
Use with caution—its architecture is solid and appropriately localized, but its low community adoption means you should review its codebase before fully trusting it with your local agent data.
Local-only observability for AI agents on your machine. One timeline across coding and non-coding agents.
agentwatch
Local observability + control plane for every AI coding agent on your machine.
A terminal live-tail and a browser dashboard — one process, one event
stream, served from localhost. Unified timeline across Claude Code,
Codex, Gemini CLI, Cursor, Hermes, and OpenClaw. Token + cost accounting,
compaction + anomaly detection, hybrid search, SVG call graphs,
monaco-style diff attribution, agent-aware replay ("what would the agent
say if I edited the prompt?"), policy editor, MCP server agents can query
their own history from, and an OpenTelemetry exporter with gen_ai.*
semantic conventions. All local. No cloud. No telemetry. No sign-in.

![]()
![]()
![]()
The TUI is the live tail. The web UI is where you drill in — projects,
sessions, token charts, compaction sparklines, SVG call graphs, diff
attribution, replay, anomaly triage, policy editing. Both run in one
process. Press w in the TUI to open the browser.
Table of contents
- Why this exists
- Install
- First 60 seconds
- Agent coverage
- Features
- Keyboard reference
- Configuration
- What agentwatch reads
- MCP server mode
- OpenTelemetry exporter
- How it compares
- Limitations
- Non-goals
- Architecture
- Development
- Security
- License
Why this exists
You run three AI coding agents on one laptop. Claude Code in a terminal,
Codex alongside it, Cursor as your IDE, maybe Gemini CLI for a quick
review, maybe an OpenClaw sub-agent churning on a long task. Every one of
them has its own log file, its own permission model, its own idea of what
a "session" is. None of them tells you what the others are doing.
When something goes wrong — a file rewritten unexpectedly, a spend spike,
an rm you don't remember running — you're piecing it together from five
JSONLs and guessing.
claude-devtools does this
well for Claude Code. agentwatch does it for the whole multi-agent
stack, in the terminal, with zero infrastructure and zero network.
Why this over claude-devtools if you run multiple agents?
Short, factual diff. claude-devtools is a great tool for Claude-only
workflows — if you only use Claude Code, it's probably the better pick.
agentwatch is the answer when you run more than one agent on the same
machine and want one timeline + one cost ledger + one alerting surface
across all of them.
| What | claude-devtools | agentwatch |
|---|---|---|
| Claude Code coverage | ✅ full | ✅ full |
| Codex coverage | ❌ | ✅ tokens + tools + cost + compaction |
| Gemini CLI coverage | ❌ | ✅ tokens + tools + cost |
| OpenClaw coverage | ❌ | ✅ tokens + cost |
| Hermes Agent coverage | ❌ | ✅ tokens + tools + cost (SQLite) |
| Cursor coverage | ❌ | 🟡 config level |
| Per-agent budget alarms | ❌ | ✅ session + daily caps |
| Statistical anomaly detection (loops / spikes) | rule-based only | ✅ MAD z-score + period-1-to-4 loops |
OpenTelemetry exporter (gen_ai.*) |
❌ | ✅ Jaeger / Tempo / Grafana ready |
| MCP server — agents query their own history | ❌ | ✅ 5 tools over stdio |
| User-defined regex/threshold triggers | ❌ | ✅ live-reloaded |
| Install | Homebrew / Electron ~150 MB | npm i -g · 220 KB · TUI |
| Data boundary | local | local |
If "every agent on one pane of glass + programmatic access via MCP +
pipeline-friendly OTel" matches your setup, agentwatch is the tool.
If you're Claude-only and want the Electron polish, claude-devtools
is still excellent.
Install
npm i -g @misha_misha/agentwatch
agentwatch
Requires:
- Node ≥ 20 (tested on 20 + 22 in CI)
- macOS or Linux (Windows intentionally out of scope for v0.x)
Published under the @misha_misha npm scope — the unscoped agentwatch
name was already taken by a CyberArk tool. The installed binary on your$PATH is simply agentwatch.
First 60 seconds
agentwatch doctor   # detects installed agents + readiness
agentwatch          # TUI live-tail + web UI at http://127.0.0.1:3456
agentwatch serve    # web UI only (remote boxes / server cron)
agentwatch mcp      # runs the MCP stdio server (for agents, not humans)
agentwatch --help
Flags:
--no-web— TUI only, don't start the web server--port <n>/--host <addr>— override web server bindAGENTWATCH_PORT=… AGENTWATCH_HOST=…— env equivalents
doctor output looks like:
workspace: /Users/you/IdeaProjects

agents:
  ● Claude Code        installed (events captured)
  ● Codex              installed (events captured)
  ● Gemini CLI         installed (events captured)
  ● Hermes Agent       installed (events captured)
  ● Cursor             installed (config-level only)
  ● OpenClaw           installed (events captured)
  ○ Aider              not detected
  ○ Cline (VS Code)    not detected
Launch agentwatch and every event your agents emit streams in. The TUI
shows a live tail; the web UI at http://127.0.0.1:3456 is where you
drill in — projects, sessions, token charts, SVG call graphs, diff
attribution, prompt replay, trends. Press w in the TUI to open it.
Web UI map
| Route | What it is |
|---|---|
/ |
Live timeline (SSE-streamed) with agent + type filters |
/projects |
Grid of detected projects + cost + session counts |
/projects/:name |
Sessions table for one project |
/sessions/:id |
Chronological event list · export .md / .json |
/sessions/:id/tokens |
Stacked-area token chart per turn |
/sessions/:id/compaction |
Context fill % over time + compaction markers |
/sessions/:id/graph |
Call graph (d3-hierarchy SVG) — click nodes to drill |
/sessions/:id/diffs |
Writes paired with the prompt that triggered them |
/sessions/:id/replay |
Edit prompt → re-run the agent in single-turn exec |
/search |
Unified search (live / cross / semantic) |
/agents |
Grid of every supported agent + install status |
/permissions |
Per-agent permission config |
/cron |
OpenClaw cron jobs + heartbeats |
/trends |
Cost, cache-hit ratio, events per agent (30d default) |
/settings/{budgets,anomaly,triggers} |
Form editors for ~/.agentwatch/*.json |
⌘K / Ctrl+K opens the command palette./ focuses the timeline filter.
Agent coverage
What actually works per agent, as of v0.0.3. Features not listed here
work across every agent (timeline, export, syntax highlighting, notifications,
triggers, search, stale detection, clipboard yank).
| Feature | Claude Code | Codex | Gemini CLI | Cursor | OpenClaw | Hermes |
|---|---|---|---|---|---|---|
| Live events on timeline | ✅ | ✅ | ✅ | 🟡 | ✅ | ✅ |
| Token usage + cost | ✅ | ✅ | ✅ | ❌ | ✅ | ✅ |
| Tool call + result pairing | ✅ | ✅ | ✅ | ❌ | 🟡 | ✅ |
| Per-turn token attribution | ✅ | ✅ | ✅ | ❌ | ✅ | ✅ |
| Budget alarms (session + day) | ✅ | ✅ | ✅ | ❌ | ✅ | ✅ |
| Anomaly detection (cost/loops) | ✅ | ✅ | ✅ | 🟡 | ✅ | ✅ |
| Compaction visualizer | ✅ | ✅ | ❌ | — | ❌ | ❌ |
| Permissions view | ✅ | ✅ | ✅ | ✅ | ✅ | — |
| Cross-session search | ✅ | ✅ | ✅ | ❌ | ❌ | 🟡 |
| Subagent drilldown | ✅ | — | 🟡 | — | 🟡 | 🟡 |
| Replay (agent-aware exec) | ✅ | ✅ | ✅ | ❌ | ❌ | ✅ |
| Agent memory file overhead | CLAUDE.md |
AGENTS.md |
GEMINI.md |
.cursorrules |
OPENCLAW.md |
SOUL.md |
| OTel span coverage | ✅ | ✅ | ✅ | 🟡 | ✅ | 🟡 |
| MCP server exposes history | ✅ | ✅ | ✅ (raw) | ❌ | ❌ | ❌ |
- Cursor exposes config state (MCP servers,
.cursorrules, approval
mode, sandbox) but its actual AI activity lives in a SQLite database we
haven't parsed yet. A thin read-only adapter is a follow-up. - Gemini CLI doesn't persist context-compaction markers to disk, so
compaction detection is Claude + Codex only. - OpenClaw doesn't persist tool_result content or compaction markers
to its JSONL — structural limit of what's on disk, not an adapter gap. - Hermes Agent (by
Nous Research — the OpenClaw successor with a closed learning loop)
persists sessions to~/.hermes/state.db(SQLite + FTS5). The adapter
polls the DB over chokidar + 2s safety-net and emits the full
session/prompt/response/tool-call stream. Replay re-runs single turns
viahermes chat -q <prompt> -Q --max-turns 1.
Features
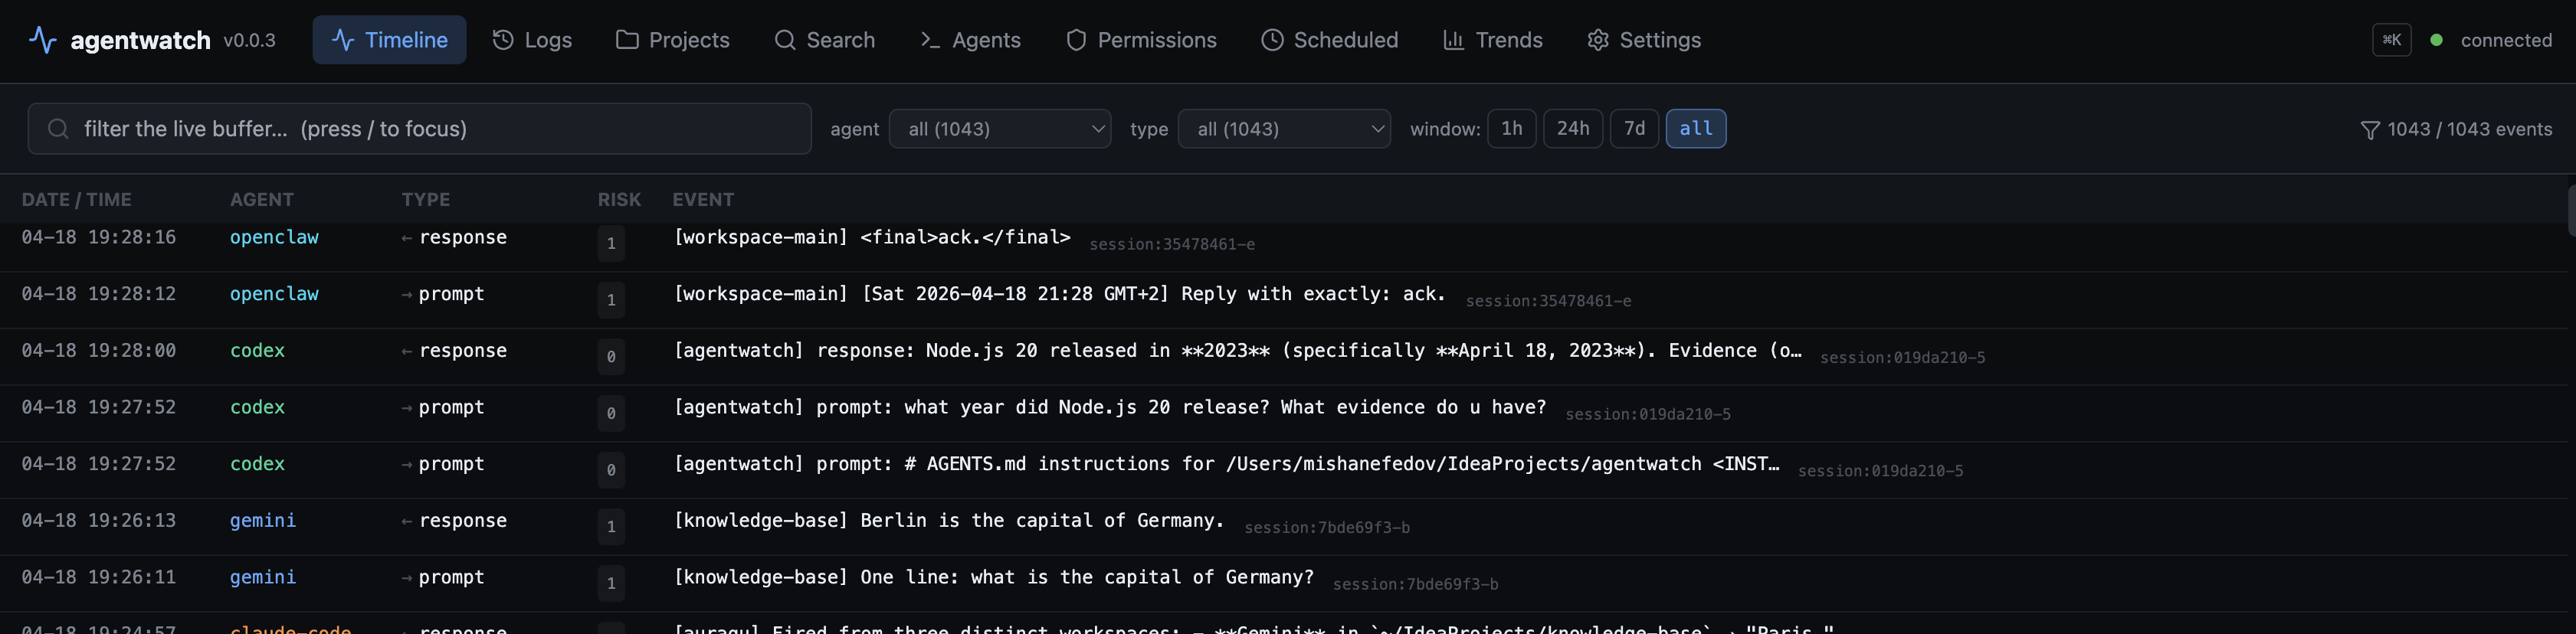
Live multi-agent timeline
Main screen. Every event your agents emit, ordered by event timestamp (not
arrival order, so backfill from different sessions merges correctly).
Columns: time · agent · type · [project] summary · duration · error.
09:54:01  openclaw     response       [content_agent] <think> Checked the KB…
09:52:53  claude-code  response       [auraqu] Commit bddc363. q now exits instantly…
09:52:48  codex        shell_exec     [dataset_research] ls -la · 12ms
09:52:43  claude-code  tool_call      [auraqu] Edit: src/ui/App.tsx · 7ms
09:51:51  gemini       file_write     [landing] write_file: public/llms.txt
09:51:51  claude-code  tool_call      [auraqu] Agent: Competitive landscape ▸ 52 child events
Rows with an anomaly fire a red ◎ prefix on the type column.
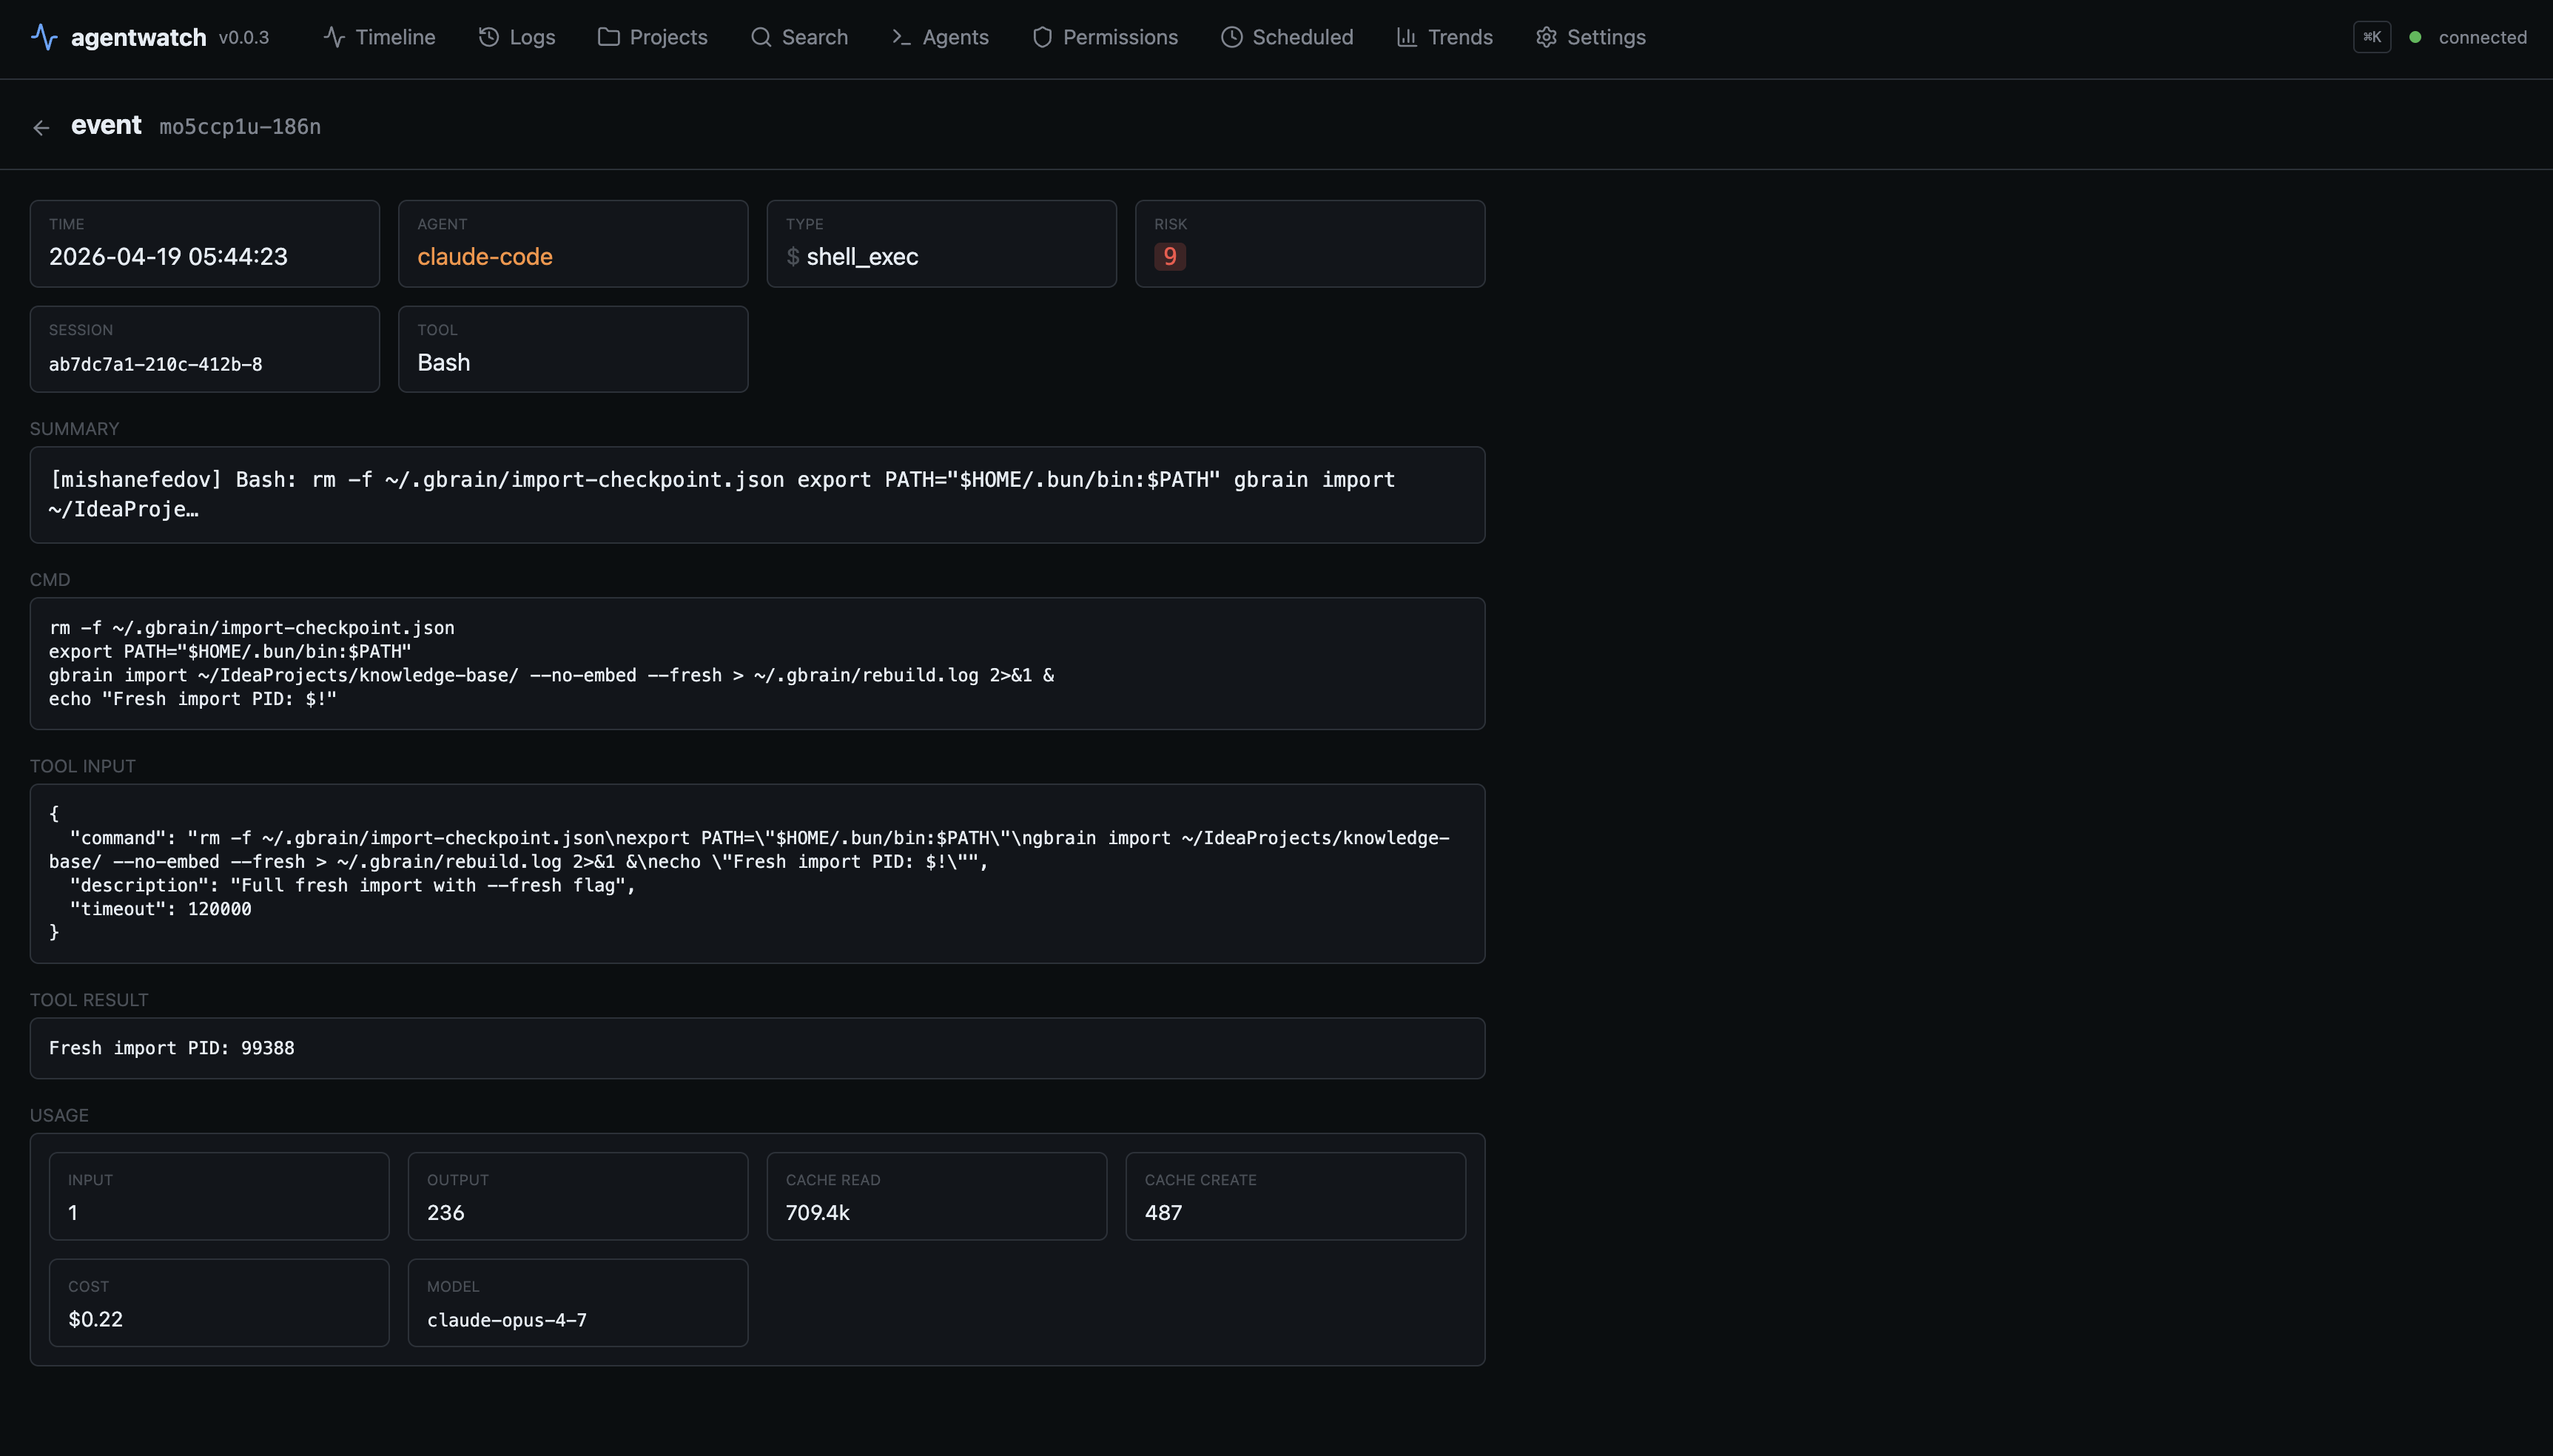
Event detail pane
Press Enter on any row. Opens a full-screen pane with:
- Metadata (time, agent, type, tool, path, cmd)
- Tokens / cost / duration (
in=6 cache_create=25508 cache_read=16827 out=353·$0.08 (claude-opus-4-6)·151ms) - Tool result — stdout for Bash, file content for Read/Write, search matches for Grep — with syntax highlighting inferred from the tool + file extension
- Full prompt or response text
- Extended thinking block when present
- Tool input JSON
Scrollable with ↑↓ or j/k. esc closes.
Subagent drilldown
Parent Agent tool_use events show ▸ 52 child events. Press x to
scope the timeline to only that subagent's inner tool calls. X unscopes.
Applies to Claude Code (Task tool) and partially to OpenClaw (per-agent
delegation) and Gemini (subagent sessions).
Project + session navigation
P → projects grid (one workspace per row, across all agents)
     ↓ enter → sessions list (grouped Today / Yesterday / 7d / Older)
             ↓ enter → scoped timeline
Projects grid aggregates across agents: per-agent session counts, total
cost, last activity. esc walks back one level.
Cross-session search (?)
Press ? — fuzzy-substring search across every session file on disk
(~/.claude, ~/.codex, ~/.gemini). Uses ripgrep if installed, falls
back to a native scan. Enter on a hit scopes the timeline to that session.
Different from in-buffer search:
/— search the 500-event live buffer?— search every session file ever written
Per-session cost with cache accounting
Naive token counters are 3–10× wrong on Claude because cache_read is
billed at 10% of input and cache_creation at 125%. agentwatch ships a
per-model rate table (Claude opus/sonnet/haiku, GPT-5 / GPT-5-mini,
Gemini 2.5 Pro/Flash) and computes true USD cost per turn. Cost shows:
- Per-agent total in the side panel
- Per-event in the detail pane
- Per-session in the sessions list
- Aggregate in the session's token attribution view (
[t])
Per-turn token attribution ([t])
Inside a scoped session, press t. Stacked bar per turn showing:
user— the preceding prompt (tokenized withgpt-tokenizer)memory file— CLAUDE.md / AGENTS.md / GEMINI.md / .cursorrules / etc., read from the session's cwdtool I/O— tool_input JSON + tool_result textthinking— extended thinking blockinput (fresh)/cache read/cache create/output— exact from the model's own usage record
Compaction visualizer ([C])
Inside a scoped session, press C. Horizontal bar of context fill %
across turns, with ⋈ markers where the agent auto-compacted. Selected
compaction shows before / after token counts and the dropped-token delta.
Works on Claude Code (via isCompactSummary) and Codex (viaevent_msg/turn_truncated).
Budget alarms
~/.agentwatch/budgets.json:
{ "perSessionUsd": 5, "perDayUsd": 20 }
Red banner in the Header when either cap is crossed; OS notification
fires once per crossing. No kill switch — we don't control agents; we
just shout.
Anomaly detection
Three detectors, all fully local, all running on the 500-event buffer:
- MAD z-score outliers on cost, duration, and input tokens per agent
(|z| > 3.5by default — tune in~/.agentwatch/anomaly.json) - Stuck-loop detector with periods 1–4 — catches
A-A-A-…andA-B-A-B-…"apologize and retry" loops - Per-session rollup + OS notification on first flag + timeline
◎marker[D]to dismiss the banner
User-defined notification triggers
~/.agentwatch/triggers.json — live-reloaded via chokidar:
[
  { "match": "curl .* \\| (bash|sh)", "title": "pipe-to-shell", "body": "{{agent}}: {{cmd}}" },
  { "type": "file_write", "pathMatch": "^/etc/", "title": "/etc write" },
  { "thresholdUsd": 0.5, "title": "expensive turn", "body": "cost {{cost}}" }
]
Placeholders: {{agent}} {{type}} {{cmd}} {{path}} {{tool}} {{summary}} {{cost}}.
Desktop notifications
Built-in alerts fire on sensitive events — .env access, ~/.ssh /~/.aws / ~/.gnupg paths, rm -rf, sudo, curl | sh, tool errors,
budget breach, anomaly. Rate-limited (60s per rule key). Silent during
backfill.
Platform dispatch: osascript on macOS, notify-send on Linux,
PowerShell MessageBox on Windows. Zero third-party dependencies.
Per-agent permission surface ([p])
Scrollable view showing:
- Claude Code — allow / deny / defaultMode; flagged risks (
Bash(*), missing.sshdenies,auto/bypassmodes in red) - Codex — config.toml projects + trust_level; latest session's sandbox_policy, approval_policy, writable_roots, network_access, model
- Gemini CLI — auth type, selected model, tool allow/block lists, trusted folders
- Cursor — approval mode, sandbox state, MCP servers, discovered
.cursorrules - OpenClaw — default workspace + per-sub-agent (name, emoji, model, workspace)
Session export ([e])
From a session list or scoped timeline, press e. Writes./agentwatch-export/<agent>-<session>-<ts>.md (human-readable transcript
with tool calls as fenced blocks) and .json (raw events). Path copied to
clipboard.
Syntax highlighting in the detail pane
cli-highlight (tiny ANSI highlighter) applies to:
- Tool input JSON
- Tool result when the tool is Bash or the file extension is known (
.ts,.py,.rs,.go, etc.) - Fenced blocks in user/assistant text
Stale-session detection
Sessions and projects idle for > 5 minutes render dimmed with a ⊘ stale
badge. Un-greys on the next event.
Clipboard yank ([y])
Copies the most useful payload (tool result > full text > cmd / path /
summary). Uses pbcopy, wl-copy / xclip / xsel, or clip.
Confirmation flashes at the footer.
Keyboard reference
Press ? anytime to open this inside the TUI.
Navigate
| Key | Action |
|---|---|
↑ ↓ / j k |
move selection in the timeline |
Enter |
open event detail pane |
esc |
close current view / clear selection |
P |
projects grid |
Enter on project |
sessions list for that project |
Enter on session |
scoped timeline for that session |
q / Ctrl-C |
quit |
Filter & scope
| Key | Action |
|---|---|
/ |
in-buffer search (last 500 events) |
? |
cross-session search (every session file on disk) |
f |
cycle agent filter |
a |
toggle agent side panel |
x |
drill selected Agent event into its subagent run |
X |
unscope subagent |
A |
clear project filter |
Z |
clear all filters |
Actions
| Key | Action |
|---|---|
y |
yank selected event content to clipboard |
e |
export current session to .md + .json |
space |
pause / resume live event stream |
c |
clear event buffer |
D |
dismiss the current anomaly banner |
Info overlays (only in a scoped session)
| Key | Action |
|---|---|
t |
per-turn token attribution |
C |
context compaction visualizer |
p |
permissions view (works anywhere) |
Configuration
Four config files, all optional. Loaded on startup; triggers reload live.
| File | Purpose |
|---|---|
~/.agentwatch/triggers.json |
User-defined notification rules (live-reloaded) |
~/.agentwatch/budgets.json |
perSessionUsd / perDayUsd spend caps |
~/.agentwatch/anomaly.json |
zScore, loopWindow, loopMinRepeats, minSamples |
Environment variables:
| Variable | Default | Purpose |
|---|---|---|
WORKSPACE_ROOT |
~/IdeaProjects (fallback) |
Where the generic filesystem watcher looks for edits |
AGENTWATCH_CONTEXT_WINDOW |
200000 |
Tokens per window — used by compaction % calculation |
AGENTWATCH_OTLP_ENDPOINT |
unset | Enables the OTel exporter when set |
NO_COLOR |
unset | Standard honoring: disables ANSI colors if set |
Workspace fallback chain (used when WORKSPACE_ROOT isn't set):~/IdeaProjects → ~/src → ~/code → ~/Projects → ~/dev → $HOME.
What agentwatch reads
Read-only. agentwatch writes to exactly two places: your terminal and the
clipboard (on explicit y) / disk (on explicit e to export).
| Path | What |
|---|---|
~/.claude/projects/**/*.jsonl |
Claude Code session transcripts |
~/.claude/projects/**/subagents/*.jsonl |
Claude Code Task-spawned subagents |
~/.claude/settings.json |
Claude permissions |
~/.codex/sessions/**/rollout-*.jsonl |
Codex session transcripts |
~/.codex/config.toml |
Codex permissions + trust levels |
~/.gemini/tmp/**/chats/*.json |
Gemini CLI transcripts + tool calls |
~/.gemini/settings.json + trustedFolders.json |
Gemini permissions |
~/.openclaw/agents/*/sessions/*.jsonl |
OpenClaw sub-agent sessions |
~/.openclaw/logs/config-audit.jsonl + openclaw.json |
OpenClaw config audit + agent roster |
~/.hermes/state.db (SQLite) |
Hermes Agent sessions + messages |
~/.cursor/{mcp.json, cli-config.json, ide_state.json} |
Cursor config state |
Any .cursorrules / .cursor/rules/*.mdc under WORKSPACE |
Cursor project rules |
{CLAUDE,AGENTS,GEMINI,OPENCLAW}.md + .windsurfrules etc. |
Per-agent memory files for token attribution |
~/.agentwatch/*.json |
User config (triggers / budgets / anomaly) |
$WORKSPACE_ROOT tree |
Filesystem change events |
SECURITY.md carries the authoritative list and details of what is not read.
MCP server mode
Run agentwatch as an MCP server so other agents can query their own
history. Install:
claude mcp add agentwatch -- npx -y @misha_misha/agentwatch mcp
# or edit ~/.claude.json / ~/.cursor/mcp.json manually
Tools exposed:
| Tool | Args | Returns |
|---|---|---|
list_recent_sessions |
limit?: 1-100 |
[{agent, sessionId, project, lastActivity, sizeBytes}] |
get_session_events |
sessionId, maxBytes?: 1K-10M |
Raw JSONL (tail-capped) for that session |
search_sessions |
query, limit?: 1-50 |
[{session, agent, line}] substring hits |
get_tool_usage_stats |
sessionId?, limit?: 1-500 |
Per-tool counts, totalDurationMs, errorCount |
get_session_cost |
sessionId |
{totalCostUsd, turns, tokens, byModel} |
See docs/features/mcp-server.md.
OpenTelemetry exporter
Set AGENTWATCH_OTLP_ENDPOINT=http://localhost:4318/v1/traces to emit
OTLP/HTTP spans for every agent event. Uses the OpenTelemetry GenAI
semantic conventions so any consumer (Jaeger, Tempo, Honeycomb, Grafana)
can interpret the data without custom dashboards.
Attributes emitted:
gen_ai.system(anthropic | openai | google | cursor | …)gen_ai.operation.name(chat | tool_use | context_compaction | …)gen_ai.request.model/gen_ai.response.modelgen_ai.usage.input_tokens/gen_ai.usage.output_tokensgen_ai.tool.name/gen_ai.tool.call.iderror.typeon tool errorsagentwatch.session.id/agentwatch.cost_usdagentwatch.cache_read_tokens/agentwatch.cache_create_tokens/agentwatch.cache_hit_ratioagentwatch.context.fill_pctagentwatch.risk_score
OTel deps are loaded dynamically only when the env var is set — zero
runtime cost when disabled.
How it compares
| agentwatch | claude-devtools | Claudex | ccflare | Langfuse / Phoenix | |
|---|---|---|---|---|---|
| Runs locally only | ✅ | ✅ | ✅ | ✅ | self-host possible |
| Multi-agent | ✅ Claude, Codex, Gemini, Cursor (config), OpenClaw | Claude only | Claude only | Claude only | production LLM apps |
| Real token + cost with cache | ✅ | ✅ | 🟡 | ✅ (proxy-level) | ✅ |
| Per-turn token attribution | ✅ | ✅ | ❌ | ❌ | ❌ |
| Compaction visualizer | ✅ | ✅ | ❌ | ❌ | ❌ |
| Anomaly detection | ✅ MAD + stuck-loop | rule-based only | ❌ | ❌ | ❌ |
| Budget alarms w/ OS notification | ✅ | ❌ | ❌ | ❌ | ❌ |
| User triggers (regex/threshold) | ✅ live-reload | ❌ | ❌ | ❌ | ❌ |
| OTel exporter (gen_ai.*) | ✅ | ❌ | ❌ | ❌ | ✅ (its own format) |
| MCP server (self-query) | ✅ | ❌ | ✅ | ❌ | ❌ |
| Permission surface view | ✅ 5 agents | ❌ | ❌ | ❌ | ❌ |
| Subagent drilldown | ✅ | ✅ | ❌ | ❌ | ✅ (LangChain-specific) |
| Install | npm i -g |
Homebrew / Electron | npm i -g |
Bun repo | Docker + Postgres |
| UI | TUI (Ink) | Electron + standalone | Web UI | Web + TUI | Web |
| Telemetry | none | none | none | none | opt-in |
Three moats are genuinely unique: anomaly detection (statistical, not
rule-based), budget alarms, and OTel with gen_ai. conventions*.
Limitations
- agentwatch is a viewer, not a daemon. It captures events only while
the TUI is running. A background-capture daemon is planned. - Backfill is bounded. On launch we read the last ~4 MB of each
active session file (roughly hundreds of events). For long gaps on
very active sessions, earliest events may fall out of the backfill
window. Keep agentwatch open in a tmux pane for zero gaps. - Cursor activity is config-level only. Cursor's AI activity lives in
a SQLite database we don't parse yet. We capture config changes +.cursorrules+ MCP servers +.cursor/rules/*.mdc. Full activity
parsing is a follow-up. - Gemini and OpenClaw have data-structure gaps. Gemini CLI doesn't
persist compaction markers to disk. OpenClaw doesn't persist
tool_result content or compaction markers. Not fixable from our side. - Windsurf, Aider, Cline are detected but not instrumented yet.
- macOS and Linux only. Windows needs more chokidar + notifier
testing before we promise it. - tokenizer is cl100k_base (gpt-tokenizer), which is ~5% off for
Claude. Exact tokens for input / cache / output come from the model's
own usage record; the ~5% approximation only affects the user /
thinking / tool I/O / memory-file categories in the attribution view.
Non-goals
Hard scope boundaries so agentwatch stays small and maintainable.
- Not cloud. Not SaaS. Not ever.
- Not an agent itself. It watches agents; it doesn't take actions.
- Not production LLM-app tracing. Langfuse owns that.
- Not enterprise compliance. Anthropic's Compliance API covers that.
- Not orchestration. Use Mission Control / Stoneforge for running agents in parallel.
- Not memory. Use claude-mem.
- Not governance / policy enforcement. Use DashClaw / Castra.
Architecture
TypeScript monorepo. Three-layer mental model:
┌─────────────────────────────────────────────────────────────┐
│  TUI layer  (ink / React)                                   │
│    Timeline · EventDetail · Permissions · Projects          │
│    Sessions · Tokens · Compaction · CrossSearch · Header    │
│                                                             │
│  MCP server  (stdio — programmatic, not a UI)               │
│    list_recent_sessions · get_session_events                │
│    search_sessions · get_tool_usage_stats · get_session_cost │
└─────────────────────────▲───────────────────────────────────┘
                          │  EventSink.emit / enrich
┌─────────────────────────┴───────────────────────────────────┐
│  Adapter layer  (one per agent)                             │
│    claude-code · codex · gemini · cursor · openclaw · hermes │
│    fs-watcher (generic)                                     │
└─────────────────────────▲───────────────────────────────────┘
                          │  files read-only
┌─────────────────────────┴───────────────────────────────────┐
│  OS  (log files, config files, clipboard, notifier)         │
└─────────────────────────────────────────────────────────────┘
- Adapters read files, translate raw log lines into canonical
AgentEvents, emit through anEventSink. EventSink.enrich(id, patch)lets an adapter update a previously-emitted event (e.g. when a tool_result arrives late and needs to attach duration + output to the original tool_use).- The TUI is a pure reducer over the event buffer. Filtering, search, scope are derived views — no mutation.
- The MCP server is a peer of the TUI: it reads the same session files on demand, via its own scan (no shared in-memory state with the TUI). This is a known duplication; see Linear for the refactor ticket.
See src/schema.ts for the canonical event shape.
Development
git clone https://github.com/mishanefedov/agentwatch.git
cd agentwatch
npm install
npm run dev           # launch the TUI directly from source (tsx)
npm test              # vitest — 97 tests
npm run typecheck     # strict TypeScript
npm run build         # tsup → dist/
See CONTRIBUTING.md for the contribution workflow.
Docs
docs/features/— feature specs (scope, inputs, outputs, failure modes). Being extended feature-by-feature.docs/testing/— manual test procedures + a pre-release walkthrough.docs/use-cases/— multi-agent triage, cost-overrun investigation, security audit, stuck-loop detection, subagent post-mortem, .env leak alert.
Security
Local-first is a hard invariant.
- Zero network calls unless you explicitly set
AGENTWATCH_OTLP_ENDPOINT(to a host you chose, OTel output only). - Zero telemetry. Not opt-in, not opt-out — simply not there.
- All files read-only except the clipboard (on
y) and./agentwatch-export/(one). - Every path agentwatch reads is documented in SECURITY.md.
Report vulnerabilities privately: [email protected] or via a
Security Advisory.
License
MIT © Misha Nefedov. See LICENSE.
If agentwatch saves you a debugging hour, a ⭐ on the repo makes the effort worth it.
Reviews (0)
Sign in to leave a review.
Leave a reviewNo results found