portlist
Health Pass
- License — License: MIT
- Description — Repository has a description
- Active repo — Last push 0 days ago
- Community trust — 12 GitHub stars
Code Fail
- rm -rf — Recursive force deletion command in docs/install.sh
- rm -rf — Recursive force deletion command in install.sh
Permissions Pass
- Permissions — No dangerous permissions requested
No AI report is available for this listing yet.
Every port on this machine, and where it came from. A terminal program.
portlist
Every port on this machine, and where it came from.
A terminal program, with an optional harbour view in the browser (--world). No dependencies.
Website · Usage · Changelog · Issues · MIT · Buy me a coffee
 PORTLIST  devbox   12 listening  2 off-box  2 need attention              21:20:37
  1 Services(12)  2 Exposed(2)  3 Attention(2)  4 Leftovers(5)  5 Agents(3)  6 Containers(0)  7 Sessions(8)  8 System

 PORT    SERVICE             PROJECT           REACHABLE       RISK      STARTED BY
 :3000   Next.js             storefront        Localhost only   12 Info  Claude Code 2h
 :5173   Vite                admin-ui          Localhost only   12 Info  terminal 5h
 :8787   Python http.server  data-export       All interfaces   71 High  Claude Code 5d
 :9050   Tor                 /opt/homebrew     Localhost only   12 Info  launchd 24d

 j/k move   h/l pane   tab view   enter detail   O open   / search   f free port   V vibe   q quit
Twelve things are listening. You started three of them today and you cannot name
the rest.
Or see the same scan as a harbour on a second screen, with portlist --world:
What problem does it solve
lsof -i and netstat answer what is bound to this port. That was the whole
question when a machine ran two servers you started by hand. It is not the
question any more, because most of what is listening on a developer laptop was
started by something else: an agent session, an editor, a container, a service
manager, or you, on Tuesday, in a directory you have since forgotten.
The questions that are actually in the way:
| you ask | lsof says |
portlist says |
|---|---|---|
| what is on :8787? | Python, pid 96798 |
a static file server, started by a Claude Code session, in ~/code/data-export |
| who started it? | nothing | that session, and whether it has since exited |
| can anyone reach it? | a bind string like 0.0.0.0 |
what answered when it connected to this machine's real address |
| is it still needed? | how long it has been up | how long it has been unused, measured over time |
| is it safe to kill? | nothing | what depends on it, what it depends on, and the command to stop it |
Three situations it was built for:
"Address already in use." Something holds :3000 and you did not start it.
Was it this morning's agent session, a container, or a dev server from last
Tuesday that never died? portlist names it, and if you just want a port that is
free now and not spoken for later, f gives you one.
An agent left the lights on. Coding agents start servers and move on. The
session exits, the server does not, and nothing on the machine remembers which
session it belonged to. portlist writes a launch record the first time it sees a
service and never rewrites it, so the answer survives both the agent exiting and
the service being restarted by something else.
Bound to the world by accident. 0.0.0.0 in a config file is a claim. The
only honest answer comes from connecting to this machine's real address and
seeing what answers, which is what the REACHABLE column is.
And the rule underneath all of it: it never dresses a guess as a fact. A
service that was already listening before portlist first looked has unknown
origin and says so, rather than inheriting a label from whatever owns the port
now. "The container engine did not answer" is never rendered as "no containers".
Install
Homebrew (macOS, Linux)
brew tap Mr-hunt-007/portlist https://github.com/Mr-hunt-007/homebrew-portlist
brew trust mr-hunt-007/portlist      # Homebrew asks this of every third-party tap
brew install portlist
pip or pipx, anywhere. pipx is the simplest route on Windows, because it
brings windows-curses along:
pipx install git+https://github.com/Mr-hunt-007/portlist
pip  install git+https://github.com/Mr-hunt-007/portlist
One line, into ~/.local, no root and nothing system-wide:
curl -fsSL https://mr-hunt-007.github.io/portlist/install.sh | sh
From source, which needs nothing but Python:
git clone https://github.com/Mr-hunt-007/portlist && cd portlist && python3 portlist.py
Then run portlist.
winget install is not available and is not coming: winget accepts only.exe for a portable package, and what ships for Windows is the source plus a.cmd shim, so the manifests in packaging/winget/ cannot pass validation. Use
pipx there. The name portlist on PyPI belongs to an unrelated package, which
is why the distribution is portlist-tui while the command staysportlist.
The dashboard
0, and it is where portlist opens. Everything about the machine on one screen,
so a single screenshot tells the whole story.
  MACHINE                                           EXPOSURE                    AGENTS                      CONTAINERS
     ·  ●  ●         ·  ●  ●         ◉  ●  ●        LISTENING      16           Claude Code    14           ENGINE         docker
   ·         ●     ·         ●     ●         ●      EXPOSED        2            terminal       1            STATE          no answer
  ·    36%    ◉   ◉    85%    ●   ●    96%    ●     NEEDS WORK     2            launchd        1                           count unknown
   ·   CPU   ·     ●   RAM   ●     ●  DISK   ●      UNKNOWN ORIGIN 12                                                      not zero
     ·  ·  ·         ●  ●  ●         ●  ●  ●
  LOAD  3.56 3.37 3.64

  LISTENING  14 services                                                                                      Tab  next section
    PORT    SERVICE               PROJECT           STARTED BY          REACH           RISK
  ● :7337   Grafana               metrics           terminal            Localhost only  12 Info
  ○ :8000   Python http.server    analytics         Claude Code         Localhost only  12 Info
  ○ :8787   Python http.server    data-export       Claude Code         All interfaces  71 High

  SELECTED SERVICE                                                          │ ACTIVITY
                                                                            │
  Grafana :7337                                                             │ 22:52:49 · Bun on :10065 stopped listening
  ~/code/metrics                                                            │ 22:23:58 · Bun opened on :57155 (loopback)
                                                                            │
  REACH      Localhost only                                                 │ CPU
  PID        9561   Python                                                  │ ▃▃▄▃▃▂▃▄▅▄▃▃▃
  LAST USED  in use now                                                     │ MEMORY
                                                                            │ ▇▇▇▇▇▇▇▇▇▇▇▇▇
  RISK  71 / 100   High                                                     │
    +42   Listening on all interfaces (0.0.0.0)                             │
    +10   No authentication seen and reachable off-box                      │

  ● 2 exposed    ◆ 2 need attention    ⚠ 12 unknown origin    ◉ 3 agents    firewall on
Tab moves to the next view, in the same order as the number keys, and
shift-Tab goes back. h and l (or the arrows) move between the
dashboard's panes, and j/k move inside whichever has focus.
The three dials are live: each ring is twelve segments, the leading one pulses,
and the ring eases round rather than jumping when the reading changes. An
unmeasured value draws an empty ring and says so instead of resting at zero.
Under every card and across the table runs the same travelling wave, and its
amplitude and speed are the reading: a quiet machine ripples slowly and
shallowly, a busy one moves faster and taller. It is a sine, not a history, and
it is never drawn where a history belongs; the sparklines plot real samples. A
card with nothing to measure draws a flat line of dots rather than a wave at
zero, because a flat wave still reads as a measurement of zero, and "not
measured" is not zero.
The risk score is never a bare number. The pane lists what it was made of, so71 High is auditable rather than magical, and ⚠ 12 unknown origin is counted
precisely so those services are not quietly attributed to whatever owns the port
now.
Ten views
| key | view | what it answers |
|---|---|---|
0 |
dashboard | everything at once, and where it opens |
1 |
services | everything listening, with who started it |
2 |
exposed | reachable from beyond this machine |
3 |
attention | critical, high and medium risk |
4 |
leftovers | looks abandoned, with the measurements behind the guess |
5 |
agents | grouped by the agent, editor or terminal that started it |
6 |
containers | by compose project, and the host ports they hold |
7 |
sessions | coding-agent sessions, what they were about, context used |
8 |
system | this machine: load, memory, disks, network, exposure |
9 |
graph | who started what, where it runs, and what it exposes |
V |
vibe | the ambient screen, for the second monitor |
Views 5 and 6 group rather than filter. Every view is a different question asked
of one scan, not a different scan.
Keys
j / k, arrows   move                    tab shift-tab   the next view, the
h / l           the dashboard's panes                   same order as 0-9
enter, o        detail pane             /   search
O               open it in a browser    f   a port that is free now, and not
                (ctrl+enter too, where      spoken for by anything later
                the terminal sends it)  a   animation      V   vibe mode
0-9             views                   r   rescan now     ?   keys    q  quit
                                        W   the living harbour, in a browser
macOS never delivers Cmd+Enter to a terminal program, so O is the binding that
always works.
The sessions you left open
Ten agent windows, none of them closed, and no way to tell which is which.
Press 7. Open sessions first, because those are the only rows you can act
on; everything under them is a transcript nobody is holding:
 TOOL     WHAT IT WAS ABOUT                    PROJECT      CONTEXT  VS BIGGEST  LAST USED
 4 agent processes running  -  30 transcripts on disk
     Claude Code      max - default max 20x
     Codex            not signed in

 6 open right now  -  2.9M tokens between them  -  oldest untouched 5h
 * claude Refactor the billing webhook retries  payments       215k  ██░░░░░░    2s ago    4 here
 * claude Port the admin table to components    admin-ui       904k  ████████    17m ago   4 here
 * claude Trace the flaky integration test      api            479k  ████░░░░    26m ago   4 here

 24 left on disk, no process behind them
   claude Split the worker into two queues      worker         935k  ████████    7h ago
   claude Make the search endpoint paginate     docs           193k  ██░░░░░░    9h ago
The bar compares each session with the biggest one on this machine, and
with nothing else. A transcript records the tokens a turn carried; it never
records the model's context limit, so portlist will not print a percentage of a
window it cannot read.
enter opens the rest of it - the first prompt you typed, where the session got
to, and how to close it:
 context       903,802 tokens on the last turn  -  214 turns
 last active   28 Aug 04:14  (17m ago)
 running       pid 14502
 close it      kill 14502
 first prompt  the stripe webhook retries twice on 5xx, work out why and fix...
 last prompt   run the migration against staging first
When several agents share one directory it says so instead of choosing:
 running       pid 9316, 5864, 30000, 43725 - more than one agent is in this
               directory, so which of them is this session cannot be told from outside
 close it      from its own window - the line above says why a pid cannot be picked for you
A kill that might close the wrong window is worse than no command at all.
Six tools, each read from the store it already writes:
| Claude Code | ~/.claude/projects/**/*.jsonl |
| Codex | ~/.codex/sessions/**/rollout-*.jsonl |
| GitHub Copilot CLI | ~/.copilot/session-store.db, which keeps its own summary |
| VS Code chat | .../Code/User/workspaceStorage/*/chatSessions/*.jsonl |
| Cursor | the same layout under Cursor/, because it is a VS Code fork |
| Gemini CLI | ~/.gemini/tmp/*/logs.json, where a build writes one |
Each gives the generated title, the first prompt you typed, the project, the
model, the turn count, and where available the context it is carrying - the
token total from the last turn, which is the number that decides what to clear.
It also shows which plan each tool is signed in under, so "which account burned
this week's quota" is answerable:
  Claude Code      max - default max 20x
  Codex            not signed in
  GitHub Copilot   signed in
  Gemini           signed in
Live sessions are matched to running agent processes by working directory. Where
several agents share one directory it says so rather than guessing.
Prompts never leave the machine. portlist sends nothing anywhere and has no
network code that reaches beyond this host, so there is nowhere for them to go.
(The optional harbour, --world, serves one page on 127.0.0.1 only, and shows
session titles, never prompts.) Account details are narrower still:
the plan and the organisation, never the address or the account id.
It never reads a whole transcript either - they reach eight megabytes. The head
has the first prompt and the directory, the tail has the title, the latest usage
and the last activity. Sixty sessions in a tenth of a second.
The graph
9. Who started what, where it runs and what it exposes, laid out the way a
terminal draws a layered graph well:
  STARTED BY            PROJECT             PROCESS           PORT  AND SERVICE          REACHABLE FROM
  started work in ──▸   runs ──▸            listens ──▸       confirmed on ──▸

  ◆ Claude Code       ├─analytics         ──Python pid 6810 ──:8000   Python http.serv ──Localhost only
  │                   ├─data-export       ──node pid 77259  ──:8422   unidentified     ──Localhost only
  │                   │                   ──Python pid 96798──:8787   Python http.serv ──All interfaces  confirmed on 192.168.0.2
  │                   ├─metrics           ──bun pid 32016   ──:48744  Bun              ──Localhost only
  │                   └─scanner           ──Python pid 67222──:8787   FastAPI / Uvicorn──Localhost only
  ◇ launchd           └─no project        ──tor pid 58508   ──:9050   Tor              ──Localhost only

  ◆ an agent session   ◇ something else   10 of 12 services were started by an agent
One line is one service, and a parent is printed once and carried down with a
rule, which is what makes the sharing visible: eleven services under one agent
session, four in one project. The edge names are the ones the web version uses,
so both surfaces describe the machine with one vocabulary.
Narrow terminals get the same graph as headed groups, because that is what a
tree looks like when it runs out of width.
The living harbour
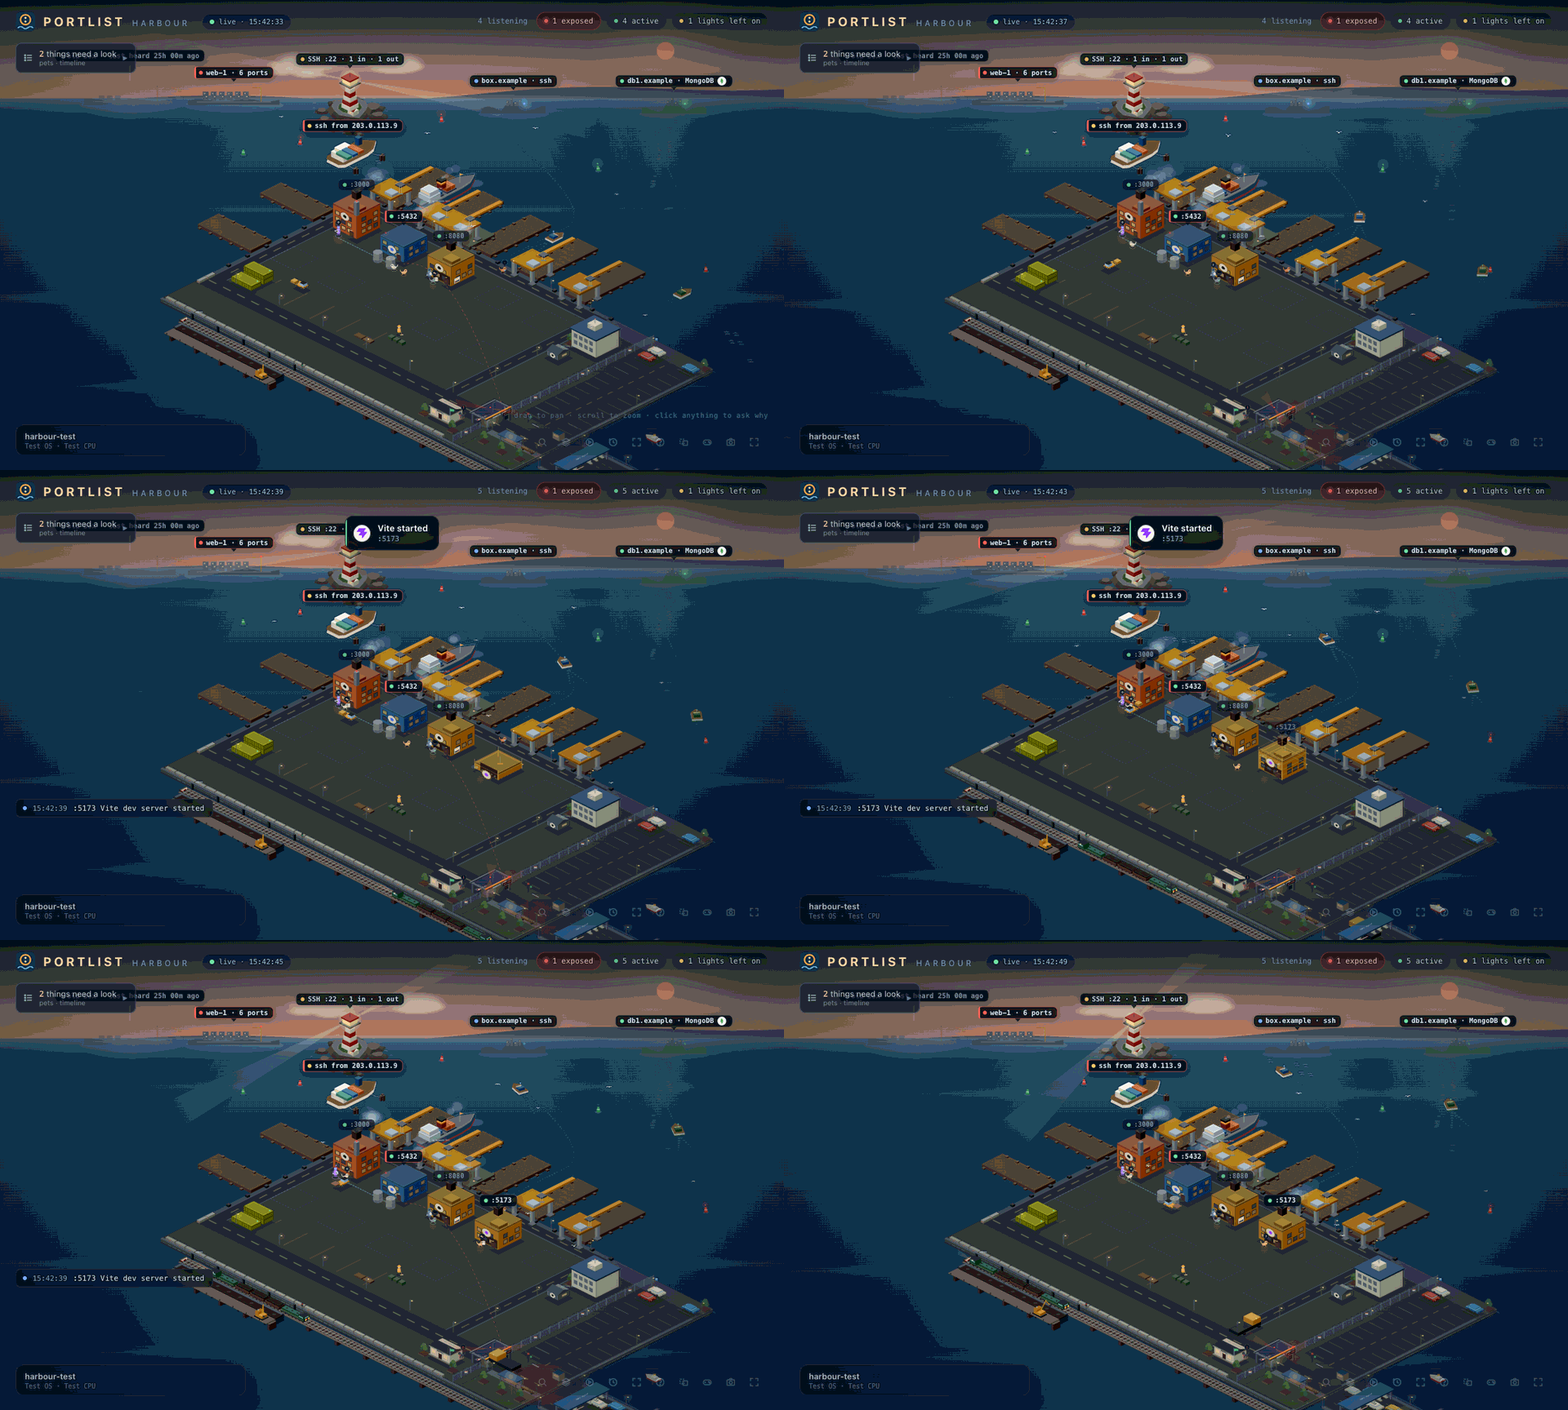
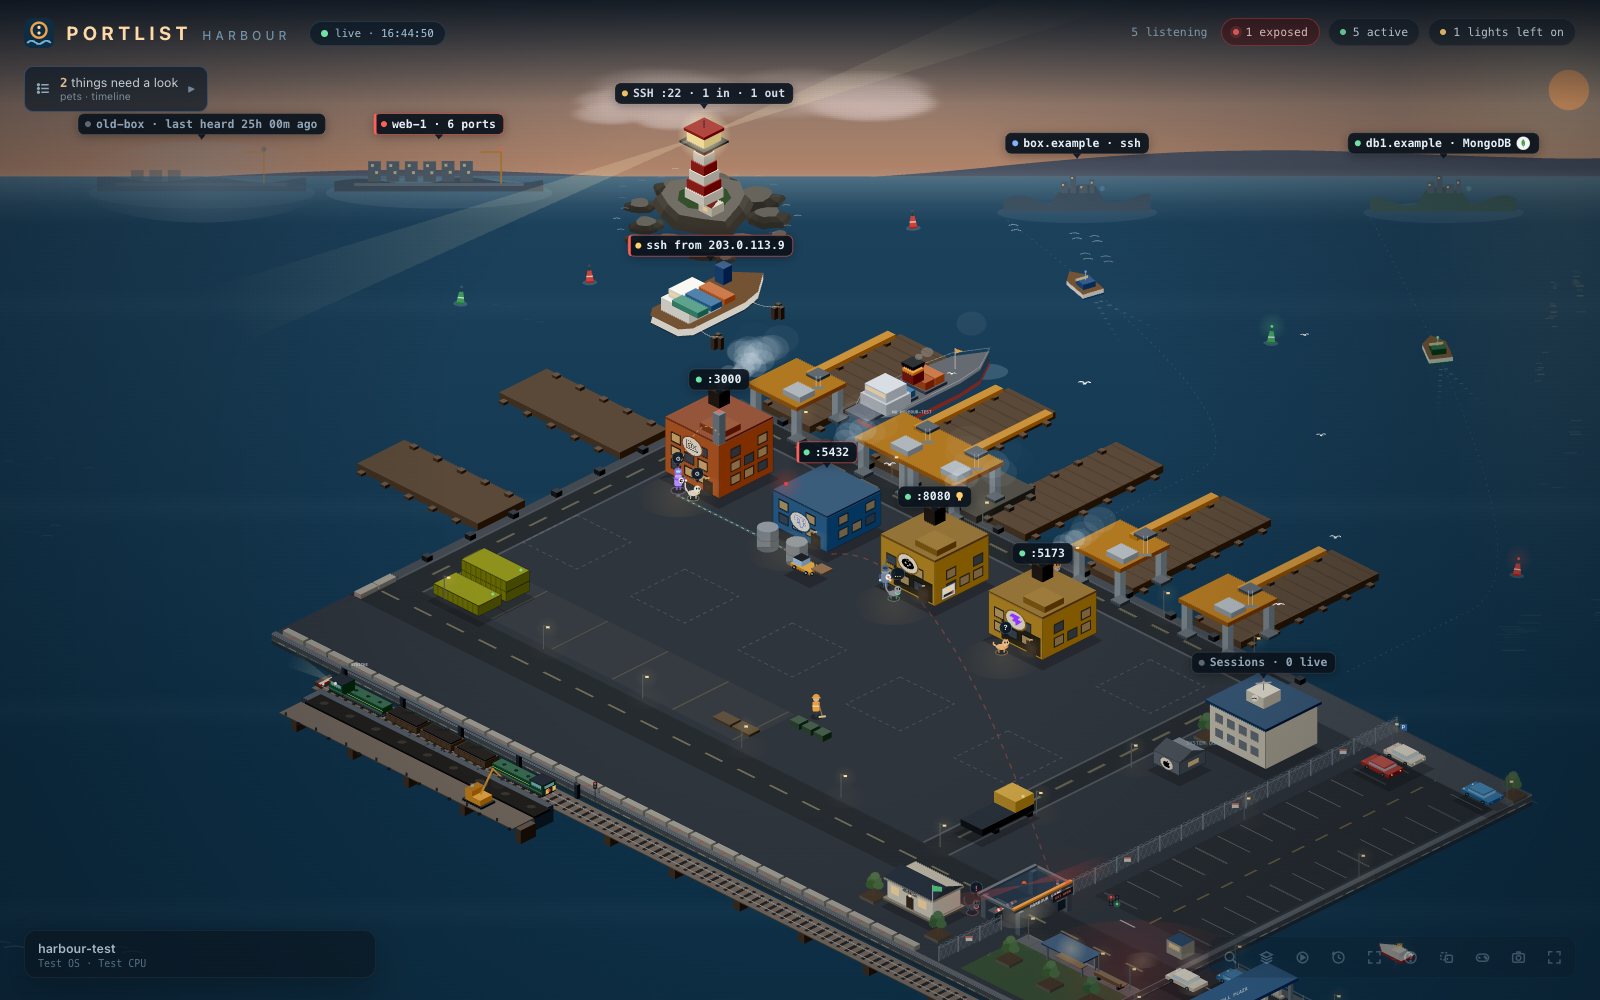
portlist --world # or -world, or W inside the terminal
Every port on this machine as a harbour, in a browser, full screen: a second
screen you can glance at. Each listening service is a building shaped by what it
is (a lighthouse for SSH, tanks for Postgres and Mongo, a dome for a local model,
a mast for MCP), the gate out of the harbour opens only when portlist actually
connected from the network and got in, agents are robots that walk out when they
exit and leave a bulb burning over whatever they left running, and five cats go
and look at whatever matters most. Click anything and it says which measurement
put it there.
Loopback only, one file, no dependencies. It only reads, unless you switch on
stopping in its Play panel (off on every load, and each stop is confirmed). --windowed for a normal
tab, --no-open to print the address. What every object means, the pets' jobs
and the rules are in docs/WORLD.md.
Vibe mode
Press V, or leave it alone for thirty seconds:
                              P O R T L I S T

                                LOCAL NETWORK

                                   ○ :8787
                  :8422 ○ ·           ·           · ○ :8807
                            ·····     ·     ·····
             :8078 ○ ···················HOST···········●······ ◉ :7337
                            ·····     ·     ·····
                  :9050 ○ ·           ·           · ○ :8000

                  1 connection observed between local services
Seven scenes rotate: the cockpit (everything at once), a grid of every listening
service, the machine and its
meters, the network between local services, each agent and what it started,
what has actually happened lately, and the room - a plate that ships with
the program, drawn as characters, with the three numbers that fit placed where
it is dark. Five themes, four speeds, t and s to
cycle them, any other key to come back.
The room scene ships a picture so that it is a scene at all, but that is a
default and not a fixture: set a picture of your own and the room shows yours.
A picture of yours decorates the other six: name it on the way in withportlist --vibe-bg thing.png, or drop PNGs into ~/.portlist/backgrounds/ and
press g inside vibe mode to walk them, with the footer naming what is showing.
g covers both which picture and how it is drawn:
none -> room.png as an image -> room.png as characters -> none
As an image means the terminal is handed the PNG and draws it itself, behind
the text. As characters is the density rendering: b sets how strongly it
shows, 0 to 100, and B decides which end of the picture becomes ink.
Which terminal shows the real picture
Almost no terminal can draw a picture. The ones that can speak kitty's
graphics protocol, and portlist uses only that protocol, for one reason: it
has a z-index, and z=-1 is the only arrangement that puts a picture behind
the readings. iTerm2's inline images and sixel both occupy cells, so a picture
drawn either way would cover the numbers, and a screen whose numbers are hidden
by decoration is worse than a screen with no decoration. So iTerm2 and every
sixel terminal get the character rendering too.
If the ring goes straight from none to as characters, your terminal cannot
do it. That is not a setting you are missing.
macOS - Terminal.app cannot, and no preference changes that. iTerm2 cannot
either, for the reason above. Install one of:
brew install --cask ghostty     # verified working, and needs no configuration
brew install --cask kitty       # the reference implementation of the protocol
brew install --cask wezterm
If Ghostty is the first thing you install, note that its TERM isxterm-ghostty, which is not in the terminfo database most systems ship. Recent
versions install it for you; if portlist will not start there at all, that is
why, and this fixes it:
mkdir -p ~/.terminfo/78
cp /Applications/Ghostty.app/Contents/Resources/terminfo/78/xterm-ghostty ~/.terminfo/78/
Linux - several work. kitty and Ghostty are packaged for most distributions;
Konsole (KDE) and WezTerm implement the protocol as well.
sudo apt install kitty                 # Debian, Ubuntu
sudo dnf install kitty                 # Fedora
sudo pacman -S kitty                   # Arch
curl -L https://sw.kovidgoyal.net/kitty/installer.sh | sh /dev/stdin
Windows - Windows Terminal speaks sixel, not this protocol, so it draws
characters. WezTerm is the one that works:
winget install wez.wezterm
Under WSL the terminal is whatever is drawing the window, so the same rule
applies: WezTerm yes, Windows Terminal characters.
Over ssh it works when the terminal in front of you supports it, because
the escape travels down the connection like any other output. Inside tmux it
usually does not, unless tmux is configured to pass the escape through. The
character rendering has none of these conditions, which is why it stays the
default answer rather than a fallback.
Nothing is written to a terminal that has not said it speaks the protocol, so
being wrong about support costs a blank background rather than escape codes
across your screen. To force characters everywhere, including on a terminal that
could show the file, set PORTLIST_NO_GRAPHICS=1 or press g one more step.
Confirmed on Ghostty, macOS, with the picture behind the readings as
intended. kitty is the reference implementation of the protocol and Konsole and
WezTerm implement it too, but I have not put eyes on those three, and terminals
differ in how completely they follow the spec. If yours honours the protocol
without the z-index the picture will sit over the text rather than behind it:
press g once more for characters, and open an issue naming the terminal.
When a service really appears while you are watching, it is marked NEW for a
few seconds and the strip redraws around it; when one stops listening, that is
reported too. The first frame marks nothing, because everything is new to the
screen the moment it opens and none of it is new to the machine.
Nothing on that screen moves unless something was measured. A dot pulses
because that service was measured busy inside the last minute. A particle
crosses an edge because a loopback connection between those two ports was
observed. Where nothing has been measured, it says so and sits still: inventing
motion would make the prettiest part of the program the one lying to you.
What it can tell you that lsof cannot
- Who started it. Claude Code, Cursor, Codex, Copilot, Aider, Goose,
Windsurf, a terminal, a service manager - from process ancestry first and the
environment second. And whether that session has since exited. - Whether it survived a restart. A launch record is written the first time a
service is seen and never rewritten, so attribution outlives both the agent
exiting and the service being restarted by something else. - Whether anyone is using it. Measured over time, not inferred from uptime.
- Whether the network can reach it, checked by connecting to this machine's
real address rather than reading a bind string. - Which container holds the port, and which compose project it belongs to.
- A port that is free now and not spoken for by anything you run later.
It never stops anything on its own
The terminal prints the command; you run it. There is no kill key, no daemon,
and nothing here writes to another machine. The one exception is opt-in: the
harbour's Play panel has a stopping switch, off on every page load. With it
on, each stop asks first, then sends SIGTERM to that process, and only if a
fresh scan shows it still on that port.
It does open sockets, and it is worth being exact about which. It connects
outward to the ports on this machine to see what answers, and it binds a
candidate port for a moment to check it is free, then closes it. Neither ever
calls listen(), so the terminal has no port of its own and nothing can
connect to it. portlist --world is the only thing that listens: one server on
127.0.0.1, gone when you close it, answering only with the per-run key.
Where its data lives
~/.portlist/ - the launch ledger, use history and the recipe book. Override
with --data-dir or PORTLIST_DATA.
Requirements
Python 3.9+ with curses, standard on macOS, Linux and BSD. On Windows,pip install windows-curses, which pipx install portlist-tui does for you. No
third-party packages on any platform otherwise, ever.
Documentation
- Setup - every install route, and what each one puts where
- Usage - the views, the keys, and what each column means
- Features - the full list, and how each answer is reached
- Architecture - one scan, one model, ten views
- Motion - the animation language, and why each thing moves
- Security - what it reads, what it never sends
- Contributing
MIT.
If portlist saved you an afternoon of lsof | grep, you can
buy me a coffee. Entirely optional: the
tool is free, has no telemetry, and will stay that way.
Reviews (0)
Sign in to leave a review.
Leave a reviewNo results found