PhpCodeArcheology
Health Gecti
- License — License: MIT
- Description — Repository has a description
- Active repo — Last push 0 days ago
- Community trust — 34 GitHub stars
Code Gecti
- Code scan — Scanned 12 files during light audit, no dangerous patterns found
Permissions Gecti
- Permissions — No dangerous permissions requested
Bu listing icin henuz AI raporu yok.
PHP static analysis for architecture & maintainability — 60+ metrics, complexity analysis, dependency graphs, git churn hotspots, and AI-ready MCP server. Alternative to PHPMetrics.
PhpCodeArcheology


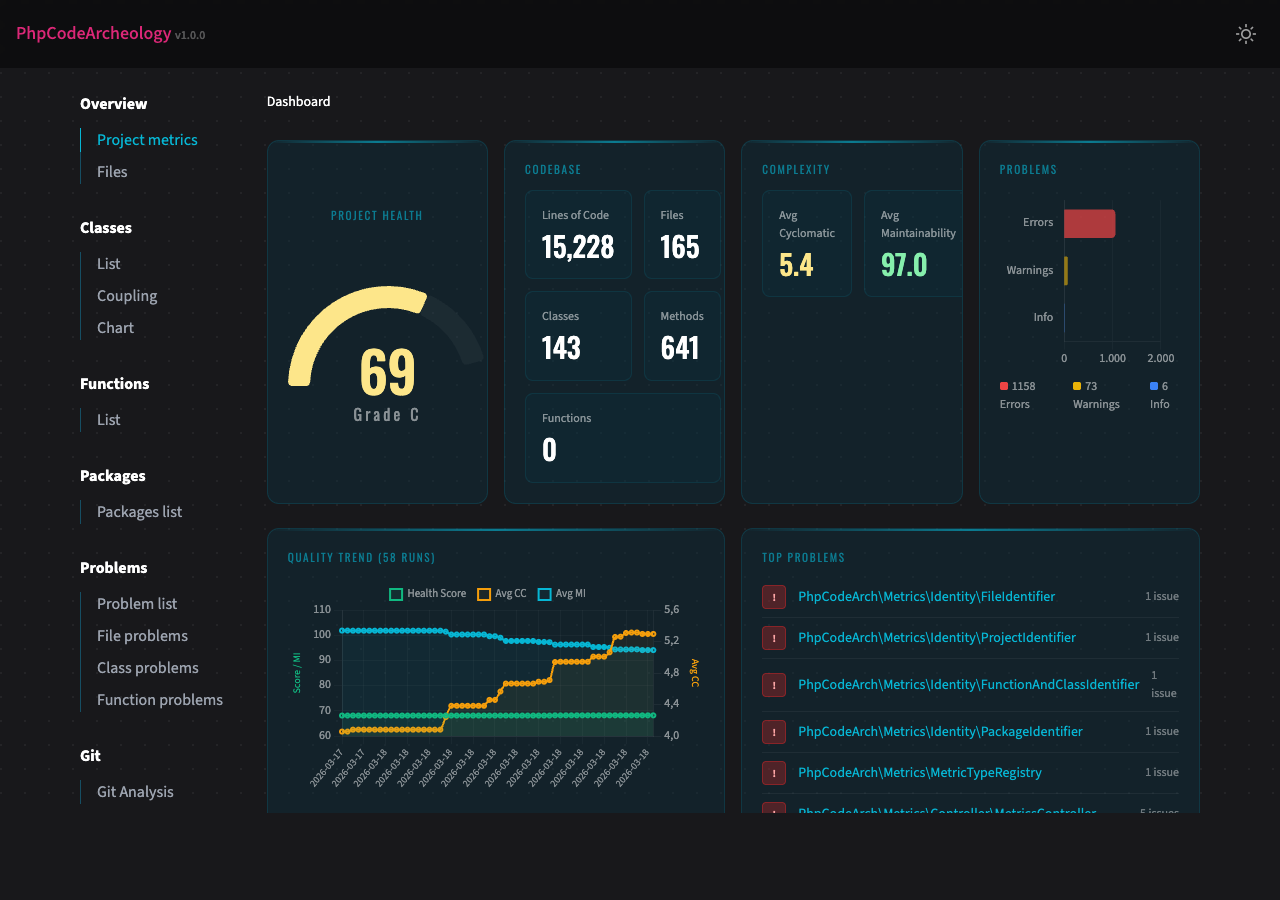
PhpCodeArcheology is a PHP static analysis tool that measures code quality through 60+ metrics including cyclomatic complexity, maintainability index, coupling, and cohesion. It generates comprehensive reports for files, classes, methods, and functions — detecting code smells, identifying hotspots via git churn analysis, and tracking quality trends over time.
Unlike PHPStan or Psalm (which focus on type safety and bug detection), PhpCodeArcheology focuses on architecture and maintainability — giving you the insights you need to understand and improve your codebase structure. Think of it as an alternative to PHPMetrics with deeper git integration, baseline management, and AI-ready output.
AI Integration (MCP Server)
PhpCodeArcheology is the first PHP static analysis tool with native MCP (Model Context Protocol) support — meaning AI assistants like Claude can query your codebase analysis results directly, without reading files or parsing JSON manually.
Quick Start with Claude Code
The setup depends on how you installed PhpCodeArcheology:
Global installation (composer global require php-code-archeology/php-code-archeology):
claude mcp add phpcodearcheology -- phpcodearcheology mcp
Project dependency (composer require --dev php-code-archeology/php-code-archeology):
claude mcp add phpcodearcheology -- vendor/bin/phpcodearcheology mcp
Or drop a .mcp.json into your project root for team sharing:
{
  "mcpServers": {
    "phpcodearcheology": {
      "command": "vendor/bin/phpcodearcheology",
      "args": ["mcp"]
    }
  }
}
Once connected, Claude can answer questions like "Which classes have the highest technical debt?", "Show me all God Classes", or "What are the top refactoring priorities in this project?" — using live analysis data.
Available MCP Tools
| Tool | Description |
|---|---|
get_health_score |
Overall code health score, grade, and project statistics |
get_problems |
Code quality problems, filterable by severity and type |
get_metrics |
Detailed metrics for a specific class, file, or function |
get_hotspots |
Git hotspots ranked by churn × complexity |
get_refactoring_priorities |
Ranked refactoring candidates with recommendations |
get_dependencies |
Class dependency analysis (incoming/outgoing) |
get_class_list |
All classes with key metrics, sortable and filterable |
get_graph |
Knowledge graph as JSON (nodes, edges, cycles) |
get_impact_analysis |
Impact analysis: what breaks if you change a method? Shows callers and call chains |
get_test_coverage |
Test coverage summary — tested/untested classes, coverage gaps, test mapping |
search_code |
Search entities by name with metric overview |
Features
- 60+ code quality metrics per file, class, and function — cyclomatic complexity, cognitive complexity, maintainability index, LCOM, Halstead metrics, coupling, instability, and more
- Problem detection with 14 built-in rules — God Class, too complex, dead code, security smells, SOLID violations, deep inheritance, low type coverage, untested complex code
- Test analysis — auto-detects PHPUnit/Pest/Codeception, maps test files to production classes, integrates Clover XML for line-level coverage, highlights untested hotspots
- Git integration — churn analysis, hotspot detection (high churn + high complexity), author tracking
- Multiple report formats — interactive HTML, Markdown, JSON, SARIF (GitHub Code Scanning), AI summary, Knowledge Graph (JSON)
- Health Score — single 0-100 score with A-F grading for your entire project
- Technical Debt Score — weighted problem score normalised per 100 logical lines of code
- History tracking — trend charts across multiple analysis runs
- Baseline management — track only new problems, ignore existing ones (ideal for legacy projects)
- CI/CD ready — configurable exit codes, SARIF for GitHub Code Scanning, JSON for custom tooling
- Quick mode — fast terminal-only output without report generation
- CLAUDE.md generation — auto-generated project overview for AI coding assistants
Prerequisites
- PHP 8.2 or higher (works on 8.2, 8.3, 8.4, 8.5)
- Composer
Installation
composer require --dev php-code-archeology/php-code-archeology
Global Installation
composer global require php-code-archeology/php-code-archeology
Make sure ~/.composer/vendor/bin (or ~/.config/composer/vendor/bin) is in your $PATH. Then run from any directory:
phpcodearcheology /path/to/your/project
Docker
docker build -t phpcodearcheology https://github.com/PhpCodeArcheology/PhpCodeArcheology.git
Run against a local project:
docker run --rm -v "$(pwd)":/project -v "$(pwd)/report":/output phpcodearcheology /project
This mounts your project into the container and writes the HTML report to ./report/.
Quick Start
Run in your project root:
./vendor/bin/phpcodearcheology
No config file needed — the tool works out of the box. It scans your src directory and creates an HTML report in tmp/report. Open tmp/report/index.html in your browser.
Tip: Add
tmp/reportto your.gitignoreto keep generated reports out of version control.
To create a config file interactively:
./vendor/bin/phpcodearcheology init
Test Analysis
PhpCodeArcheology automatically detects your test infrastructure from composer.json (PHPUnit, Pest, or Codeception) and maps test files to production classes using PSR-4 namespaces, naming conventions, and directory structure.
What you get out of the box:
- Per-class
hasTestflag and test file count in the HTML/Markdown/JSON reports UntestedComplexCodewarnings for classes with cyclomatic complexity ≥ 8 and no tests (only when test infrastructure is detected)untestedas a refactoring priority driver- A Tests page in the HTML and Markdown reports with a coverage gaps table and dashboard tiles
Important note on Pest: Pest's function-based tests (it(...), test(...)) contain no class declaration and cannot be mapped to production classes by name alone. To get accurate coverage for Pest projects, generate a Clover XML report — this tracks actual line execution regardless of test style.
With Clover XML coverage data (optional, recommended for Pest), you get line-level coverage per class:
# Generate coverage first (requires Xdebug or PCOV PHP extension)
XDEBUG_MODE=coverage vendor/bin/pest --coverage-clover clover.xml
# or: XDEBUG_MODE=coverage vendor/bin/phpunit --coverage-clover clover.xml

# PhpCodeArcheology auto-detects clover.xml in common locations (project root, build/logs/, etc.)
./vendor/bin/phpcodearcheology src/

# Or specify explicitly:
./vendor/bin/phpcodearcheology --coverage-file clover.xml src/
Coverage data is factored into the Health Score as a 10th factor (10% weight). The get_test_coverage MCP tool exposes all coverage data to AI assistants.
CLI Options
./vendor/bin/phpcodearcheology [options] [path...]
| Option | Description |
|---|---|
--report-type=TYPE |
Report format: html (default), markdown, json, sarif, ai-summary, graph. Comma-separated for multiple: html,json |
--report-dir=DIR |
Output directory (default: tmp/report) |
--quick |
Fast analysis with terminal output only, no report generation |
--no-color |
Disable coloured terminal output (also respects NO_COLOR env) |
--fail-on=LEVEL |
Exit 1 on error or warning (for CI pipelines) |
--generate-claude-md |
Generate a CLAUDE.md project overview |
--git-root=DIR |
Git repository root (default: current directory) |
--extensions=EXT |
File extensions to analyse (comma-separated, default: php) |
--exclude=DIR |
Directories to exclude (comma-separated) |
--coverage-file=FILE |
Clover XML coverage file from PHPUnit/Pest for line-level coverage data |
--version |
Show version |
Subcommands
init — Create Config File
./vendor/bin/phpcodearcheology init
Interactively creates a php-codearch-config.yaml with sensible defaults. Detects common source directories (src, app, lib) automatically.
compare — Compare Two Reports
./vendor/bin/phpcodearcheology compare report-before.json report-after.json
Shows a delta view of metrics, problem counts, and lists new/resolved problems. Useful for answering: "Did my refactoring actually help?"
baseline — Track New Problems Only
./vendor/bin/phpcodearcheology baseline create src
./vendor/bin/phpcodearcheology baseline check src
create saves the current problem set as a baseline. check runs a fresh analysis and reports only problems that are new compared to the baseline. Returns exit code 1 if new errors are found — ideal for CI pipelines on legacy projects.
Configuration
Create a php-codearch-config.yaml in your project root (or use init):
include:
  - "src"

exclude:
  - "vendor"

extensions:
  - "php"

packageSize: 2

reportDir: "tmp/report"
reportType: "html"

git:
  enable: true
  since: "6 months ago"
  root: "."  # Git repository root (useful for monorepos or subdirectory analysis)

graph:
  methodCalls: true  # Track cross-class method calls in the knowledge graph (default: true)

php:
  version: "8.2"       # Target PHP version for parsing (default: host PHP version)
  shortOpenTags: false  # Treat <? as PHP open tag (default: false)

framework:
  detect: true                    # Auto-detect Symfony/Laravel/Doctrine from composer.json (default: true)
  adjustments:
    doctrineCycles: true          # Downgrade Entity↔Repository cycles to info (default: true)
    entityCycles: true            # Downgrade Entity↔Entity ORM cycles to info (default: true)
    controllerThresholds: true    # Raise dependency thresholds for controllers (default: true)

qualityGate:
  maxErrors: 0
  maxWarnings: 10

thresholds:
  tooLong:
    file: 400
    class: 300
    function: 40
    method: 30
  tooComplex:
    cc: 10
    ccLargeCode: 20
    difficulty: 20
    cognitiveComplexity: 15
    avgMethodCc: 10
  tooManyParameters:
    warning: 4
    error: 7
  tooDependent:
    function: 10
    class: 20
  lowTypeCoverage:
    warning: 60
    error: 40
  deepInheritance:
    warning: 4
    error: 6
  tooMuchHtml:
    filePercent: 25
    classPercent: 10
    fileOutput: 10
    classOutput: 4
  hotspot:
    minChurn: 10
    minCc: 15
  lcomExclude:
    patterns:        # Class name patterns to skip LCOM warnings (fnmatch)
      - "*Exception"
      - "*Error"
    interfaces:      # Implemented interfaces that justify low cohesion
      - "EventSubscriberInterface"
      - "EventListenerInterface"
Note: Enums, interfaces, traits, and classes with 0-1 methods are always excluded from LCOM warnings regardless of configuration.
All threshold values shown above are the defaults. You only need to specify values you want to override.
Report Types
| Type | Subdirectory | Output | Use Case |
|---|---|---|---|
html |
html/ |
Interactive HTML report with charts | Browser-based review |
markdown |
markdown/ |
Markdown files | Text-based review, Git-friendly |
json |
json/ |
report.json |
Machine processing, custom tooling |
sarif |
sarif/ |
report.sarif.json |
GitHub Code Scanning, VS Code SARIF Viewer |
ai-summary |
ai-summary/ |
ai-summary.md |
Token-efficient summary for LLM consumption |
graph |
graph/ |
graph.json |
Knowledge Graph (nodes + edges) for AI tools and visualisations |
Since v1.6.0, each report type writes into its own subdirectory. history.jsonl remains in the report root.
tmp/report/
├── html/
│   └── index.html
├── json/
│   └── report.json
├── sarif/
│   └── report.sarif.json
├── markdown/
│   └── ...
├── ai-summary/
│   └── ai-summary.md
├── graph/
│   └── graph.json
└── history.jsonl
Generate multiple report types in one run:
./vendor/bin/phpcodearcheology --report-type=html,json
Upgrading from v1.5.x? Old report files in the report root (e.g.
index.html,report.json) are no longer overwritten. They can be safely deleted.
Knowledge Graph Export
The graph report type exports your codebase structure as a machine-readable Knowledge Graph — designed for AI tools, graph databases, and custom visualisations.
./vendor/bin/phpcodearcheology --report-type=graph --report-dir=output src/
# Writes: output/graph/graph.json
The JSON output contains four top-level arrays:
nodes — five types of nodes, each with an id, type, name, metrics, and flags:
| Node type | Metrics |
|---|---|
class |
cc, lcom, mi, instability, afferentCoupling, efferentCoupling, gitChurnCount, gitCodeAgeDays |
method |
cc, cognitiveComplexity, params |
function |
cc, cognitiveComplexity, params |
package |
abstractness, instability, distanceFromMainline |
author |
commitCount, filesChanged |
edges — relationships between nodes:
| Edge type | Meaning |
|---|---|
declares |
Class → Method |
extends |
Class → Parent class |
implements |
Class → Interface |
uses_trait |
Class → Trait |
depends_on |
Class → Class (via new / static call) |
calls |
Method → Method (cross-class calls via new / static call, weight = call-site count) |
belongs_to |
Class → Package |
authored_by |
Class → Author |
cycle_member |
Class ↔ Class (dependency cycle, bidirectional) |
clusters — classes grouped by package.
cycles — detected dependency cycles with the involved class node IDs.
{
  "version": "1.0",
  "generatedAt": "2026-03-24T12:00:00+00:00",
  "nodes": [
    { "id": "class:x1a2b3c4", "type": "class", "name": "App\\UserService",
      "path": "/src/UserService.php",
      "metrics": { "cc": 12, "lcom": 3, "mi": 65.2, "instability": 0.8,
                   "afferentCoupling": 5, "efferentCoupling": 20,
                   "gitChurnCount": 15, "gitCodeAgeDays": 42 },
      "flags": { "interface": false, "trait": false, "abstract": false,
                 "final": false, "enum": false },
      "problems": [] }
  ],
  "edges": [
    { "source": "class:x1a2b3c4", "target": "class:x9c0d1e2f",
      "type": "depends_on", "weight": 1 }
  ],
  "clusters": [
    { "id": "package:App\\Services", "name": "App\\Services",
      "nodeIds": ["class:x1a2b3c4"] }
  ],
  "cycles": [
    { "nodes": ["class:xabc123", "class:xdef456"], "length": 2 }
  ]
}
Key Metrics
| Metric | Description |
|---|---|
| Cyclomatic Complexity (CC) | Number of independent paths through code. Below 5 is good, above 10 needs attention. |
| Cognitive Complexity | How difficult code is to understand (considers nesting depth). |
| Maintainability Index (MI) | Composite score from CC, Halstead volume, and LOC. Above 85 is good, below 65 is concerning. |
| LCOM | Lack of Cohesion of Methods — how well a class's methods relate to each other. Lower is better. |
| Halstead Metrics | Difficulty, effort, volume, and vocabulary based on operators/operands. |
| Type Coverage | Percentage of parameters and return values with type declarations. |
| Instability | Ratio of efferent to total coupling (0 = stable, 1 = unstable). |
| Technical Debt Score | Weighted problem points per 100 logical lines of code. |
| Health Score | Overall project quality grade from A (excellent) to F (critical). |
For detailed descriptions, formulas, thresholds, and interpretation guidelines, see the Metric Reference.
The HTML report also includes a full Metric Glossary with descriptions, thresholds, and severity levels.
Development
The HTML report templates use Tailwind CSS. The compiled output.css is committed to the repository, so you do not need Node.js to use or contribute to this project.
If you modify HTML templates or CSS, rebuild with:
npm install
npm run build:css
For live rebuilding during development:
npm run watch:css
A Note on Metric Accuracy (v2.7.0)
I use PhpCodeArcheology extensively on my own projects to track code quality over time. While doing so, I noticed that some metric values didn't quite add up — method-level Halstead difficulty seemed too high, certain classes were flagged as God Classes when they shouldn't have been, and error counts felt inflated.
After a thorough review, I found and fixed several calculation bugs that had been present since earlier versions. The most impactful was a Halstead operand tracking bug at the method level, along with double-counting in complexity predictions, false positives in God Class detection, and a few other issues.
I sincerely apologize for the inaccuracy. A code analysis tool must be trustworthy above all else, and these bugs undermined that. Version 2.7.0 corrects all known calculation issues, and I've added hand-calculated test fixtures to ensure the formulas stay correct going forward.
What this means for you: If you're upgrading from an earlier version, your analysis results will change — most notably, error counts will decrease by ~30-40% and Health Scores will improve slightly. The tool will show a one-time notice on first run. See docs/metrics-formulas.md for a detailed breakdown of every change and its expected impact.
Author
Marcus Kober — GitHub
License
MIT
Yorumlar (0)
Yorum birakmak icin giris yap.
Yorum birakSonuc bulunamadi