claude-monitor
Health Pass
- License — License: MIT
- Description — Repository has a description
- Active repo — Last push 0 days ago
- Community trust — 10 GitHub stars
Code Fail
- network request — Outbound network request in frontend/src/api/client.ts
- exec() — Shell command execution in frontend/src/components/AgentTree.tsx
Permissions Pass
- Permissions — No dangerous permissions requested
No AI report is available for this listing yet.
Local observability dashboard for Claude Code
claude-monitor
Local observability dashboard for Claude Code sessions — see what your context window is actually doing.
![]()
![]()

Contents
Why? · Quick Start · Features · How It Works · CLI Reference · Status line link · Uninstall · Built With · Development
Why?
Claude Code sessions generate rich transcript data, but you can't see what's happening under the hood:
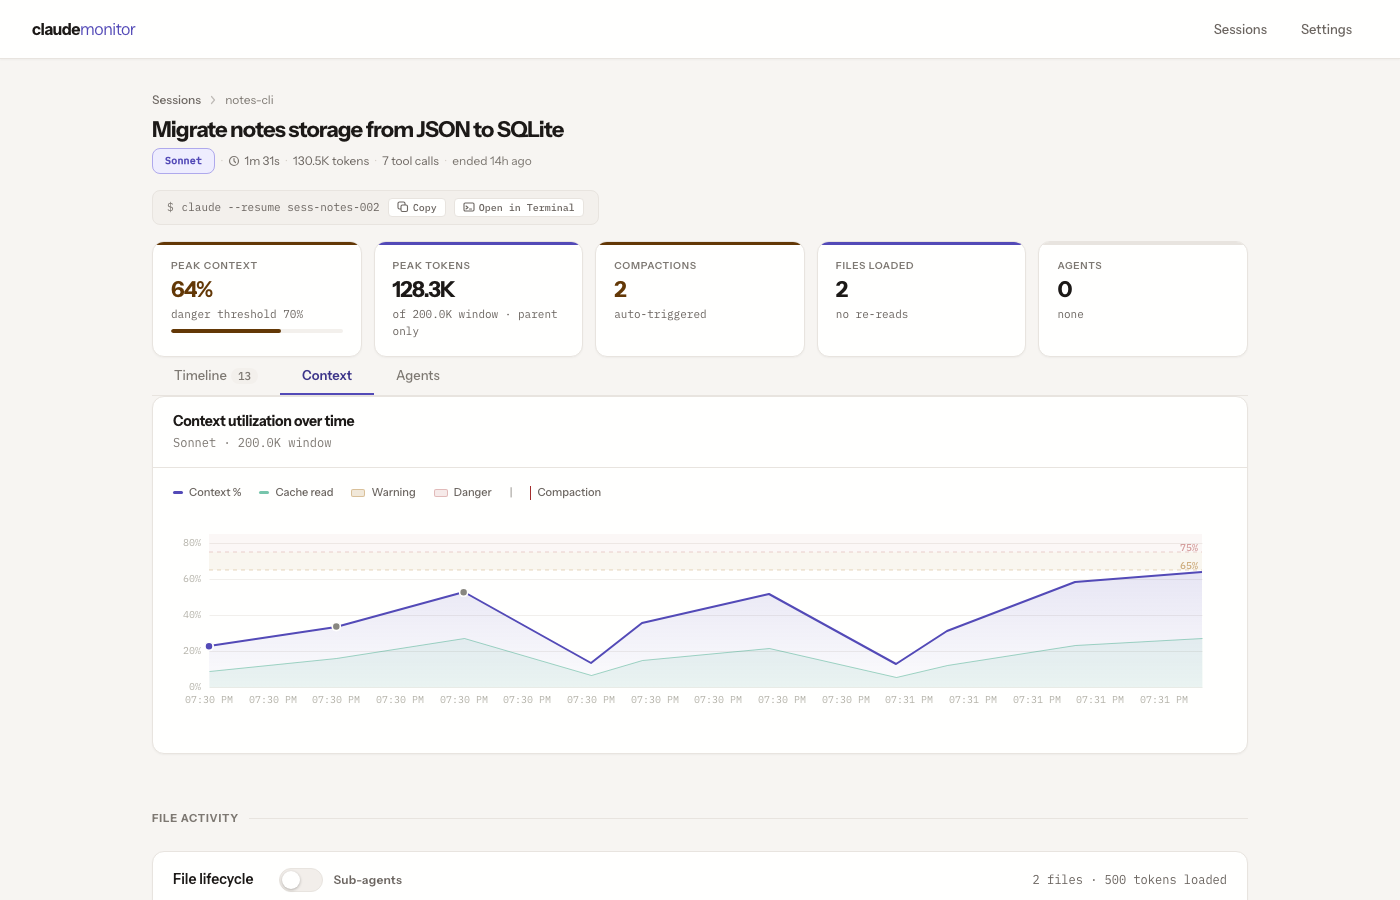
- Context fills up silently — you don't know you're at 90% until output quality drops. claude-monitor shows token utilization over time with warning and danger zones.
- Files bloat your context — every file read burns tokens, and re-reads of the same file waste context you can't afford. claude-monitor tracks which files were loaded, how many times, and how much context each one consumed.
- Sub-agent calls are opaque — spawned agents consume tokens and return results you never see. claude-monitor maps the full agent tree with per-agent token costs, Gantt timelines, tool breakdowns, and result classification.
- Compactions are invisible — when Claude compresses its context, you lose information silently. claude-monitor marks every compaction on the timeline so you can see exactly when and how much was lost.
Quick Start
First, import every existing Claude Code session from ~/.claude/projects/:
npx @pigorv/claude-monitor import ~/.claude/projects/
Then start the dashboard — it opens at http://localhost:4173 and tracks only newly added sessions going forward:
npx @pigorv/claude-monitor start
Requirements: Node.js >= 20, Claude Code (for transcript files)
Features
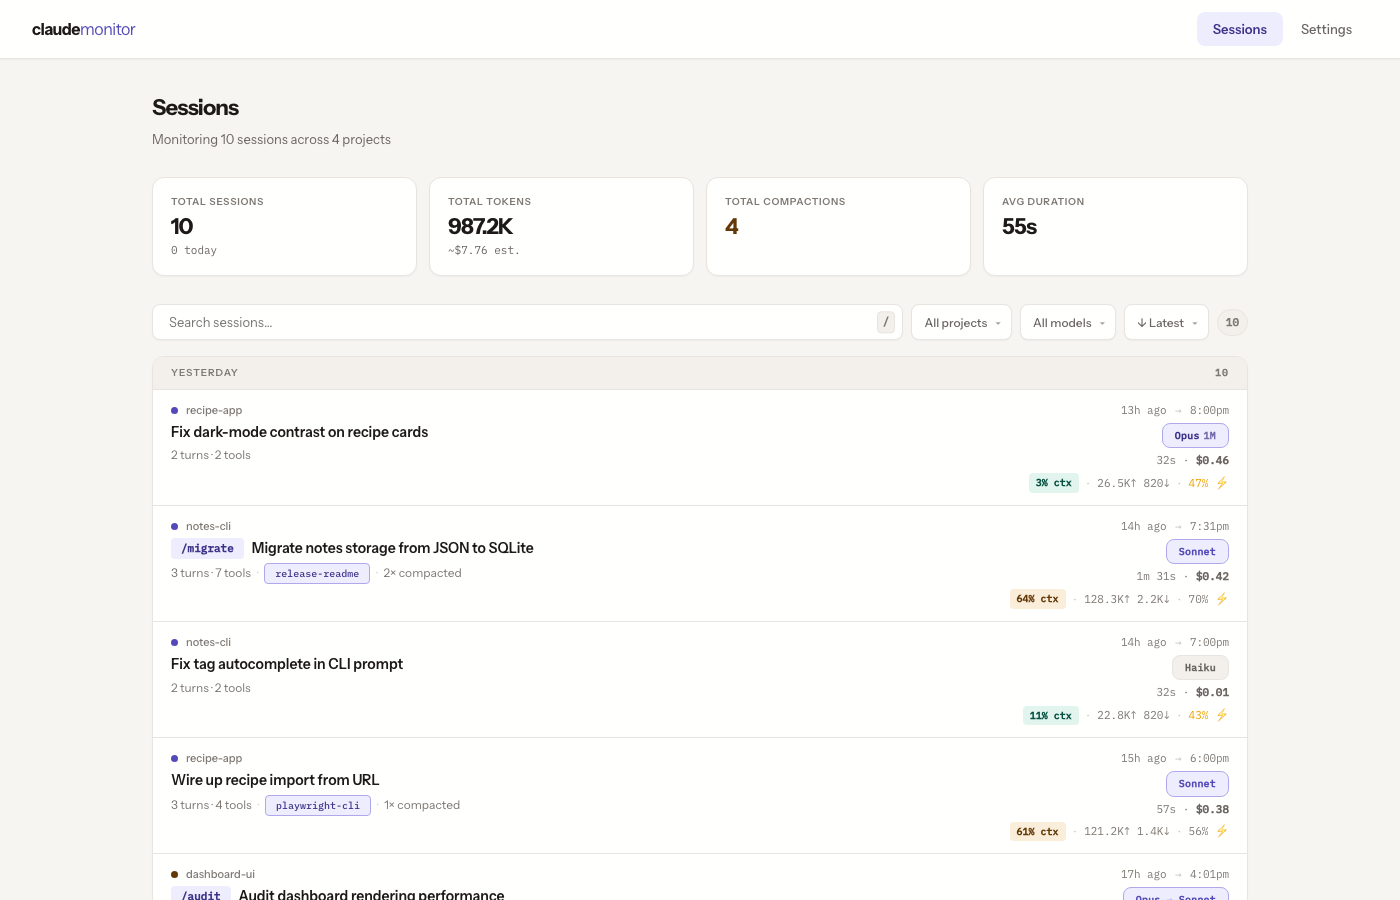
Session List — Filterable, sortable table with a recognition-first row layout: task intent as the bold title, project name as a small label, and turns/sub-agents/tools/skills/compaction in a muted subtitle. Every row has a right-rail telemetry ledger showing relative-start → ended clock (full timestamps on hover), model pill (Fable 5 sessions get a styled Fable pill with a 1M badge), duration · estimated cost, and peak-context % color-coded against the model's threshold. Rows group under TODAY / YESTERDAY / THIS WEEK headers when sorted by start time. Single filter bar with Project, Model, and Sort dropdowns (including "Highest/Lowest ctx %" and "Most expensive/Cheapest" options); press / to focus search from anywhere — and search matches message content (the actual prompts and replies, not just project, path, and summary), ranking hits by where they landed and tagging each with a "matched in prompt / response / sub-agent" chip plus a highlighted snippet. Sessions started with a /command or skill show the command/skill pill inline before the session title.
Context Pressure — Interactive token chart (uPlot) with input/output/cache breakdown, model-specific thresholds (Fable 5 sessions are measured against their full 1M-token context window), compaction markers, and drag-to-zoom.
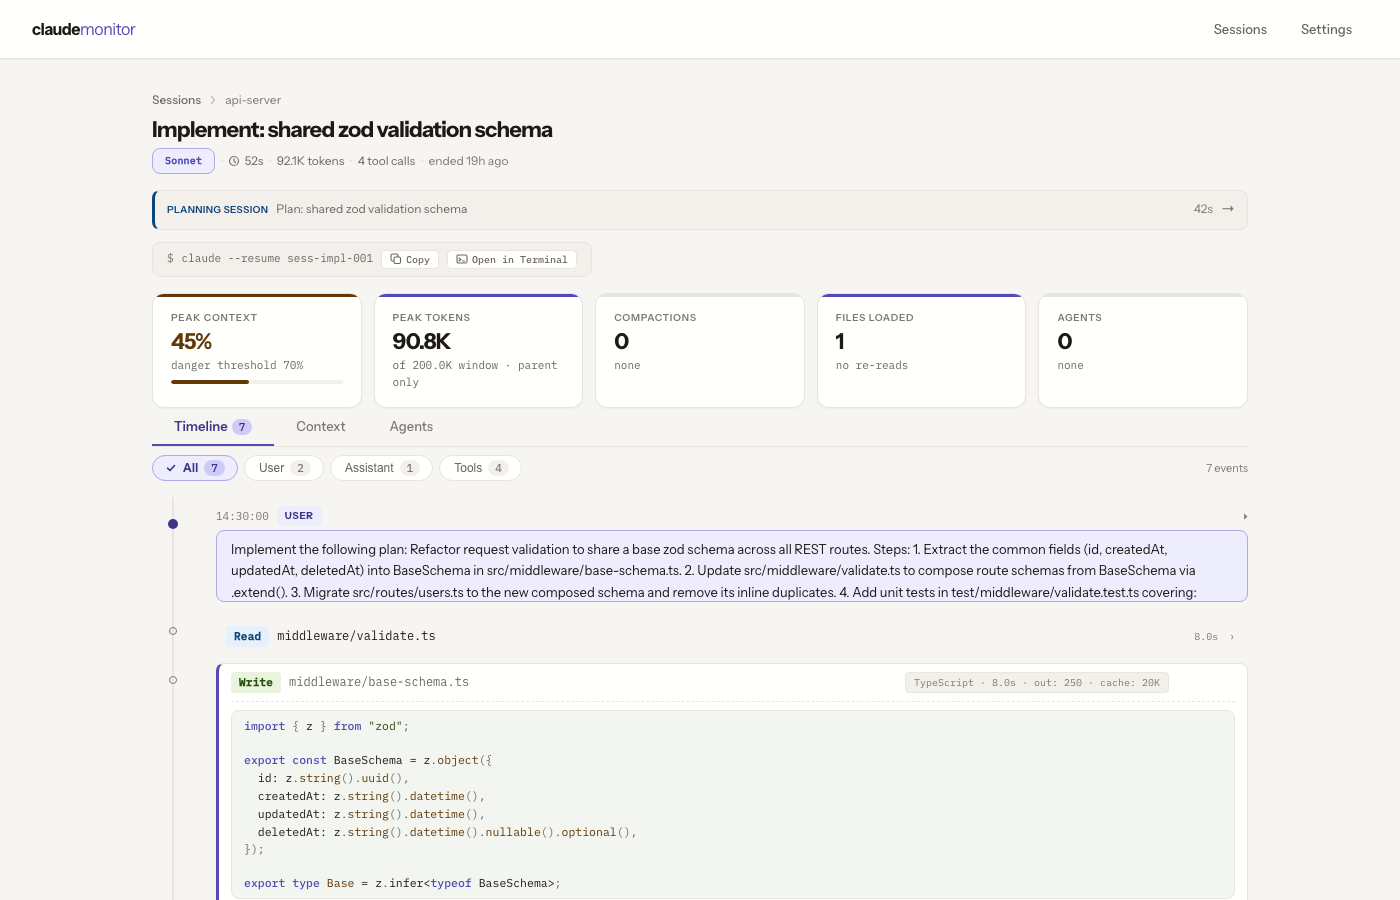
Thinking Inspection — Expandable thinking blocks in the event timeline with infinite scroll. User messages appear in faint purple with an uppercase USER label and matching rail dot; assistant messages in neutral white with an ASSISTANT label — visually distinct from each other and from tool-call color signals (green=Write, teal=agent, orange=skill). Write and Edit tool calls render as full cards with rationale sourced from the nearest thinking block, a syntax-highlighted diff or content body (Prism.js), and per-card metadata (language · duration · output · cache); collapsible to ~10 lines with in-place expand, with long replies fading at the clip line. Thinking, skill expansions, and tool inputs also render as structured markdown / pretty-printed JSON / labeled <system-reminder> blocks — the same way across the Timeline, Agents tab, and sub-agent groups. AskUserQuestion prompts render as review cards with three zoom levels, from a collapsed one-line summary up to the full options grid showing exactly which option you picked. Every expanded block has a hover-revealed Copy button that puts the full, untruncated text on the clipboard.
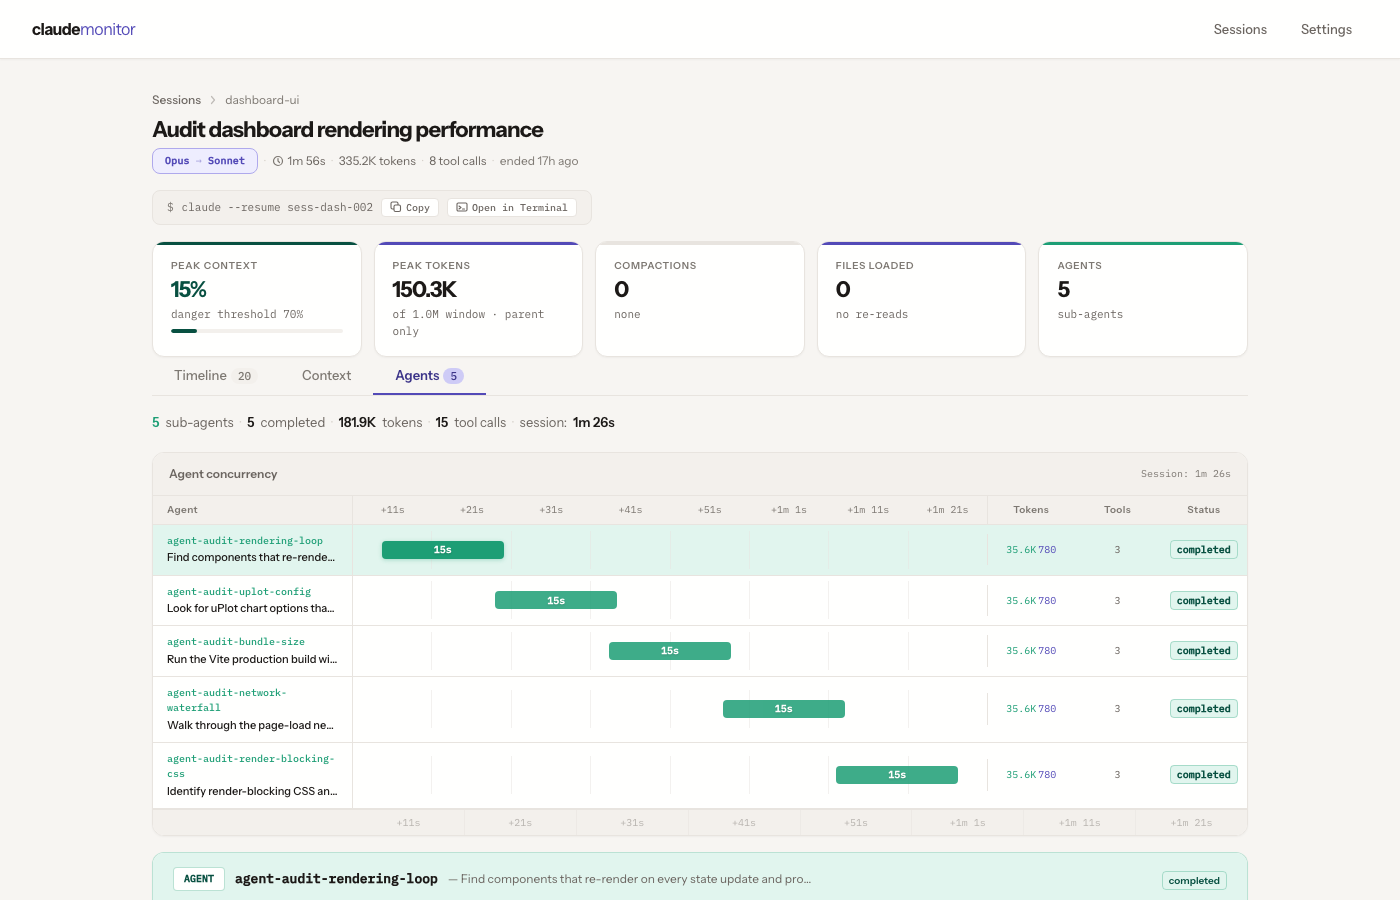
Agent Tree — Full sub-agent visibility with Gantt timeline, per-agent token costs, tool call breakdowns, compression ratios, and result classification. See which agents ran in parallel, which ones failed, and how much context each one consumed.
File Tracking — See every file loaded into context, how many times it was re-read, and how many tokens each file consumed. Spot wasteful re-reads and files that bloat your context window.
Resume in Terminal (macOS & Windows) — One click opens your terminal in the session's project folder with claude --resume <id> already running. macOS uses Terminal.app or iTerm2; Windows auto-detects Windows Terminal, then PowerShell, then cmd.exe. Pick your preferred app in Settings — the dropdown is platform-aware, and the button is disabled with a tooltip on unsupported platforms.
Shareable URLs — Filters, search, sort, project selection, the active session-detail tab, and the selected agent are all reflected in the URL. Reload preserves the view, links are shareable, and back/forward cycle through tabs naturally.
Background Re-import — Re-import every transcript from Settings without freezing the dashboard. The run happens in the background with a live progress bar — processed-of-total plus a phase label ("Importing transcripts…" then "Compacting database…") — and reattaches to an in-flight run if you reload the page mid-import. Starting a second re-import while one is running is rejected rather than launching a parallel pass, and the database is compacted automatically when the run finishes (search index consolidation + VACUUM) so repeated re-imports don't bloat the file on disk.
How It Works
The start command watches ~/.claude/projects/ for JSONL transcript files. Each transcript is parsed into thinking blocks, tool calls, token snapshots, and compaction events, then stored in a local SQLite database (~/.claude-monitor/data.sqlite). The dashboard reads from this database — no data leaves your machine.
CLI Reference
| Command | Description |
|---|---|
claude-monitor start |
Start dashboard + auto-import (default port: 4173) |
claude-monitor import [path] |
One-time import of transcripts (defaults to ~/.claude/projects/) |
claude-monitor status |
Show database stats and server status |
Options for start: --port, -p <number>, --no-open, --verbose
Options for import: --force (re-import existing sessions)
Status line link
Add a clickable 🔗 monitor link to your Claude Code status line — requirements and three setup pathsAdd a clickable 🔗 monitor link to your Claude Code status line that opens the current session straight in the dashboard. Claude Code hands your status line command the live session_id, and that id is exactly what the dashboard routes on — so the link always points at the session you're in (http://localhost:4173/#/session/<id>).
Requirements: a terminal that renders OSC 8 hyperlinks (iTerm2, Kitty, WezTerm — not Apple Terminal; tmux/SSH may strip them), jq, and a running claude-monitor start. The port defaults to 4173; override it with CLAUDE_MONITOR_PORT.
Set it up from scratch
No status line yet? This gets you one that shows just the link, in three steps.
Install
jqif you don't have it —brew install jq(macOS), or your package manager.Create
~/.claude/statusline.sh:#!/usr/bin/env bash INPUT=$(cat) SID=$(printf '%s' "$INPUT" | jq -r '.session_id // empty') if [ -n "$SID" ]; then printf '\033]8;;http://localhost:%s/#/session/%s\a🔗 monitor\033]8;;\a\n' "${CLAUDE_MONITOR_PORT:-4173}" "$SID" fiRegister it in
~/.claude/settings.json(create the file if it doesn't exist):{ "statusLine": { "type": "command", "command": "bash ~/.claude/statusline.sh" } }
Start a session with claude-monitor start running, then Cmd+click (macOS) / Ctrl+click the 🔗 monitor chip — it opens that session in the dashboard. From here you can grow the script however you like (folder, git branch, tokens…).
Already have a status line?
You know your own script — drop this block in wherever you want the link to sit (it assumes stdin is already captured, e.g. INPUT=$(cat)):
# clickable Claude Monitor link (OSC 8)
SID=$(printf '%s' "$INPUT" | jq -r '.session_id // empty')
if [ -n "$SID" ]; then
  printf '  \033]8;;http://localhost:%s/#/session/%s\a🔗 monitor\033]8;;\a' "${CLAUDE_MONITOR_PORT:-4173}" "$SID"
fi
Or let Claude do it
Don't want to touch shell scripts? Ask Claude Code to wire it up — in any session, say something like:
Add a clickable Claude Monitor link to my Claude Code status line that opens
http://localhost:4173/#/session/<session_id>for the current session, using thesession_idClaude Code passes to the status line command. Update my status line script (or create~/.claude/statusline.sh) and~/.claude/settings.json.
It'll read your current setup, drop in the OSC 8 snippet, and update settings.json for you.
A brand-new session is imported on a ~5s poll, so the link may briefly show "session not found" until its first import lands.
Uninstall
Remove claude-monitor completely — stop the process, delete data, uninstall the packageclaude-monitor stores all its state in a single directory and registers no system services, daemons, or login items. To remove it completely:
1. Stop any running instance. If claude-monitor start is running in a terminal, press Ctrl+C. To find a stray background process:
pgrep -fa claude-monitor
# then: kill <pid>
2. Delete the data directory. This removes the SQLite database and its WAL/SHM sidecar files — every imported session, event, and analysis result:
rm -rf ~/.claude-monitor
3. Uninstall the package (skip this step if you only ever ran it via npx):
npm uninstall -g @pigorv/claude-monitor
That's everything. claude-monitor never writes outside ~/.claude-monitor/, and ~/.claude/projects/ belongs to Claude Code itself — leave it alone unless you also want to delete your transcripts.
Built With
Development
Build and run from source — clone, build, and the dev scriptsgit clone https://github.com/pigorv/claude-monitor.git
cd claude-monitor
npm install
npm run build # Build CLI + frontend (one-time, required before dev:server)
npm run dev # Rebuild CLI on change (tsup --watch)
npm run dev:server # Run the rebuilt server on :4173 (node --watch)
npm run dev:frontend # Vite dev server on :5173 with HMR (proxies /api → :4173)
npm test # Run tests
npm run typecheck # TypeScript type checking
Contributing
See CONTRIBUTING.md for development setup and conventions.
License
Reviews (0)
Sign in to leave a review.
Leave a reviewNo results found