evident-charts
Health Pass
- License — License: MIT
- Description — Repository has a description
- Active repo — Last push 0 days ago
- Community trust — 47 GitHub stars
Code Pass
- Code scan — Scanned 12 files during light audit, no dangerous patterns found
Permissions Pass
- Permissions — No dangerous permissions requested
No AI report is available for this listing yet.
Teaches AI coding agents to make clear, honest charts, and checks each one before you see it. For Claude Code, Codex, Cursor, and more.
evident-charts
Teaches AI coding agents to make clear, honest charts, and checks each one before you see it. Works in Claude Code, Codex, Cursor, and more.
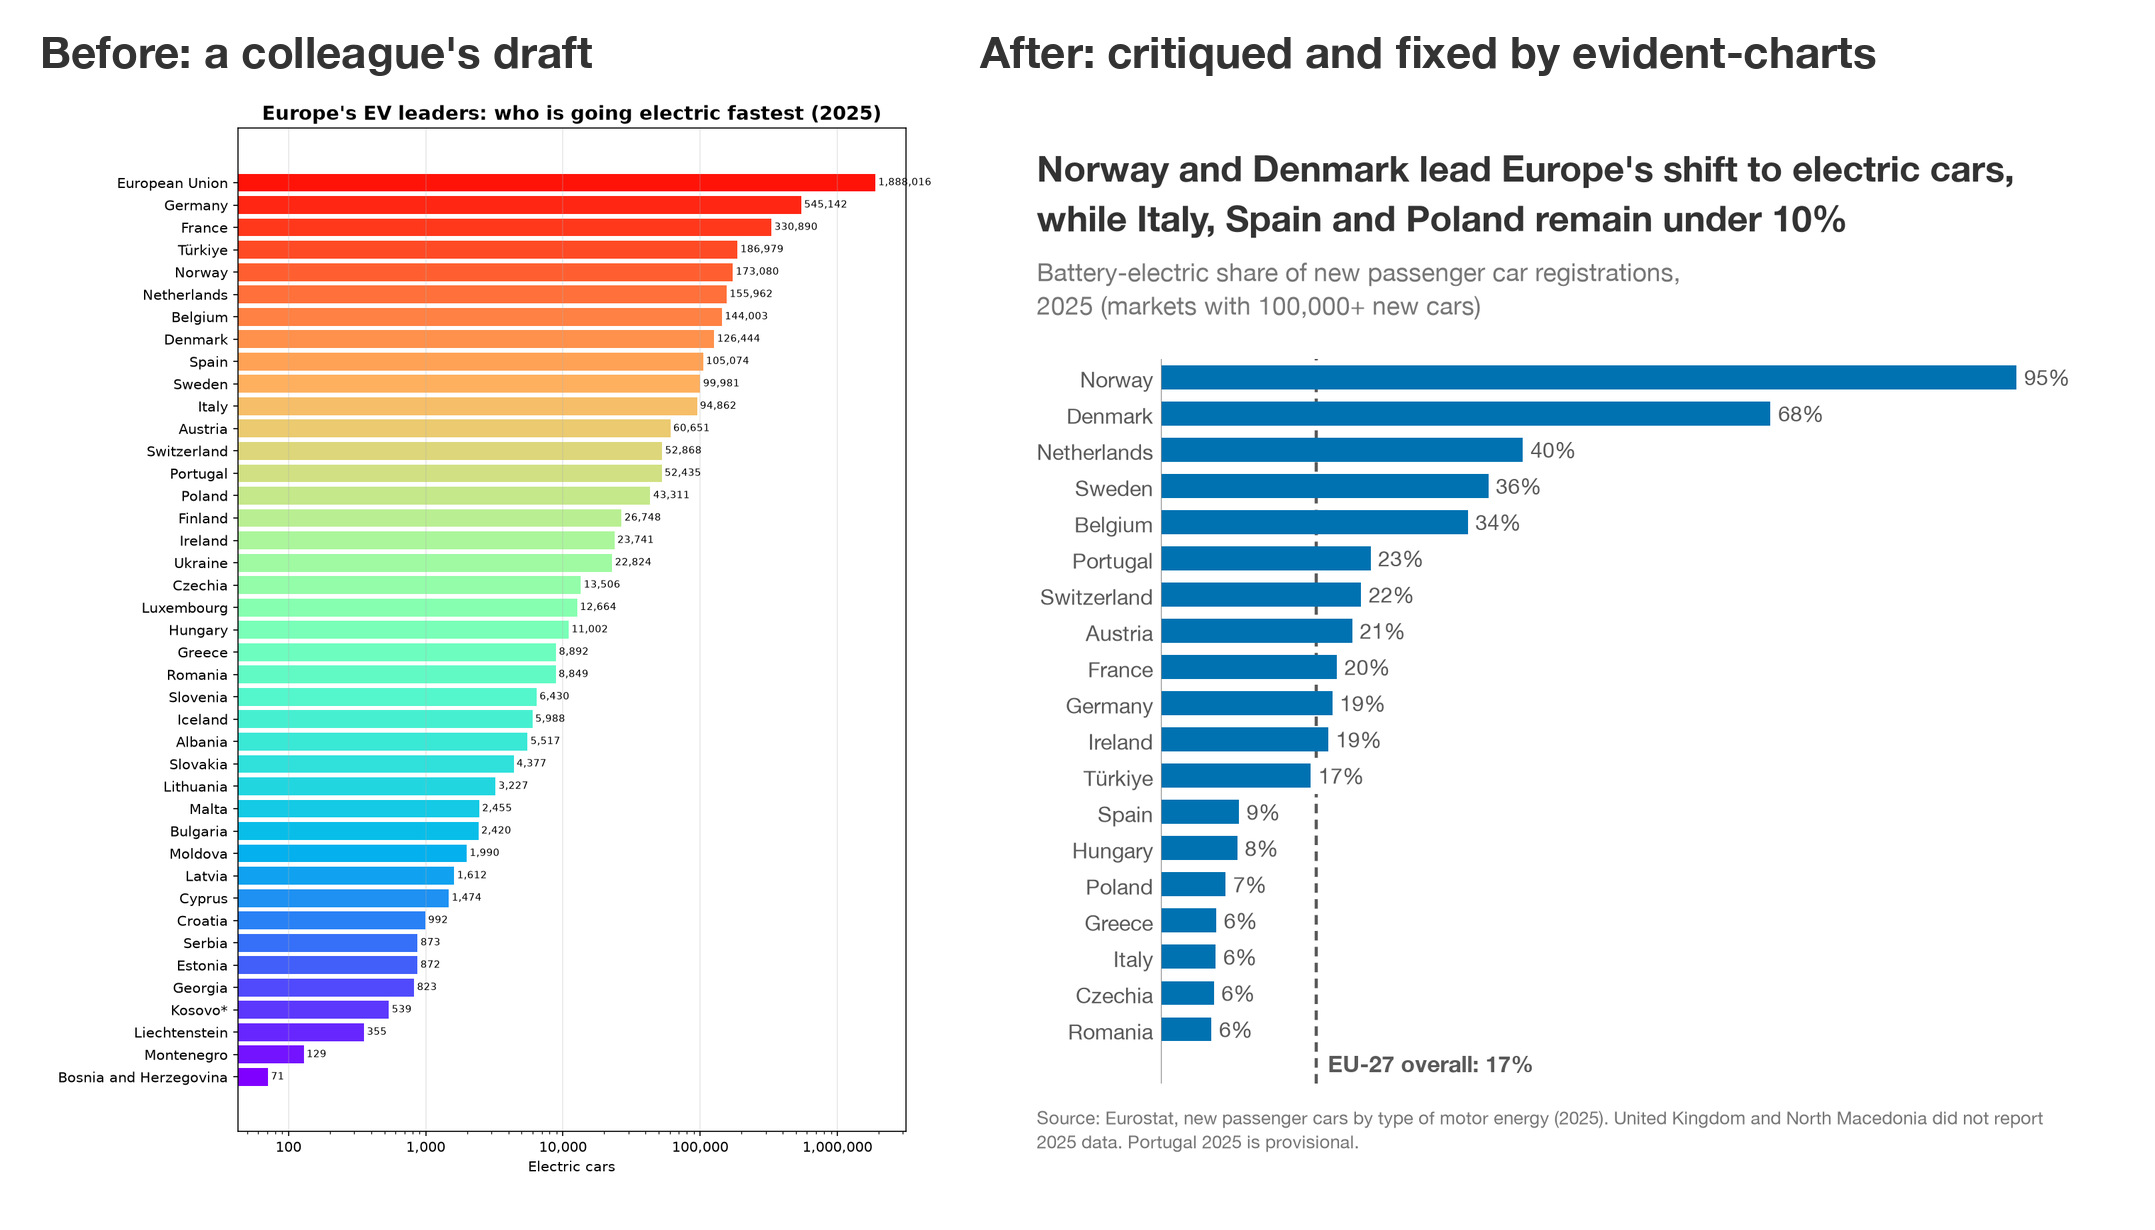
Left: a typical draft, with raw counts on a log scale, the EU total ranked among its own members, and rainbow colors that mean nothing. Right: the same data after evident-charts critiqued and rebuilt it.
Use
Ask for a chart the way you already do. The skill loads on its own whenever your agent makes or reviews a chart.
Chart sales.csv for a LinkedIn post on which regions grew fastest.
Make one slide showing where our budget went last year.
Critique this chart and fix it.        (attach the PNG, the script, or both)
What it does
- Checks the data first: totals mixed in with their parts, duplicate rows, placeholder codes, preliminary months.
- Picks the form from the point: a bar, a line, a table, or one big number.
- Writes the takeaway as the title and cites the real publisher, not the file name.
- Lints the chart in code (matplotlib directly; Plotly, Vega-Lite, ggplot2, and D3 through their SVG export): overlapping or clipped text, labels on data, bars that skip zero, dual axes, color-blind confusable colors, low contrast.
- Reviews the rendered image with a fresh reviewer that sees only the PNG, and fixes what it finds, up to three rounds.
- Critiques any chart you hand it, with ranked fixes that cite a rule.
Why
Charts from coding agents tend to share the same tells:
- A title that names the topic ("Revenue by region") instead of saying what the data shows
- A legend where labels on the data would fit, and rainbow colors that mean nothing
- Bars that start above zero, or two y-axes on one chart
- Numbers in annotations that were never checked against the data
- A guessed source line, or the file name standing in for one
- Leftover notes like "TODO" or "confirm" on the image
evident-charts checks for each of these before the chart reaches you: with scripts where a rule can be checked in code, and with a review of the rendered image where it can't.
Install
Claude Code
/plugin marketplace add rhiever/evident-charts
/plugin install evident-charts@evident-charts
Cursor and other Agent Skills agents
npx skills add rhiever/evident-charts
GitHub CLI
Set --agent to claude-code, codex, cursor, gemini, github-copilot, or antigravity.
gh skill install rhiever/evident-charts evident-charts --agent claude-code --scope user
Codex
codex plugin marketplace add rhiever/evident-charts
codex plugin add evident-charts@evident-charts
Gemini CLI
The --auto-update flag keeps it current.
gemini extensions install https://github.com/rhiever/evident-charts --auto-update
Requirements
Your agent runs the skill's check scripts on your machine with your project's Python. The data check needs pandas; matplotlib charts need matplotlib. Other libraries are checked through an SVG export in headless Chrome (Plotly's image export already installs one); without Chrome, only the chart-spec checks and the image review run.
Update
| Installed with | Update command |
|---|---|
| Claude Code | claude plugin marketplace update evident-charts && claude plugin update evident-charts@evident-charts |
| npx skills | npx skills update evident-charts |
| GitHub CLI | gh skill update evident-charts |
| Codex | codex plugin marketplace upgrade evident-charts && codex plugin add evident-charts@evident-charts |
| Gemini CLI | gemini extensions update evident-charts (automatic with --auto-update) |
How the rules work
Each rule carries a tag for how well it is supported: [E] experimental evidence, [P] practitioner consensus, [T] taste or convention. Your project's style guide overrides the house look and any [T] rule, but never an [E] integrity rule such as bars starting at zero. Every rule is cited in references/sources.md.
Works with
- Libraries: matplotlib (the default, with a helper and the lint script), seaborn, pandas
.plot, ggplot2, Plotly, Vega-Lite and Altair, and D3. House themes for the last four are inassets/themes/. - Sizes: presets for blogs, X, LinkedIn and Instagram, slides, reports, and phones.
Contributing
Issues and pull requests are welcome. AGENTS.md covers the tests and the rule format; changes are listed in the changelog.
License
MIT. Built by Randy Olson.
Reviews (0)
Sign in to leave a review.
Leave a reviewNo results found