Claude-code-on-AWS-Bedrock-Token-monitoring-alarm-system
Health Warn
- License — License: MIT
- Description — Repository has a description
- Active repo — Last push 0 days ago
- Low visibility — Only 8 GitHub stars
Code Warn
- fs module — File system access in .github/workflows/sdlc-gate.yml
- process.env — Environment variable access in .github/workflows/ui-qa-agent.yml
- fs module — File system access in .github/workflows/ui-qa-agent.yml
Permissions Pass
- Permissions — No dangerous permissions requested
No AI report is available for this listing yet.
AWS Bedrock token monitoring & cost governance platform — ML-powered anomaly detection, automated alerting, forensic analytics, real-time dashboard. Built with CDK, Lambda, CloudWatch, Athena, EventBridge, React. Multi-tenant, production-ready.
Token Usage Monitoring System
A cross-industry, multi-tenant platform for monitoring Amazon Bedrock token usage,
detecting cost anomalies, automating incident response, and running forensic analytics —
deployable into any AWS account. Built AWS-native with the
AWS Well-Architected Framework.
Vendor-neutral and customer-agnostic. No customer-specific names, accounts, or data are
baked into the code — everything customer-specific is configuration.
Executive summary
Organizations running Bedrock-based workloads (coding assistants, RAG, agents) need to account
for token consumption with the same rigor as any other cloud cost. That is harder than it looks,
for reasons specific to how Bedrock works:
- Native CloudWatch alarms rely on static thresholds that must be set manually and re-tuned
as usage grows. - Bedrock is a usage-billed API. Unlike consumer Claude subscription plans (which ration
usage on a rolling window), it provides no quota that auto-resets to cap spend — its token
quotas are rate limits, not cost caps. - Bedrock invocation logs record the IAM caller, but not an application-level user or project,
so attributing cost to a team requires additional tagging. - Workloads that reuse context generate large volumes of prompt-cache reads, billed at a
fraction of the standard input rate — so raw token totals overstate the real bill.
This platform addresses three recurring questions when operationalizing Bedrock cost:
| Concern | What it provides |
|---|---|
| Observability — proactively track & alert on token cost | Layered: CloudWatch metrics, AWS Cost Anomaly Detection (ML, learns a baseline instead of fixed thresholds), forecasted AWS Budgets, and forensic Athena analytics — in one dashboard. |
| Controls — prevent cost spikes | AWS Budgets Action can apply a restrictive IAM policy at a spend threshold (a hard cost cap); Service Quotas bound per-model throughput; an opt-in, off-by-default automated-response path can contain an offending principal. |
| Operating practices — keep cost predictable | Enable invocation logging on day one; tag requests for project/user attribution; tier models by task; and report prompt-cache reads separately so reported cost reflects the actual bill. |
Scope of what the platform adds. It does not change Bedrock's pricing or behavior. Its
contribution is to measure, attribute, and present usage and cost accurately, and to wire
native AWS governance (anomaly detection, budgets, quotas) into a single, deployable, multi-tenant
system. Separating prompt-cache reads (priced at the documented 0.1x input rate) from standard
input tokens yields a materially lower — and more accurate — cost figure than a raw token count
implies; the magnitude depends on a given workload's cache-hit ratio.
Features
In the dashboard (operator-facing)
- Usage — hourly token time series + a Bedrock token-quota / throttle headroom panel
- Cost — estimated spend per model + a prompt-cache savings KPI
- By Project — per-project/user attribution; fast (DynamoDB) / full (Athena + names) toggle
- Governance — budget status (limit / actual / forecast) + enforcement posture
- Anomalies — anomaly & alert feed with severity
- Cognito sign-in; per-tenant isolation on every request
Behind the scenes
- Data plane — Bedrock Model Invocation Logging -> S3 (KMS) -> Glue + Athena workgroup
- Aggregation — EventBridge-scheduled Lambda (every 15 min) folds logs into DynamoDB
(idempotent, watermarked), including per-project rollups for fast reads - Anomaly detection — AWS Cost Anomaly Detection (ML) -> SNS
- Automated response — CloudTrail -> EventBridge -> Lambda -> SNS, with a dead-letter queue;
opt-in per-principal containment (self-lockout guarded) - Cost controls — AWS Budgets (actual + forecasted) + opt-in Budget Action hard-stop;
Service Quotas headroom surfaced - Heavy ETL — Step Functions -> ECS Fargate (daily) compacts raw logs to partitioned Parquet
- API — 7 REST endpoints behind a Cognito authorizer, least-privilege IAM per function
- Forensics — parameterized, tenant-scoped Athena query templates
- Integration — a request-metadata tagging helper for project/user attribution
- Audit — CloudTrail trail; CloudWatch metrics & alarms
Platform
- AWS CDK (TypeScript), 8 independently deployable stacks, config-driven, any AWS account
- Multi-tenant (JWT tenant claim); CI/CD (GitHub Actions + GitLab CI)
- KMS encryption at rest, TLS in transit, no public buckets, WAF, scoped IAM
Architecture at a glance
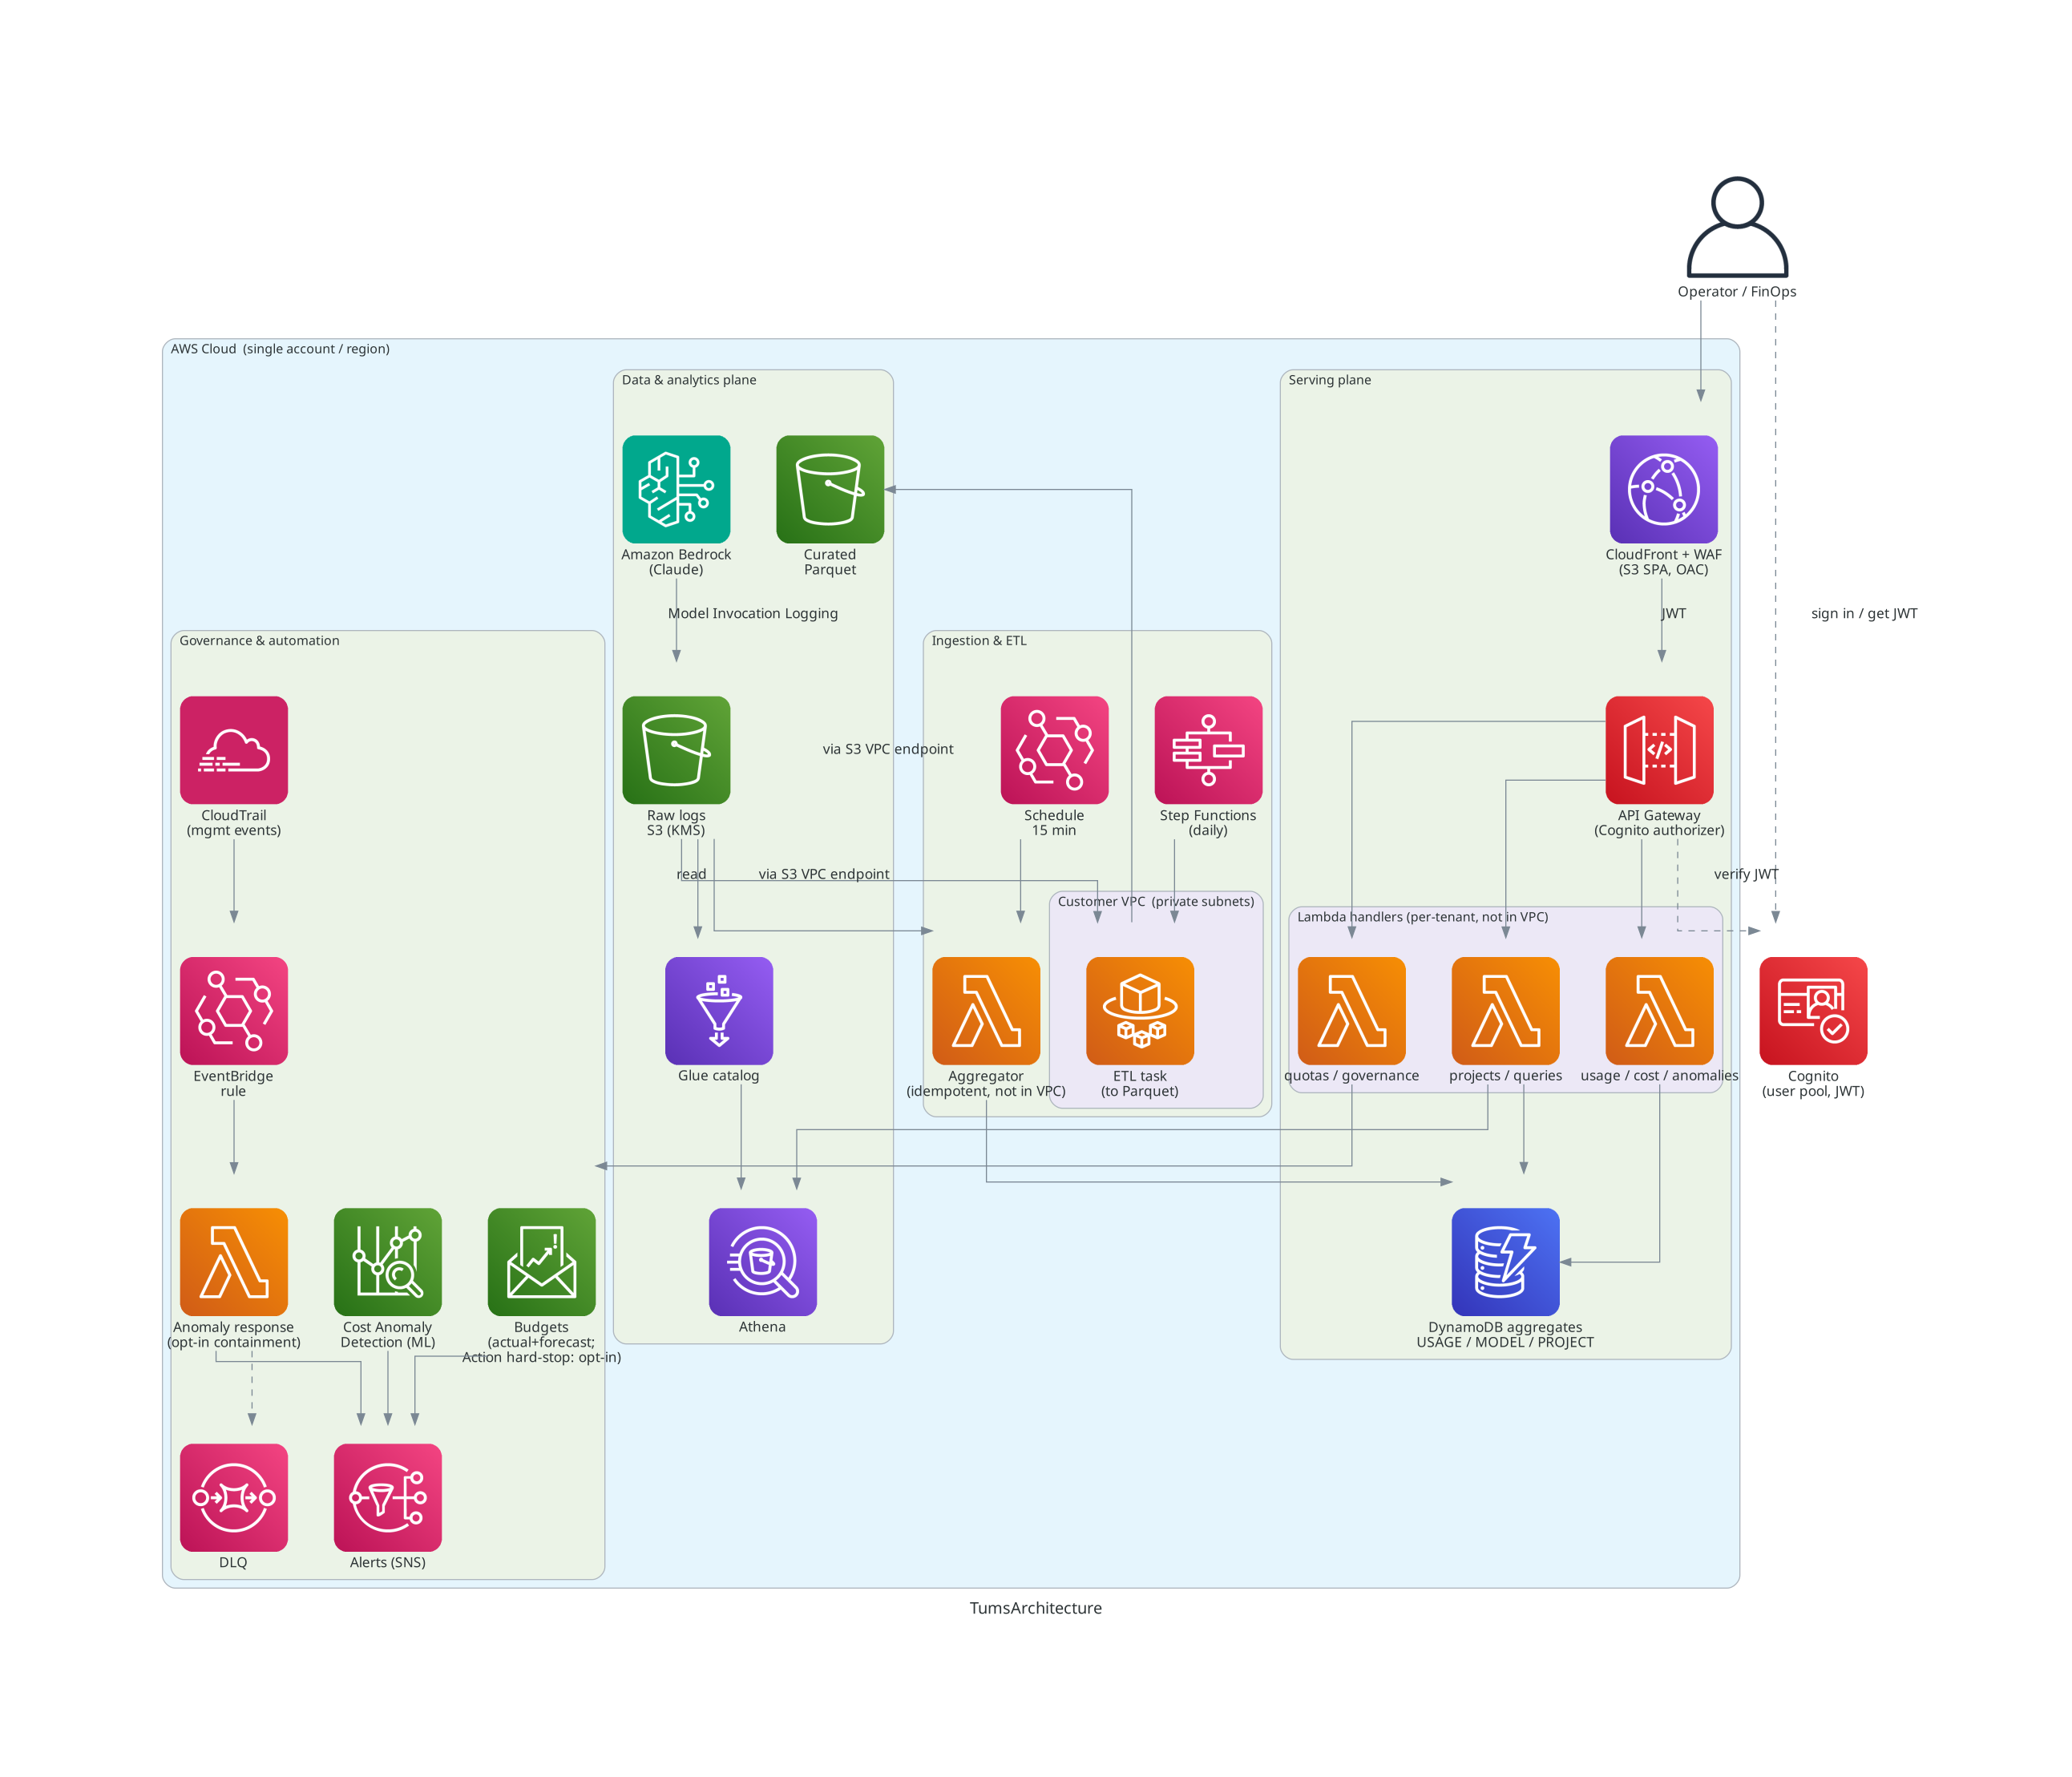
How the data flows
The system is organized around one user-facing request path, supported by two background
flows that supply its data and guard its cost. Everything runs inside a single AWS account /
region; only the Fargate ETL task runs inside a VPC (private subnets), reaching S3 through a
VPC gateway endpoint — the serverless API and ingestion paths intentionally stay outside the VPC.
Main path — from sign-in to seeing data (real-time, synchronous)
- The user signs in to Cognito and receives a short-lived JWT.
- The browser loads the dashboard Single-Page Application (SPA) from CloudFront (+ WAF),
served from a private S3 bucket via Origin Access Control. - The SPA calls API Gateway with the JWT; its Cognito authorizer verifies the token before
any request reaches the backend. - Requests fan out to per-route Lambdas (concurrently): Usage / Cost / Anomalies read
pre-aggregated KPIs from DynamoDB (single-digit-ms hot path); By-Project / Forensic
queries use Athena (By-Project can also take a fast DynamoDB path); Governance reads
AWS Budgets; Quotas reads CloudWatch + Service Quotas. Every request is scoped by the
JWT's tenant claim.
The data read in step 4 is prepared ahead of time by the background flows below — it is not
computed on the fly.
Background flow 1 — ingestion & aggregation (driven by Bedrock traffic, runs alongside the main path)
Each call an application makes to Amazon Bedrock is written by Model Invocation Logging to
S3 (KMS-encrypted). Every 15 minutes an EventBridge-scheduled Aggregator Lambda reads new
logs and folds them into per-tenant / per-model / per-project KPIs in DynamoDB (idempotent,
watermarked) — the source the main path reads from. Once a day, Step Functions runs the
in-VPC Fargate ETL task, which reads raw logs through the S3 VPC gateway endpoint and compacts
them into partitioned Parquet to cut Athena scan cost; raw logs are also catalogued by Glue
for Athena queries.
Background flow 2 — governance & alerting (automatic, independent of whether anyone is signed in)
Three mechanisms guard cost and access concurrently and independently: CloudTrail Bedrock
management events trigger an EventBridge rule and an anomaly-response Lambda (publishes an
SNS alert, with a dead-letter queue on failure; if enabled — off by default — it can contain an
offending IAM principal); Cost Anomaly Detection continuously analyzes spend with ML and alerts
on deviations; AWS Budgets alerts at actual/forecasted thresholds and can optionally apply a
Budget Action hard-stop (a restrictive policy) at the cap. The two enforcing actions are
opt-in and off by default.
- Full design:
docs/ARCHITECTURE.md - Well-Architected review (6 pillars):
docs/WELL_ARCHITECTED.md
Documentation
| Doc | What |
|---|---|
docs/ARCHITECTURE.md |
System design, components, CDK stack decomposition |
docs/WELL_ARCHITECTED.md |
Mapping to the six AWS Well-Architected pillars |
docs/MONITORING_APPROACH.md |
Source-verified monitoring mechanisms (metrics, logging, anomaly detection) |
docs/GOVERNANCE_FAQ.md |
Cost governance FAQ — observability, controls, operating practices |
docs/ATTRIBUTION.md |
Per-user / per-project usage attribution model |
docs/INTEGRATION.md |
Customer integration: request-metadata tagging helper |
docs/MULTI_TENANCY.md |
Tenant isolation model |
docs/VERIFICATION.md |
Architecture validation + real-data schema findings |
docs/ROADMAP.md |
Honest gap analysis — what's validated vs planned |
docs/test-reports/ |
Per-feature test reports (unit + real-AWS validation) |
CHANGELOG.md |
Notable changes by milestone |
docs/DEPLOYMENT.md |
Step-by-step deploy guide |
AGENTS.md |
Guidance for AI coding agents working in this repo |
Tech stack
| Layer | Technology |
|---|---|
| IaC | AWS CDK (TypeScript) |
| Compute | Hybrid — Lambda (API/events) + ECS Fargate (heavy ETL) |
| API | API Gateway (REST) + Cognito authorizer |
| Front-end | React + Vite + TypeScript |
| Hosting | S3 + CloudFront (Origin Access Control) |
| Data | S3 + Glue + Athena (+ Parquet), DynamoDB |
| Automation | EventBridge, Step Functions, SNS |
| Governance | Cost Anomaly Detection, AWS Budgets |
Repository layout
.
├── docs/        Architecture, Well-Architected review, monitoring approach, ADRs, runbooks
├── infra/       AWS CDK app — Network/Data/Logging/Auth/Api/Automation/Etl/Frontend stacks
├── backend/     Lambda handlers + shared libs + Fargate ETL job
├── frontend/    React + Vite dashboard SPA
├── .github/     CI/CD workflows
└── scripts/     bootstrap / deploy / teardown helpers
Prerequisites
- An AWS account + credentials (
aws configure) with permission to deploy the stacks. - Node.js 20+, npm, AWS CDK v2 (
npm i -g aws-cdk), Docker (for Fargate image + Lambda bundling). - Amazon Bedrock model access enabled in your target Region.
Quick start
# 1. Install everything (infra + backend + frontend)
make install

# 2. Run the test + build + synth gates (no AWS account needed)
make test          # backend unit tests
make build         # backend type-check + frontend build
make synth ENV=ci  # cdk synth using the tracked placeholder config

# 3. Configure your own environment to deploy
cp infra/lib/config/example.env.json infra/lib/config/dev.json
$EDITOR infra/lib/config/dev.json     # set "account" and "region"

# 4. Bootstrap CDK once per account/region, then deploy
cd infra && npx cdk bootstrap && cd ..
make deploy ENV=dev

# 5. Build & publish the dashboard (prints the CloudFront URL)
make deploy-frontend ENV=dev
make help lists all targets. Full step-by-step (including teardown) is indocs/DEPLOYMENT.md. AI coding agents: see AGENTS.md.
Status
Functionally complete and validated end-to-end against a real AWS account: data pipeline
(Bedrock logging → S3 → Athena), ingestion aggregator, REST API (usage / cost / anomalies /
projects / quotas / governance / forensic queries), Cognito auth, and a React dashboard with
Usage, Cost, By-Project, Governance, and Anomalies pages, plus event-driven anomaly response.
The full cost-governance feature set (issues #1–#9) is implemented and validated — ML cost
anomaly detection, token-quota/throttle monitoring, prompt-cache savings, opt-in Budget Action
hard-stop + per-principal enforcement, request-metadata tagging helper, per-project
pre-aggregation, Fargate ETL, and CORS/custom-domain hardening. See CHANGELOG.md,docs/ROADMAP.md, and docs/VERIFICATION.md.
Two items remain intentionally pending real-AWS exercise (off-by-default, risk-managed): the live
Budget Action freeze (needs a throwaway test IAM role) and the Fargate ETL Parquet run
(needs the Etl stack deployed). Both are marked 🟡 in the roadmap.
Agent-driven QA: the PR #30 convergence case
This repo is also the live target of an AgentCore-powered QA↔Bug-Fix loop
(.github/workflows/ui-qa-agent.yml): on every PR, a
UI-testing agent deploys the branch, explores the live dashboard in a real browser, and files
findings; a second Bug-Fix agent patches what is fixable and pushes an auto-fix commit, which
re-triggers the loop — until the QA agent reports zero blocking findings (goal-driven exit),
two consecutive rounds make no progress (stall breaker → human hand-off), or an absolute
round fuse blows.
PR #30
is the first full convergence, and every round is preserved as a PR comment with a per-finding
reconciliation table (FIXED / STILL_FAILING):
- Trajectory: 9 → 5 → 4 → 1 → 0 blocking findings, across 10 auto-fix rounds plus one
human-review pass for data-layer issues the agent correctly refused to guess at (real pricing
rates, dedup policy) — it pinned those as failing tests instead. - Real bugs found and fixed by the loop (exploratory, not seeded): missing model pricing
rows rendering $0.00, duplicate rows from ARN-vs-bare-id model keys, a mathematically
impossible "774% lower" cache-savings claim, negative input-token displays, cross-page cost
totals disagreeing by 30%+, a page-crashing React hook regression, and misleading
status-badge copy. - Final lesson (fixed in
ci-agent/qa_agent.py): the loop's last two "failures" were the
CI parser, not the app — an emptyfindings: []array (a valid green report) was treated as
a missing report, and a salvage fallback fabricated a phantom finding from the transcript's
own description of an already-fixed bug. An agent pipeline's report parser must treat
"explicitly nothing found" and "no report" as different states.
Validation gates
CI (GitHub Actions and GitLab CI) runs, and any change must pass:
cd backend && npm test— Jest unit testscd backend && npx tsc --noEmit— type-checkcd frontend && npm run build— frontend buildcd infra && npx cdk synth --context env=ci— infrastructure synthesis
License
MIT — see LICENSE. Suitable for public release.
Reviews (0)
Sign in to leave a review.
Leave a reviewNo results found