oddyssey
Health Warn
- License — License: MIT
- Description — Repository has a description
- Active repo — Last push 0 days ago
- Low visibility — Only 5 GitHub stars
Code Fail
- rm -rf — Recursive force deletion command in .github/workflows/release.yml
Permissions Pass
- Permissions — No dangerous permissions requested
No AI report is available for this listing yet.
CLI toolbox for Observability-Driven Development (ODD): coding agents observe local runs on an OpenTelemetry/Grafana stack - or remote ones on any OpenTelemetry backend - and feed the next spec-driven improvement loop.
oddyssey
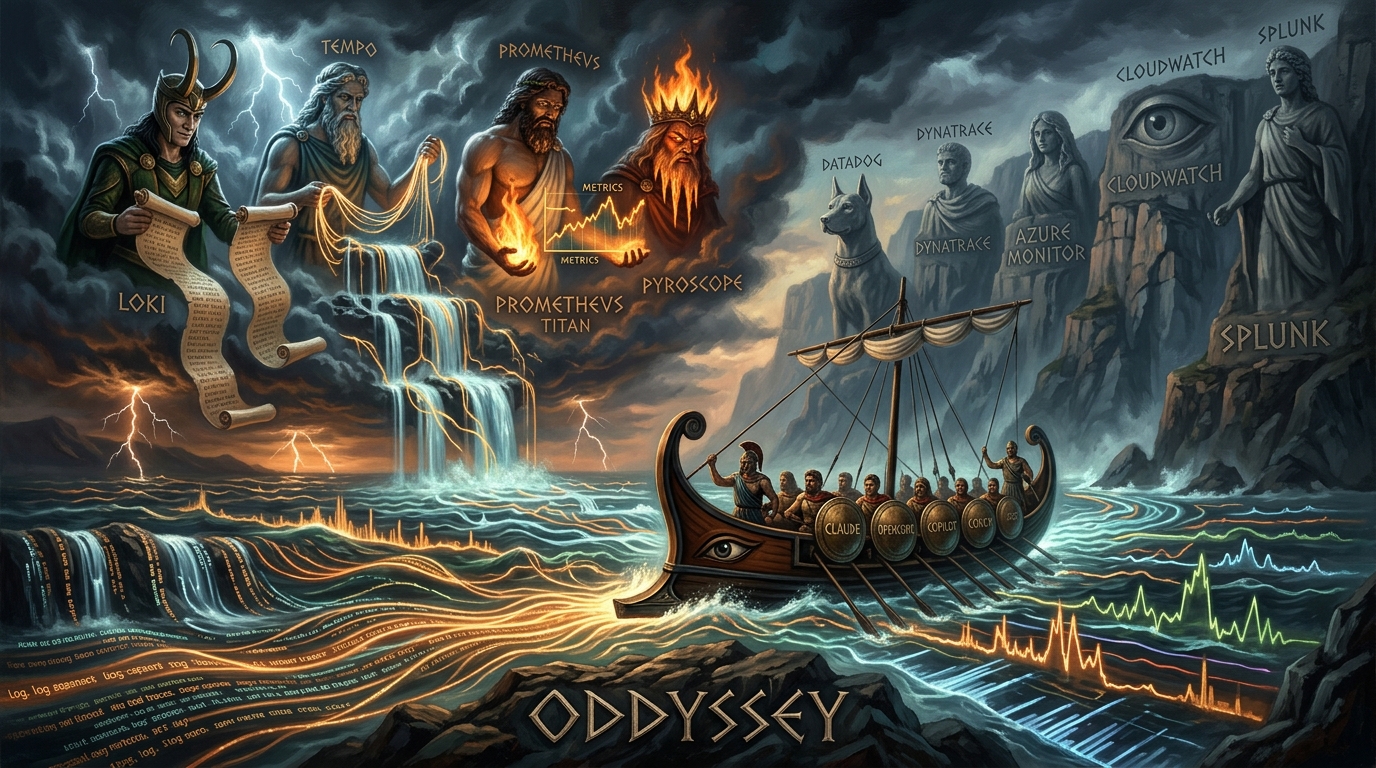
A CLI toolbox for Observability-Driven Development (ODD).


Install
With APM (every CLI)
With APM, for Claude Code:
uvx --from 'apm-cli==0.28.0' apm install --global --target claude using-system/oddyssey
Same command for every other supported CLI agent — swap the target:--target opencode, copilot, kiro, cursor, codex, gemini,windsurf. Drop --global to install into the current repository
only.
To update an existing install to the latest version:
uvx --from 'apm-cli==0.28.0' apm update --global --target claude using-system/oddyssey
It shows the update plan and asks for confirmation (--yes to skip,--dry-run to only look); apm outdated tells you whether an update
is worth running.
From the native marketplaces (no APM)
Claude Code
/plugin marketplace add using-system/oddyssey
/plugin install oddyssey@oddyssey-plugin
GitHub Copilot CLI
copilot plugin marketplace add using-system/oddyssey
copilot plugin install oddyssey@oddyssey-plugin
Kimi Code
/plugin marketplace add using-system/oddyssey
/plugin install oddyssey@oddyssey-plugin
Codex — this repository publishes the Codex manifest at.agents/plugins/marketplace.json; add the repository as a plugin
source in your Codex plugins settings.
The native artifacts are generated from the APM package on every
release (marketplace/, built by scripts/build-marketplace.sh) and
carry the same agents, commands, skills, and pinned MCP server. The
other CLIs (opencode, Cursor, Windsurf, Kiro, Gemini) install via APM
above.
The idea
ODD complements Spec-Driven Development: observe a running service — local
or remote — through its telemetry, turn what you see into the next SDD wave
(spec, plan, implement), then observe again. A continuous improvement loop,
indefinitely.
Everything is built on OpenTelemetry. For local observation, the MCP
server pilots a complete Grafana stack (UI, traces, metrics, logs,
profiles) that agents use to observe and fix. For remote stacks,
observation works against Grafana or any other OpenTelemetry backend
(Datadog, Dynatrace, Azure Monitor, CloudWatch, Splunk, ...).
oddyssey provides:
- an OpenTelemetry expert (
otel-instrumentation-expert)
that investigates your stack and hands your CLI agent everything needed
to integrate OpenTelemetry and deploy collectors; - a run investigation agent (
observe-run),
local or remote, that delivers a complete observation report your CLI
agent turns into a spec-driven plan of fixes and improvements; - a complete local observability stack based on Grafana, piloted by
the oddyssey MCP server; - an ODD memory carried by the repo itself — every observation and
instrumentation report lands in.odd/, committed and versioned with
the code, shared with the whole team, and recalled as the baseline of
the next run: the loop accumulates knowledge instead of starting
blind.
Everything is packaged for any coding agent
(APM: Claude Code, Copilot, Cursor,
Codex, Gemini, and friends).
How to
The loop in three prompts — every example below links to a real artifact
from this repository: oddyssey instrumented, observed, and verified its
own MCP server.
Step 1 — Instrument OpenTelemetry.
/odd-instrument add OpenTelemetry to my project XXX
The otel-instrumentation-expert agent investigates the codebase,
stores its report in .odd/otel-instrumentation-reports/ (committed —
the next investigation starts from it), and hands back everything a
spec-driven wave needs. Real output of that wave on this repo: the
design spec
and the
implementation plan
generated with superpowers from
the agent's investigation report.
Step 2 — Observe a local run.
/odd-observe check that my project XXX starts and answers requests on the /user endpoint
The observe-run agent drives the run, queries the telemetry, and
stores its report in .odd/observe-run-reports/ — findings, evidence,
and the replay protocol the verification will consume. Real example: the
first observation report
(4 confirmed findings) and the
fix-wave plan
the next SDD wave built from it.
Step 3 — Verify the fixes the SDD wave delivered.
/odd-verify check that report XXX from .odd has been fixed
The same agent replays the stored report's protocol and rules on every
recorded item — before-value, after-value, pass criterion. Real example:
the
verification report
— 9/9 checks pass, all 4 findings fixed, measured not assumed.
Step 4 — Deploy and observe remotely.
Let the deployment run for a while first — a remote observation needs
real traffic history to read, not a freshly booted service. Then point
the missions at the remote stack: its CLI must be configured
beforehand (gcx for a Grafana stack), and /odd-config is the
guided way to switch and prove the connection before any mission runs.
/odd-config switch to grafana
/odd-observe what did my service XXX do over the last 24 hours?
Or in a single prompt — naming the stack in the mission switches the
configuration too:
/odd-observe what did my service XXX do over the last 24 hours on my stack grafana?
And the loop starts again: an SDD wave from the remote observation, a
local observe, a verify — and on it goes.
Miscellaneous prompts
/odd-status
/odd-status
/odd-status where is the loop for my service XXX
/odd-status what was observed on prod for my service XXX
Answers "where is the loop?" from the committed .odd/ history and git
alone — no backend queries, no report written. Renders per-service loop
state (last observation, last verification and its verdict, the
observed → fixed → verified chain), the findings ledger as a burn-down,
trends across runs from the stored numbers, telemetry gaps not yet
closed, and a next recommended action (verify, observe, or rest) that
cites its inputs. Optionally scope it to a service, a stack, or an
environment: /odd-status checkout on local.
More invocation examples for every prompt live in
docs/guide/prompts.md.
The ODD principles
- The system must be observable locally. Prefer a docker-compose
that starts your whole stack, and mocks for the remote systems it
queries — the oddyssey MCP server provides the local observability
backend the telemetry lands in. - Instrument with the expert. Bring OpenTelemetry into your
services through theotel-instrumentation-expertagent rather than
by hand. - One design loop, always the same. Every feature follows: SDD to
develop it → observe a local run → fix and improve → repeat those
last two steps until satisfied. Then deploy to the target
environments. After some time, run a remote observation on the
deployed environment's stack to seed the next SDD wave — and the
loop starts again from the local run. - Maturity spaces observation out. The time between remote
observations grows as the service matures: a young service gets
observed often, a stable one only when something is worth learning. - Evidence over impressions. Every claim about a service comes from
a query and its result — numbers, trace IDs, log lines — never "it
seems faster". - Cross-confirm before concluding. Never conclude from one signal
what two could confirm (traces, metrics, logs, profiles); a
single-signal anomaly is always labeled as such. - The memory lives with the code. Observation reports are stored in
the observed repo under.odd/— version that directory (do not add
it to.gitignore): the reports get reviewed in PRs, shared by the
whole team, and the git history reads observed → fixed → verified. - Verify by replaying, not by re-measuring differently. A fix is
proven by replaying the recorded scenario identically; one changed
variable invalidates the before/after comparison. - What's missing is a finding too. Telemetry gaps — absent spans,
logs without trace IDs, missing histograms — are deliverables of the
observation and feed the next instrumentation wave. - One telemetry, two consumers. The metrics, traces, and logs do not
serve ODD alone: the same data feeds classic runtime observability —
dashboards, alerting, incident investigation. Instrument once, and the
development loop and the operation of the system read from the same
source of truth. - Agents observe, they never fix. The investigation agents only
observe and report — they never modify the code directly. Their report
is a universal input: feed it to any spec-driven framework for the
spec-and-implement wave, turn it into JIRA tickets, or hand it to a
human — what happens next stays your call.
Prerequisites
- Docker — runs the local
observability stack (the MCP server drives it directly). - gcx — required only when observing
a Grafana backend (the local stack, self-hosted, or Grafana Cloud):brew install gcx, orcurl -fsSL https://raw.githubusercontent.com/grafana/gcx/main/scripts/install.sh | sh. - Other backends need their own CLI, each covered by the
observability-cli-guides
skill: Datadog (Pup), Dynatrace
(dtctl), Azure Monitor
(az), AWS CloudWatch/X-Ray (aws), Splunk (splunk).
The MCP server
One job: pilot a local Grafana stack with an OpenTelemetry endpoint.
One container (grafana/otel-lgtm,
pinned, its definition embedded in the server — Docker is the only
prerequisite) exposes Grafana on :3000 and OTLP on :4317/:4318; apps
export their telemetry there. Tempo traces, Prometheus metrics, Loki
logs, and Pyroscope profiles are all queried through the Grafana proxy
(:3000/api/datasources/proxy/uid/...), so the same paths work against any
Grafana; on remote stacks the backend behind it can be something other
than the local otel-lgtm container.
| Tool | What it does | Params |
|---|---|---|
odd_stack_up |
Start the local stack and wait until it is ready | env (optional) — container environment; applies at creation only |
odd_stack_down |
Destroy it — stored telemetry does not survive | — |
odd_stack_status |
Probe whether it is up | — |
odd_stack_reset |
Wipe all stored telemetry and return a fresh, ready stack — the next run starts from a clean slate | env (optional) — always applies, the container is recreated |
odd_config_get |
Read the global configuration — stack backend and local host ports | — |
odd_config_set |
Update it — a port change resets the stack so the new value applies right away | config — partial merge, e.g. {"local": {"grafana_port": 3300}} |
The server is instrumented with OpenTelemetry and, by default, exports its
own traces and metrics to the local stack (http://localhost:4318, OTLPhttp/protobuf — the protocol is fixed, OTEL_EXPORTER_OTLP_PROTOCOL set
to anything else is not honored). Any OTEL_* variable set in the MCP
client's env block overrides the defaults, and OTEL_SDK_DISABLED=true
turns telemetry off entirely. When the stack is down, telemetry is silently
dropped — the normal state, and never a failure of the server.
The agents and skills
| Primitive | Role |
|---|---|
otel-instrumentation-expert (agent) |
Investigate a codebase and hand back every input for a spec-driven plan to implement OpenTelemetry: stack inventory, per-service approach sourced from the official docs, open decisions, verification protocol |
observe-run (agent) |
Observe a running service — on the local stack or any remote backend — through its telemetry (metrics, traces, logs, profiles) and hand back every input for a spec-driven plan of fixes and improvements |
otel-guides (skill) |
Curated map of the official OpenTelemetry docs: every supported language plus the cross-language guides (SDK configuration, semantic conventions, Collector deployment) |
setup-local-stack (skill) |
Configure gcx against the local stack without touching the user's contexts, with the datasource UIDs and the push-model caveats |
check-backend-configuration (skill) |
Before a run: display the configured stack's CLI context, prove it is connected, and guide the user through the backend's setup — never authenticates on their behalf |
update-backend-configuration (skill) |
Owns the backend switch: the target's CLI checked for presence with a guided install offer, the switch persisted through odd_config_set, the per-stack stack_config values persisted, and the verification handed back to check-backend-configuration |
observability-cli-guides (skill) |
Curated map of every major backend's terminal query surface: Grafana (gcx), Datadog (Pup), Dynatrace (dtctl), Azure Monitor (az), CloudWatch (aws), Splunk |
run-scenario (skill) |
Drive a reproducible request scenario against a local service and record it verbatim, so the same numbers are measurable before a fix and after it |
create-observe-run-report (skill) |
The ODD loop's memory: persist each observation report into the observed repo (.odd/observe-run-reports/) and recall the previous ones as the next run's baseline |
create-otel-instrumentation-report (skill) |
Same memory for the instrumentation side: persist each investigation into the investigated repo (.odd/otel-instrumentation-reports/) and recall it before the next one |
/odd-observe (prompt) |
Entry point: build a well-formed mission from your arguments and invoke the observe-run agent |
/odd-instrument (prompt) |
Entry point: point the otel-instrumentation-expert agent at a codebase |
/odd-verify (prompt) |
Entry point: replay a stored report's protocol through the observe-run agent — a full observation report again, this time ruling on everything the previous one recorded: measurements, anomalies, telemetry gaps |
/odd-status (prompt) |
Where is the loop? Per-service state, findings ledger, trends, open telemetry gaps, and the next recommended action — read from the .odd/ history and git alone, no backend queries |
/odd-config (prompt) |
Show the configured backend — stack, targeted instance, connection proof — and guide a backend switch through the update-backend-configuration skill |
The loop: investigate (agents) → spec & implement (the main
agent's spec-driven workflow) → observe again — telemetry on both
ends. Each observation report is stored in the observed repo
(.odd/observe-run-reports/), versioned by git and shared with the whole
team, and becomes the baseline the next run diffs against — the loop
accumulates knowledge instead of starting blind.
Who invokes what across all these components — prompts, agents, skills,
MCP tools — is mapped in
docs/guide/dependencies.md.
Development
The exact build, test, and lint commands live in
CONTRIBUTING.md — single source, matching what CI
enforces. In short: the project under src/ is a self-contained uv
project (own pyproject.toml); tests/ mirrors src/.
Contributing
Issues, docs fixes, and code are welcome — see
CONTRIBUTING.md for the layout, the exact build/test
commands, and the PR conventions (squash titles drive the released
version). Questions and ideas belong in
Discussions;
good first issues
are waiting.
License
Reviews (0)
Sign in to leave a review.
Leave a reviewNo results found