claude-telemetry
Health Warn
- License — License: MIT
- Description — Repository has a description
- Active repo — Last push 0 days ago
- Low visibility — Only 5 GitHub stars
Code Fail
- spawnSync — Synchronous process spawning in bin/claude-telemetry.mjs
- process.env — Environment variable access in bin/claude-telemetry.mjs
- process.env — Environment variable access in scripts/append-event.mjs
- exec() — Shell command execution in scripts/build.mjs
- process.env — Environment variable access in scripts/build.mjs
- exec() — Shell command execution in scripts/codex-hooks.mjs
- spawnSync — Synchronous process spawning in scripts/codex-hooks.mjs
- network request — Outbound network request in scripts/dashboard.mjs
Permissions Pass
- Permissions — No dangerous permissions requested
No AI report is available for this listing yet.
Agent Telemetry for Claude Code & Codex 🎯
claude-telemetry
Offline telemetry and a self-contained dashboard for Claude Code and Codex. It helps you see which docs, rules, skills, and agent instructions are actually used in each turn.
Contents
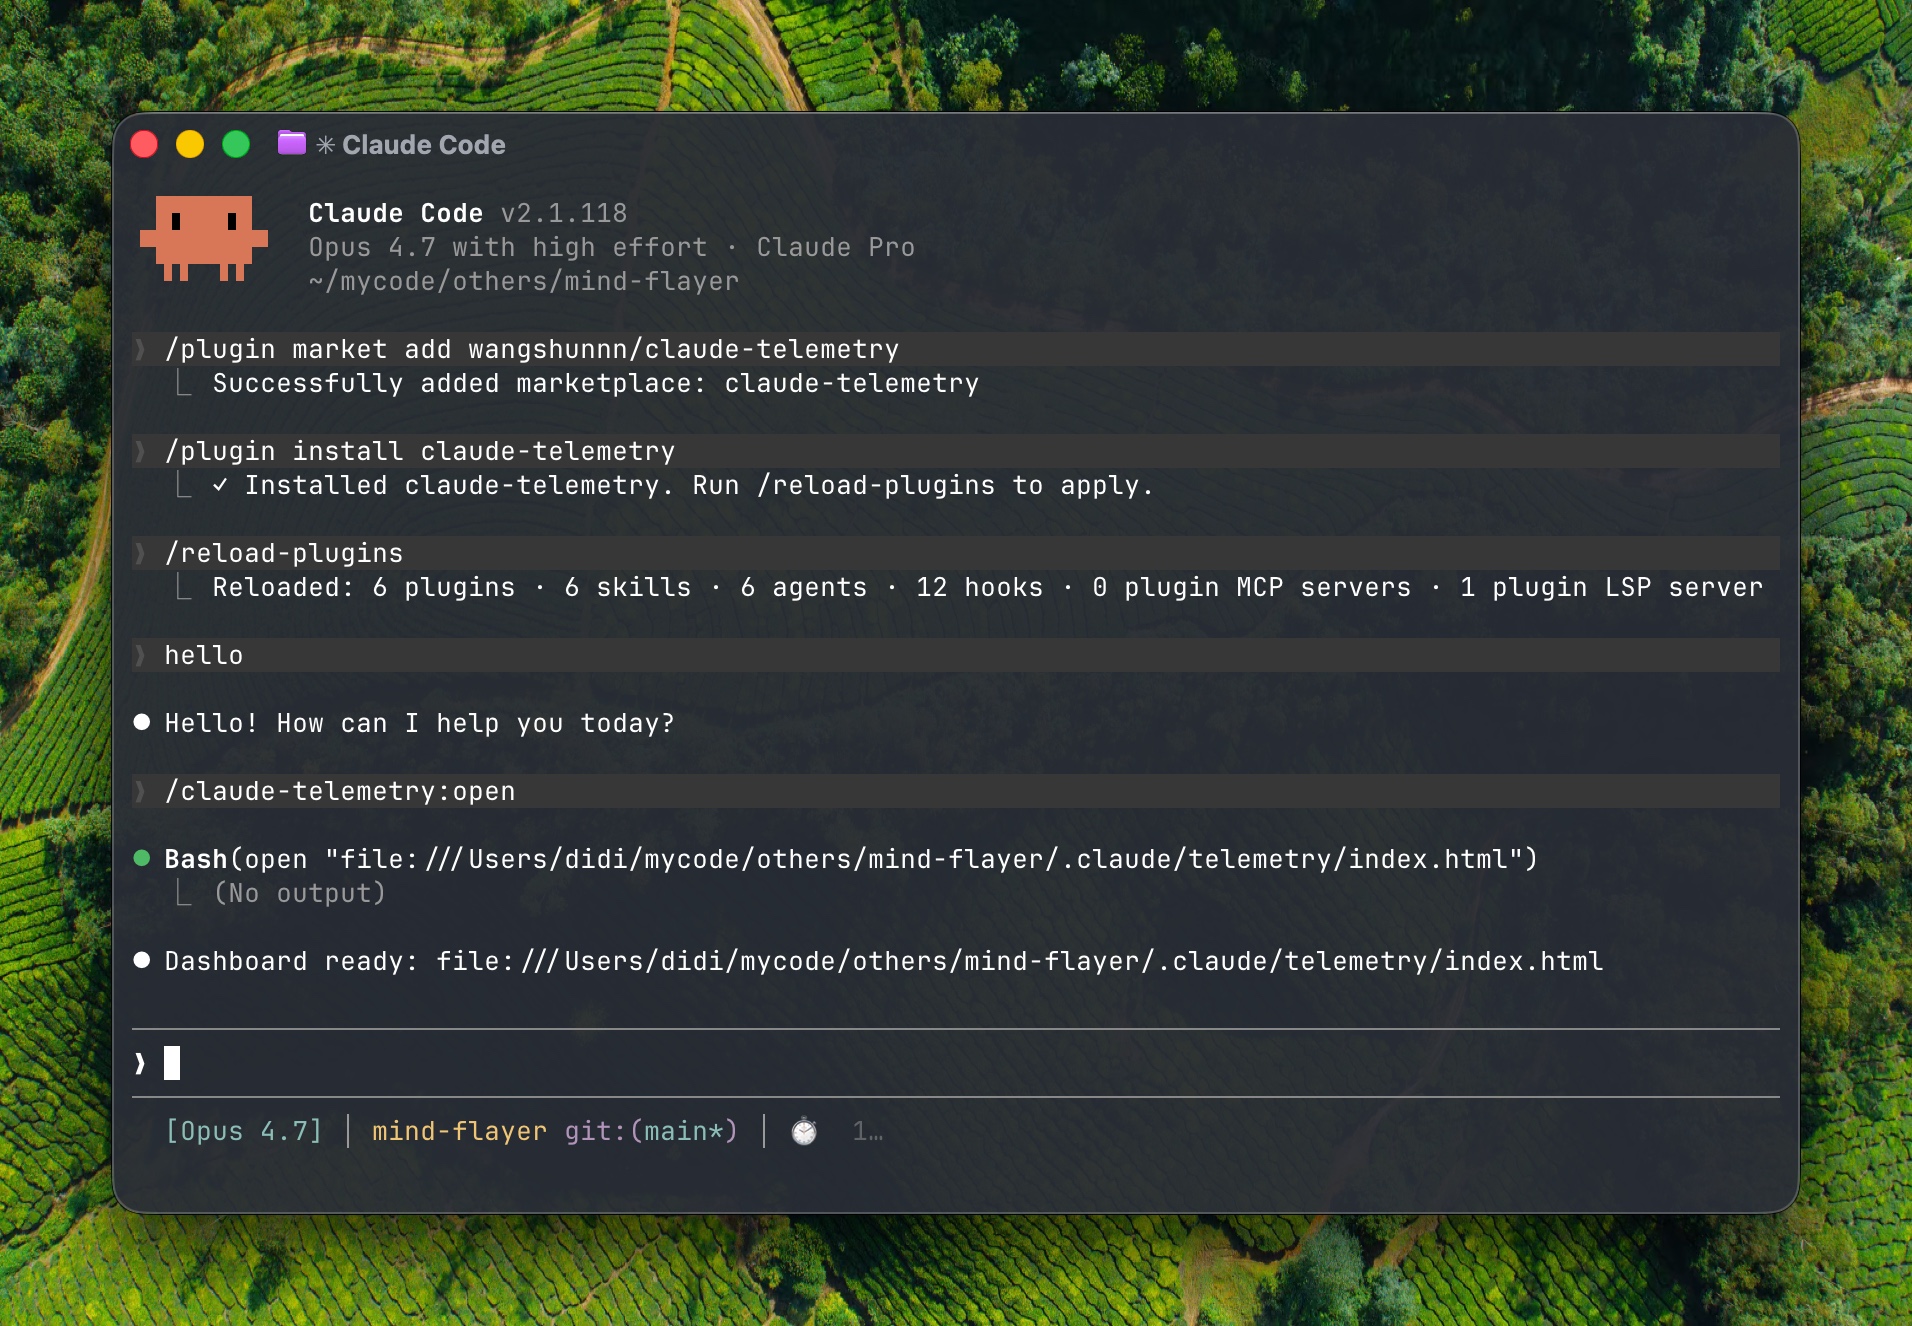
Claude Code Plugin
/plugin market add wangshunnn/claude-telemetry
/plugin install claude-telemetry
/reload-plugins
After installation, telemetry starts collecting from new turns. Use Claude in your project for a few turns, then open the dashboard:
/claude-telemetry:open
This builds the current project's offline dashboard and opens it in your browser.
You can add .claude/telemetry/ to the instrumented project's .gitignore.
Use the explicit source:
/plugin install claude-telemetry@claude-telemetry
Update
Update the Claude Code plugin:
/plugin market update claude-telemetry
/plugin update claude-telemetry
/reload-plugins
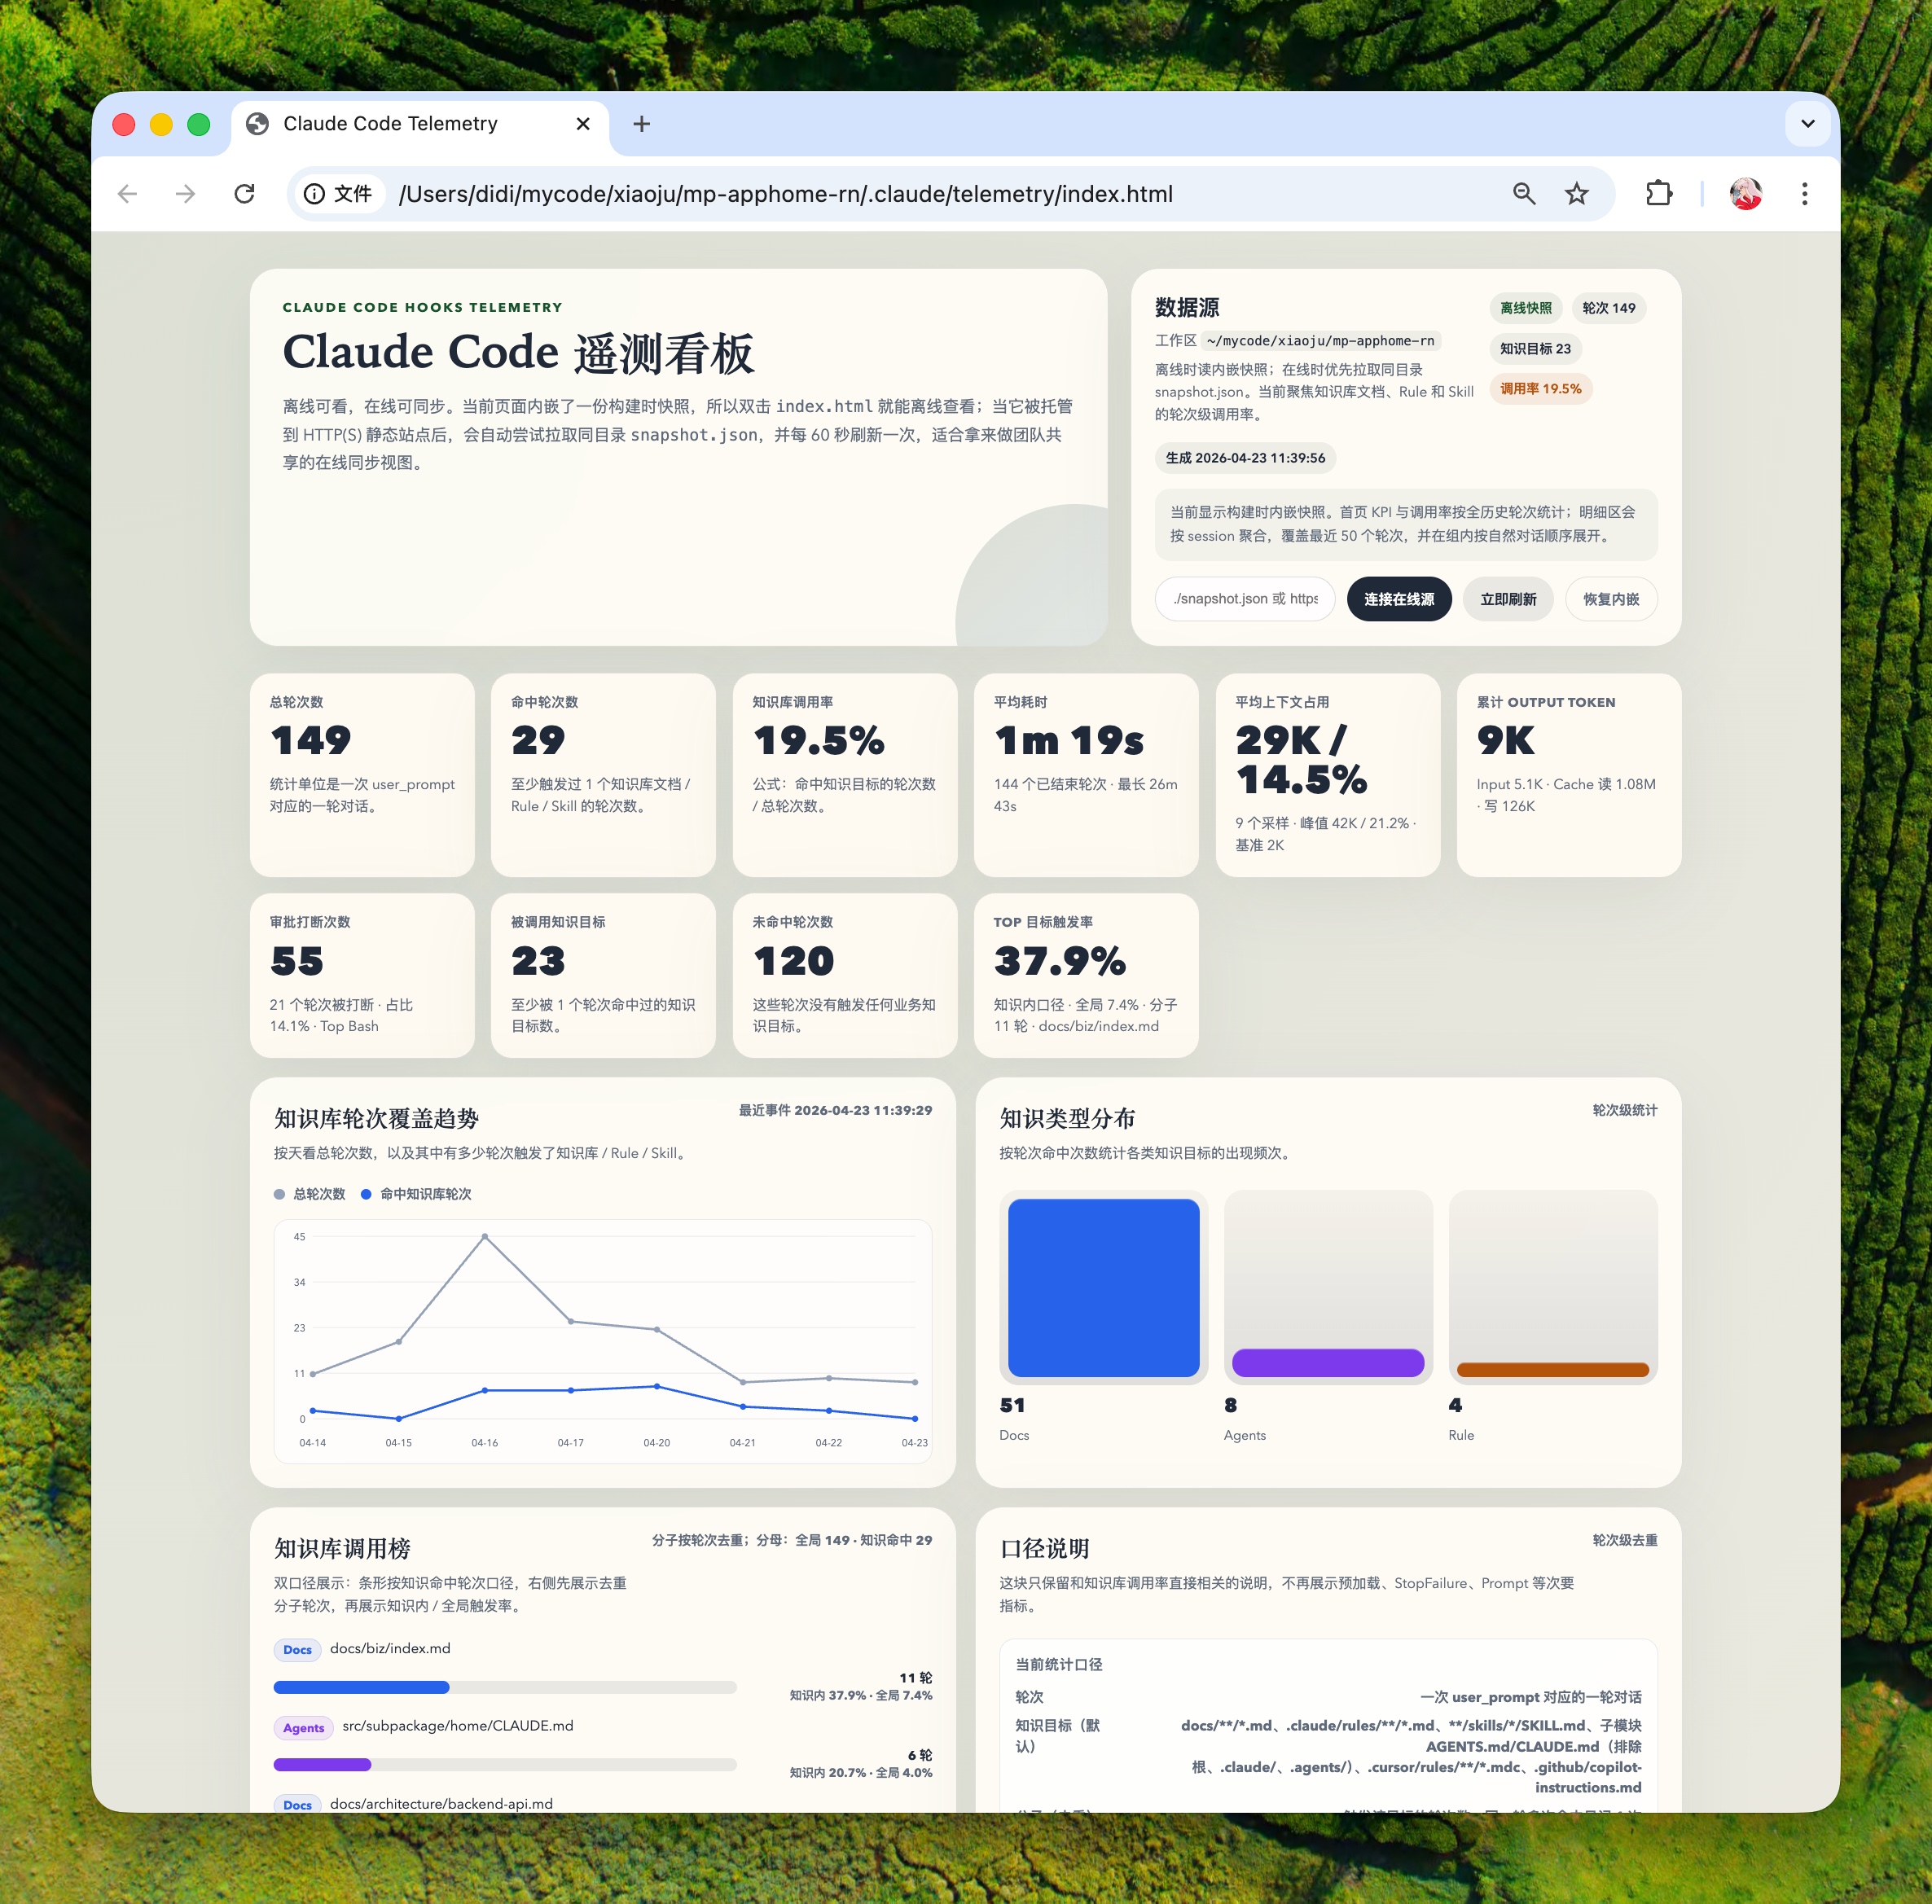
Screenshot
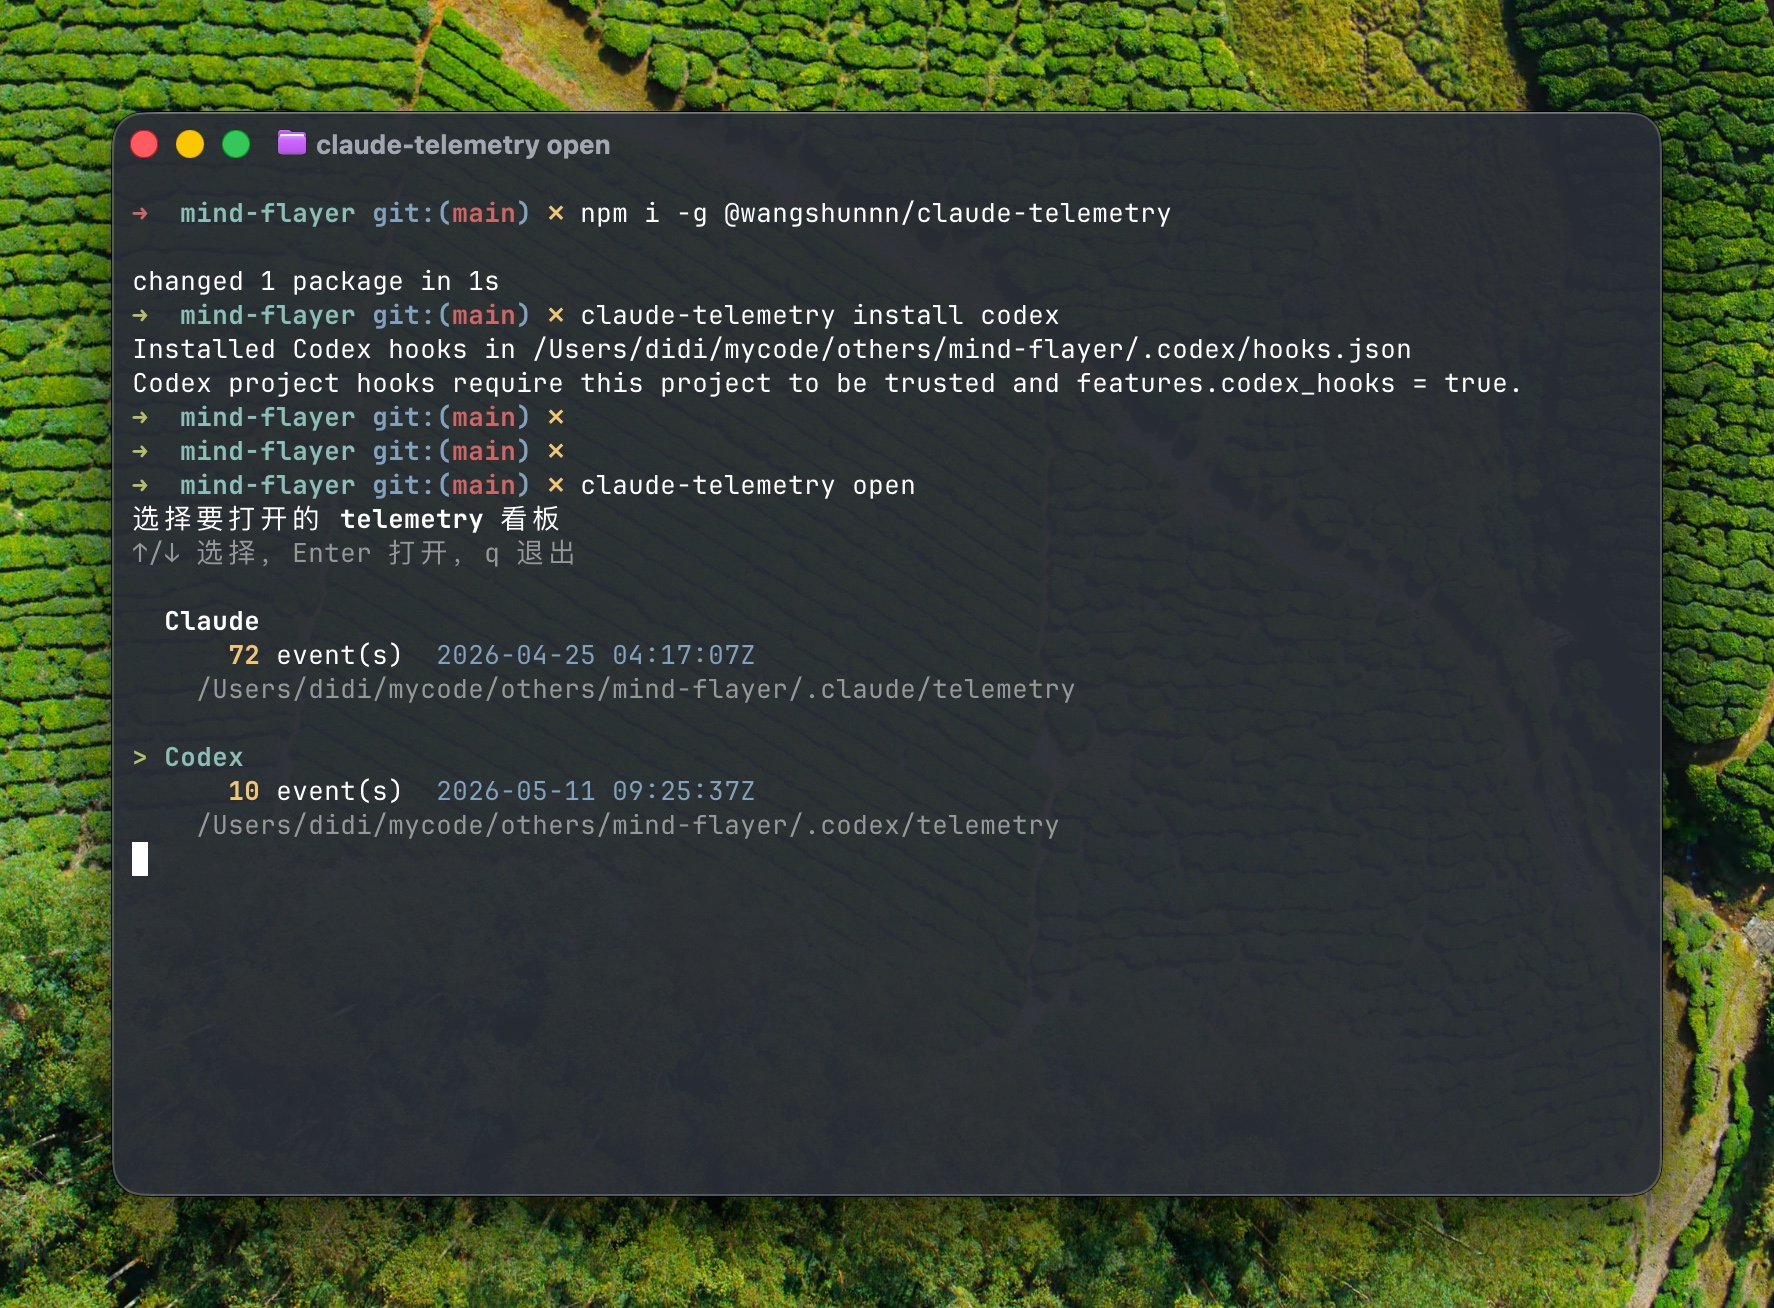
Codex
Use the npm package when you want project-local Codex hooks and a dashboard for Codex turns.
npm i -g @wangshunnn/claude-telemetry
cd /path/to/your/project
claude-telemetry install codex
Then use Codex in that trusted project for a few turns and open the Codex dashboard:
claude-telemetry open codex
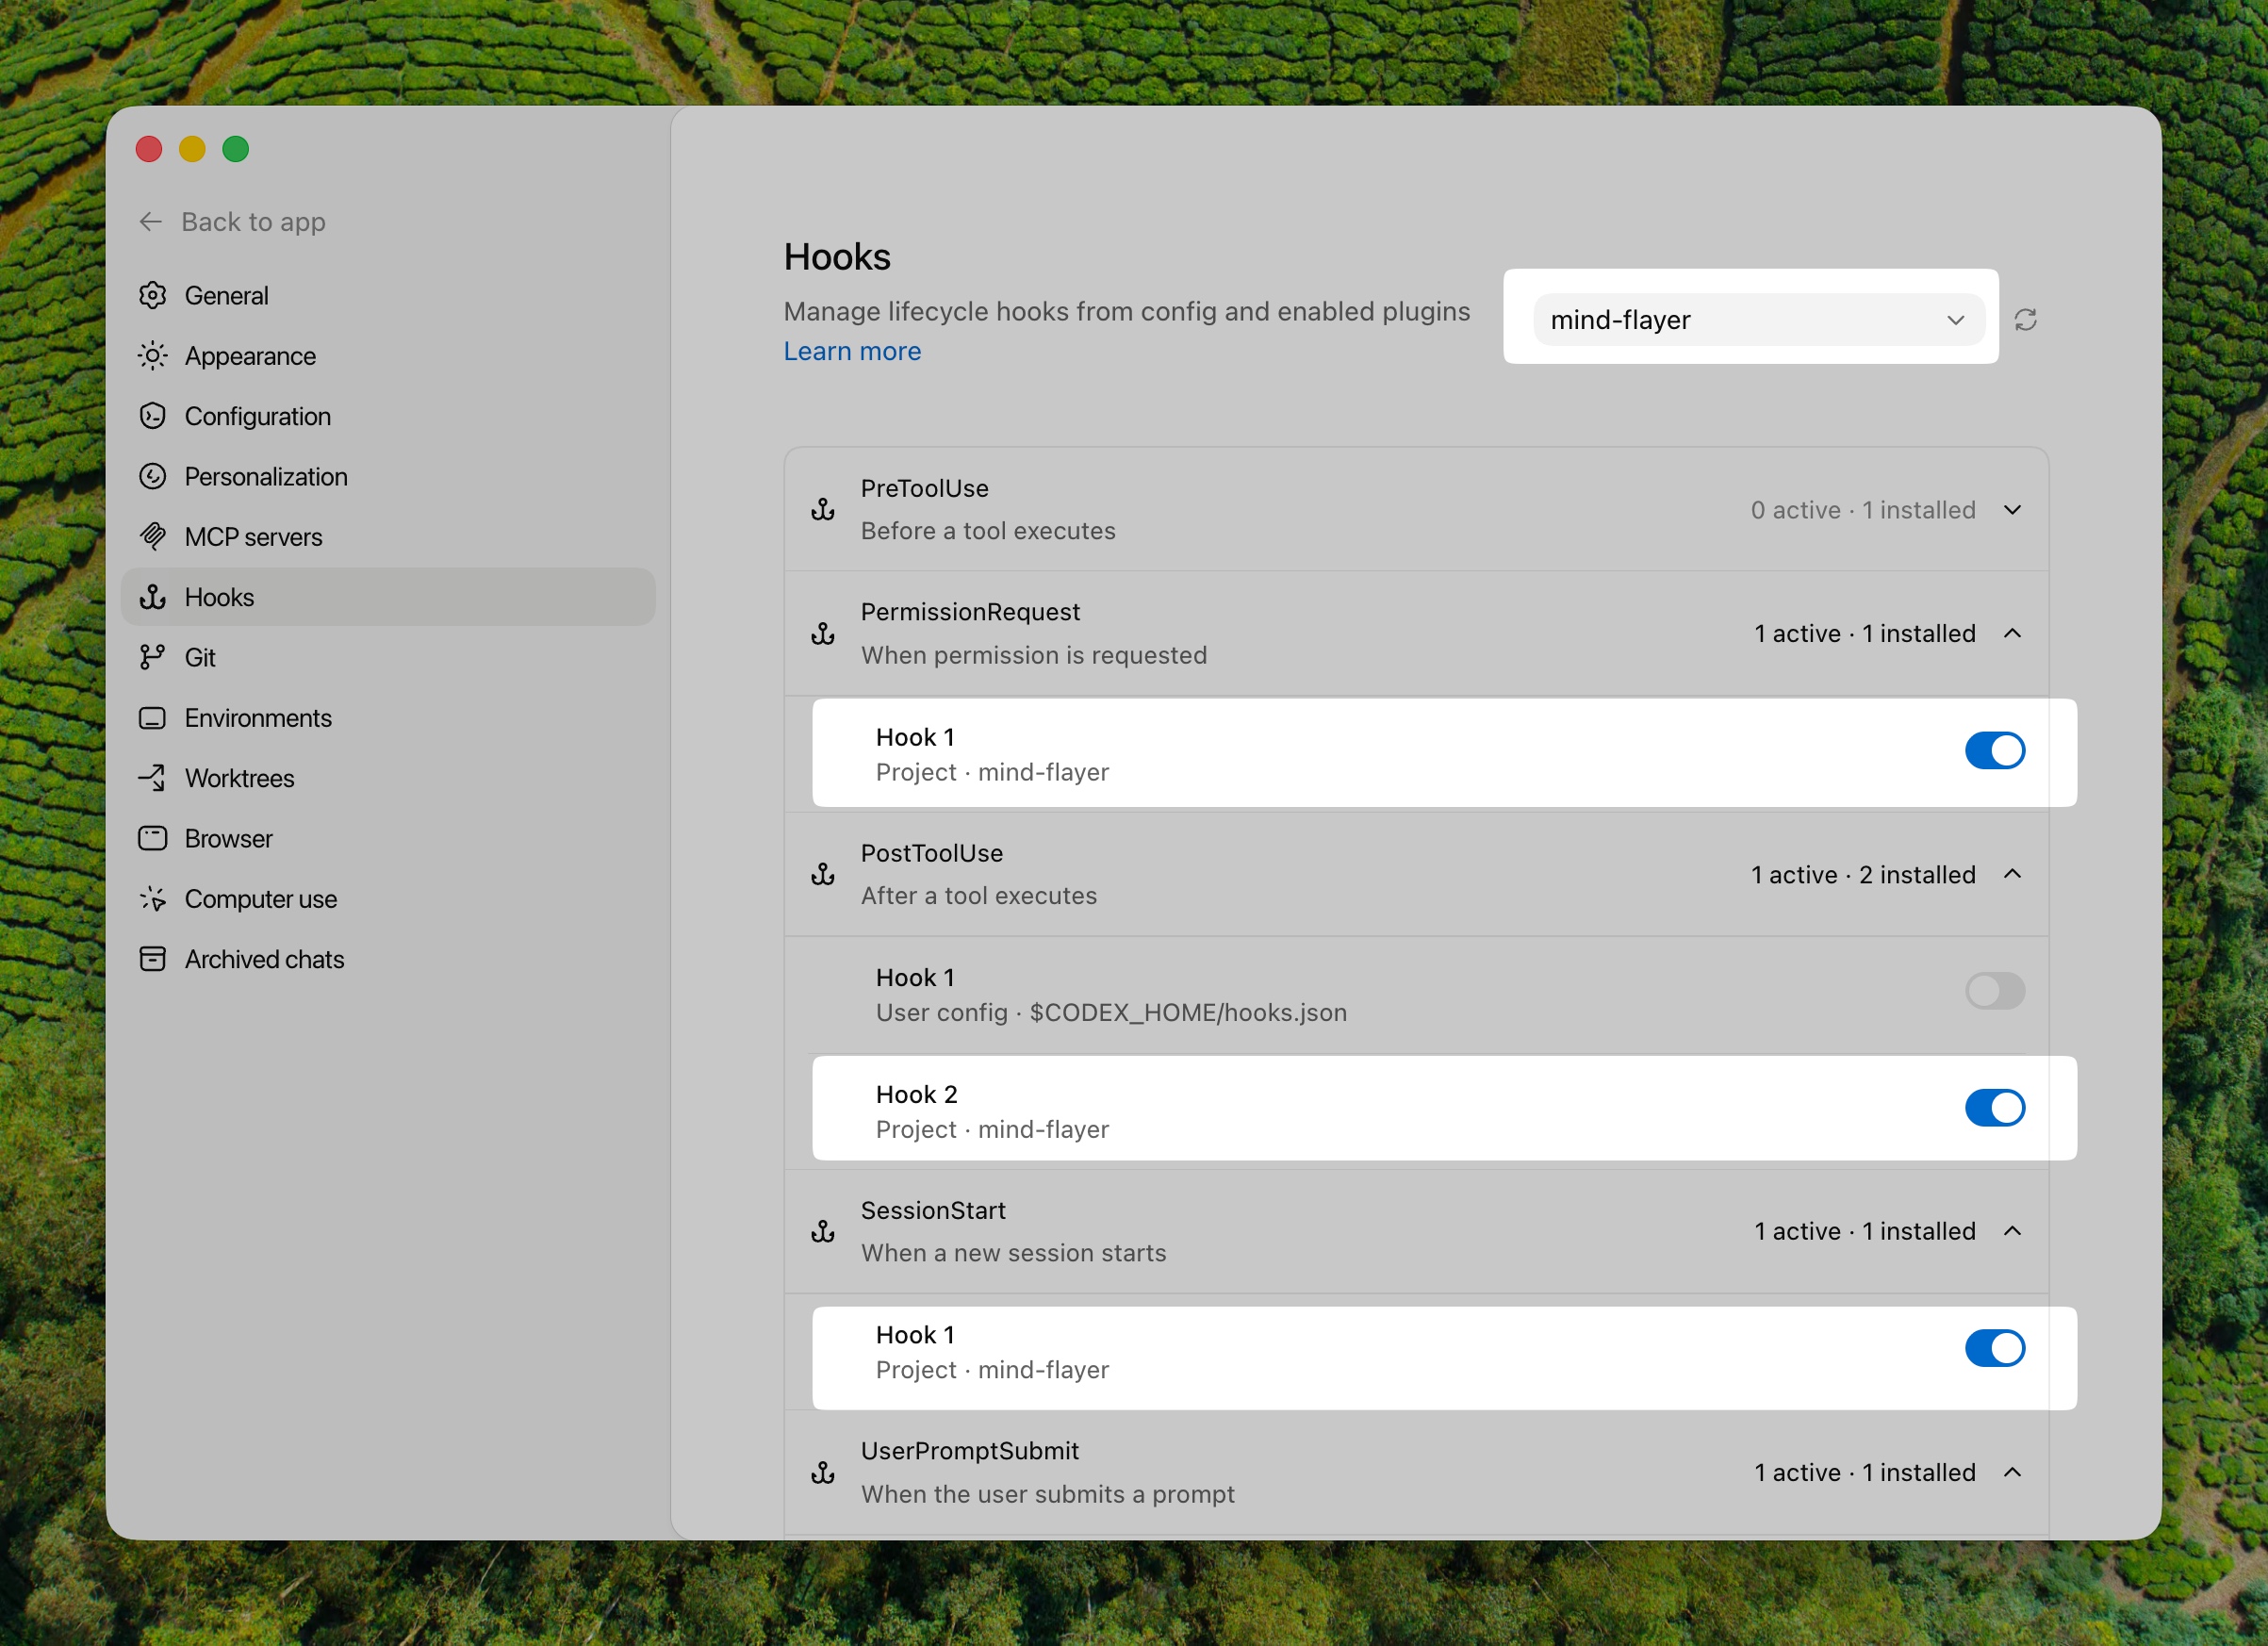
Codex project hooks need both of these Codex-side prerequisites:
- The project is trusted in Codex.
features.codex_hooks = trueis enabled in your Codex config.
For example, in ~/.codex/config.toml:
[features]
codex_hooks = true
Useful Codex commands:
claude-telemetry open           # interactively choose Codex or Claude when both have data
claude-telemetry open codex     # open Codex telemetry
claude-telemetry doctor codex   # check hook setup, trust, config, PATH, and data
claude-telemetry uninstall codex
Codex telemetry is stored separately under .codex/telemetry/. Add it to the instrumented project's .gitignore:
.codex/telemetry/
Screenshot
What You Get
- Per-turn knowledge hit rate for docs, rules, skills, and instruction files
- Tool usage, permission requests, idle prompts, token usage, and context size
- Project-local storage under
.claude/telemetry/for Claude Code and.codex/telemetry/for Codex - Self-contained
index.htmlandsnapshot.json
Notes
- Telemetry can include raw prompts, absolute file paths, and permission command inputs.
- Output stays inside the current project by default, which keeps Claude Code plugin commands within the workspace write boundary.
- Set
CLAUDE_TELEMETRY_ROOTonly if you explicitly want a shared telemetry directory outside the project. - The npm package ships the
claude-telemetryCLI plus the Claude Code plugin files used by the marketplace install path. - Release notes live in CHANGELOG.md.
License
MIT — LICENSE
Reviews (0)
Sign in to leave a review.
Leave a reviewNo results found