sci-figure
Health Warn
- License — License: MIT
- Description — Repository has a description
- Active repo — Last push 0 days ago
- Low visibility — Only 5 GitHub stars
Code Pass
- Code scan — Scanned 8 files during light audit, no dangerous patterns found
Permissions Pass
- Permissions — No dangerous permissions requested
No AI report is available for this listing yet.
AI skill for scientific figure generation, tuned for SCI and Elsevier-style manuscript figures with Python and R examples.
sci-figure skill
English | 中文
sci-figure is a general-purpose AI skill for scientific figure generation.
It provides reusable instructions, references, and examples that help AI agents
create publication-ready SCI-style figures with an Elsevier-friendly visual
language.
Project page: https://xiao-yuling.github.io/sci-figure/
sci-figure was inspired by the organization of thenature-figure
skill, especially its idea of starting from a figure contract before styling.
This project is not a copy of that skill: it uses its own platform-independent
instructions, examples, and style rules. The defaults here are tuned for
Elsevier-style manuscript figures: Times-style typography, full-box axes,
outward ticks on the left and bottom only, compact panel titles, and restrained
scientific palettes.
sci-figure is not tied to any specific AI platform. Use it as an AI skill by
copying skill.md into an agent prompt, project memory, custom assistant,
workflow template, or instruction bundle.
What is this skill for?
This skill teaches an AI agent how to plan and draw scientific figures. It is
most useful when the user wants manuscript plots, SCI figures, paper figures,
multi-panel results, or reproducible plotting scripts with journal-friendly
exports.
Example gallery
These previews use simulated data and the default style rules: Times-style
typography, full-box axes, outward ticks on the left and bottom only, editable
export settings, and neutral scientific palettes.
| Figure | Preview | Demonstrates |
|---|---|---|
| Scatter plot | 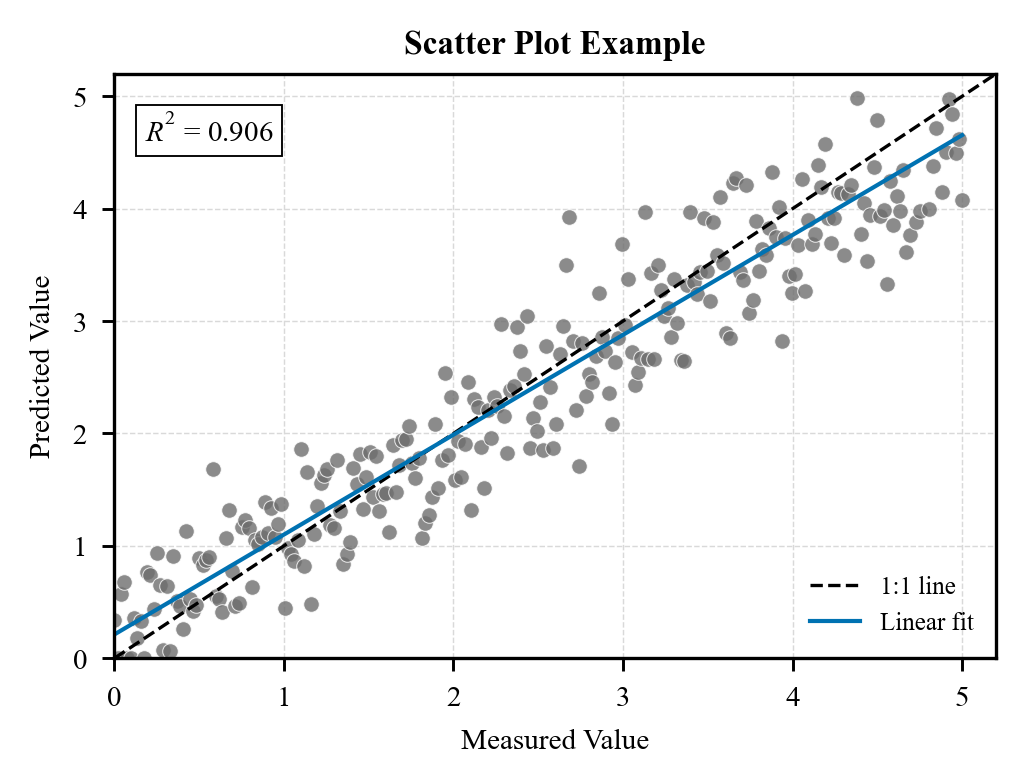 |
Correlation, 1:1 reference, linear fit, compact statistics annotation |
| Line plot | 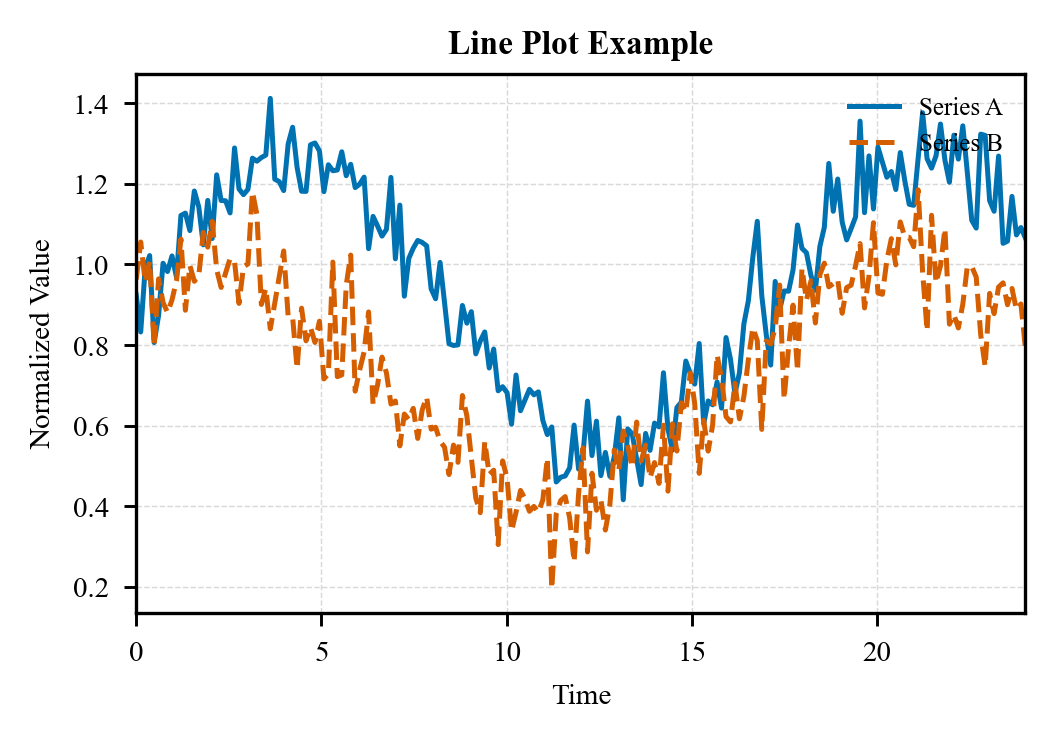 |
Multi-series trend comparison, restrained legend, light guide grid |
| Histogram | 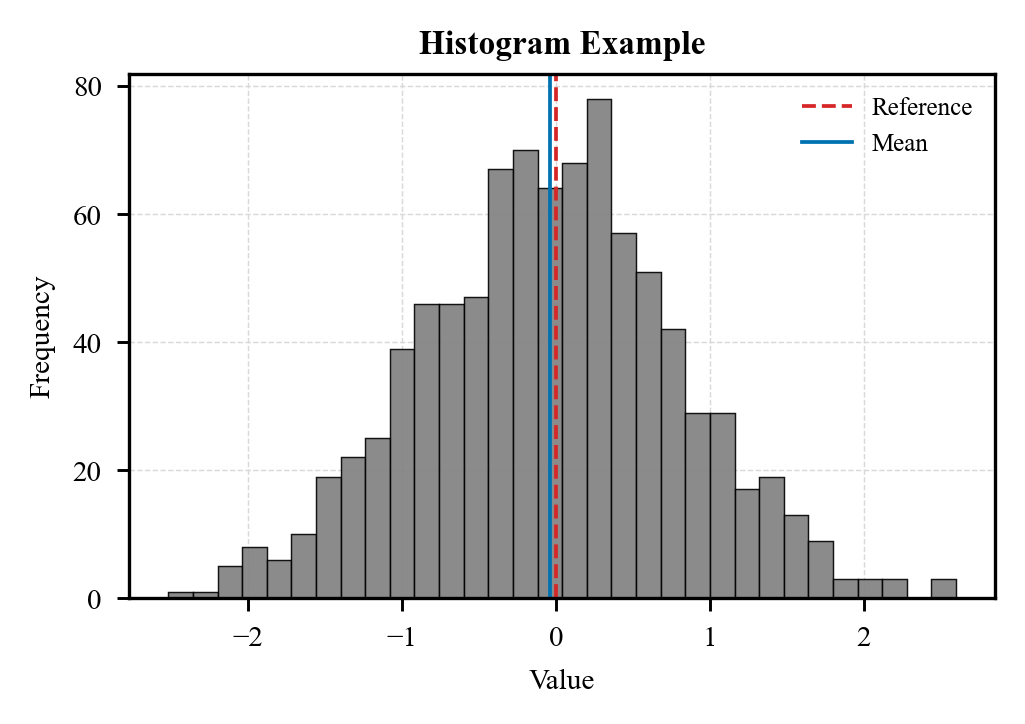 |
Distribution summary, reference line, mean marker, compact axis labels |
| Grouped bar plot | 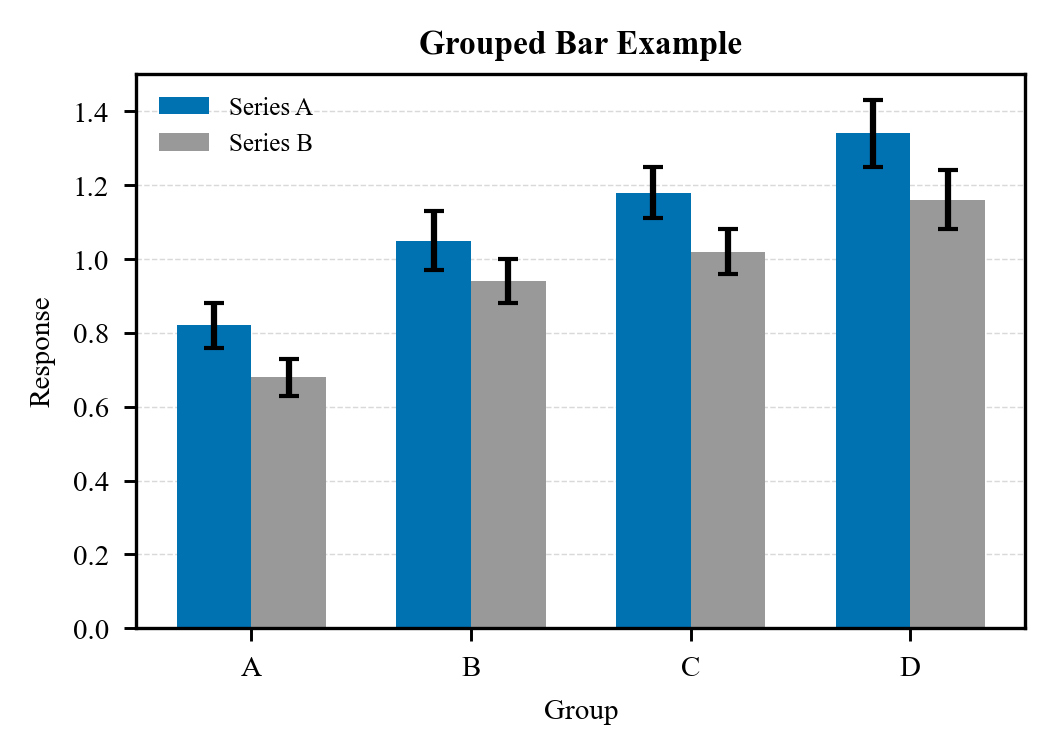 |
Group comparison, uncertainty caps, restrained categorical color |
| Heatmap | 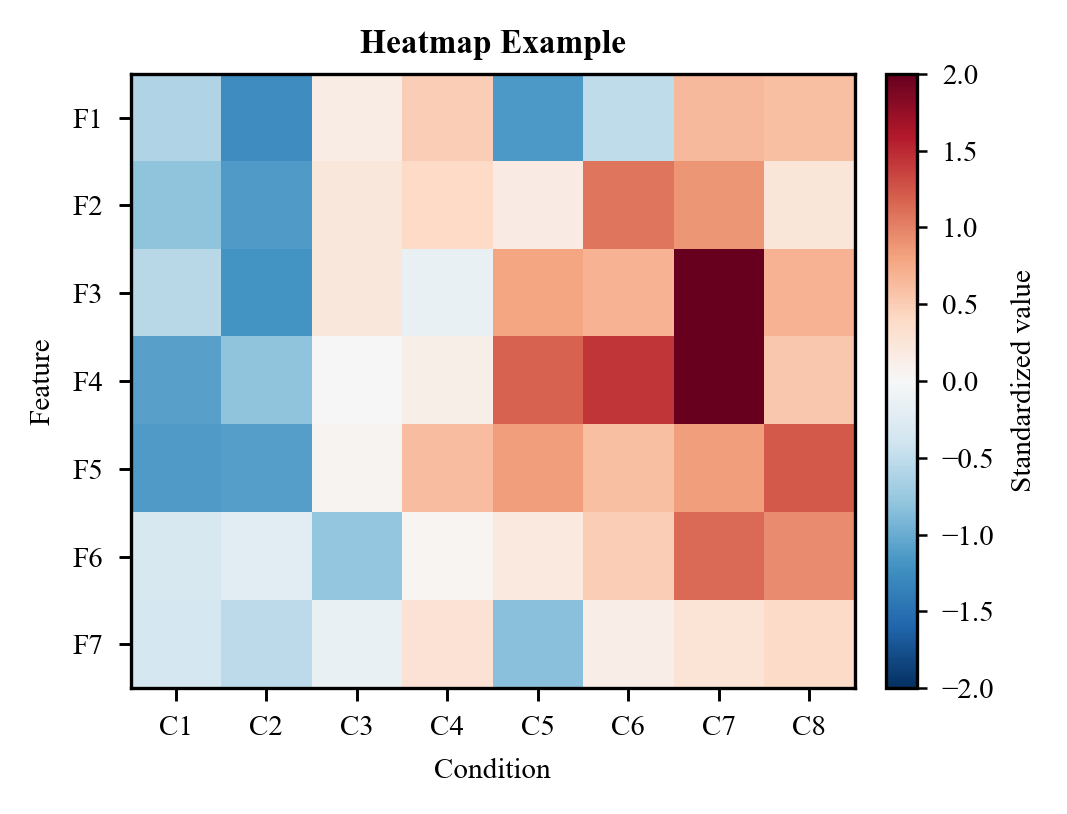 |
Matrix patterns, diverging scale, compact colorbar |
| Violin and box plot | 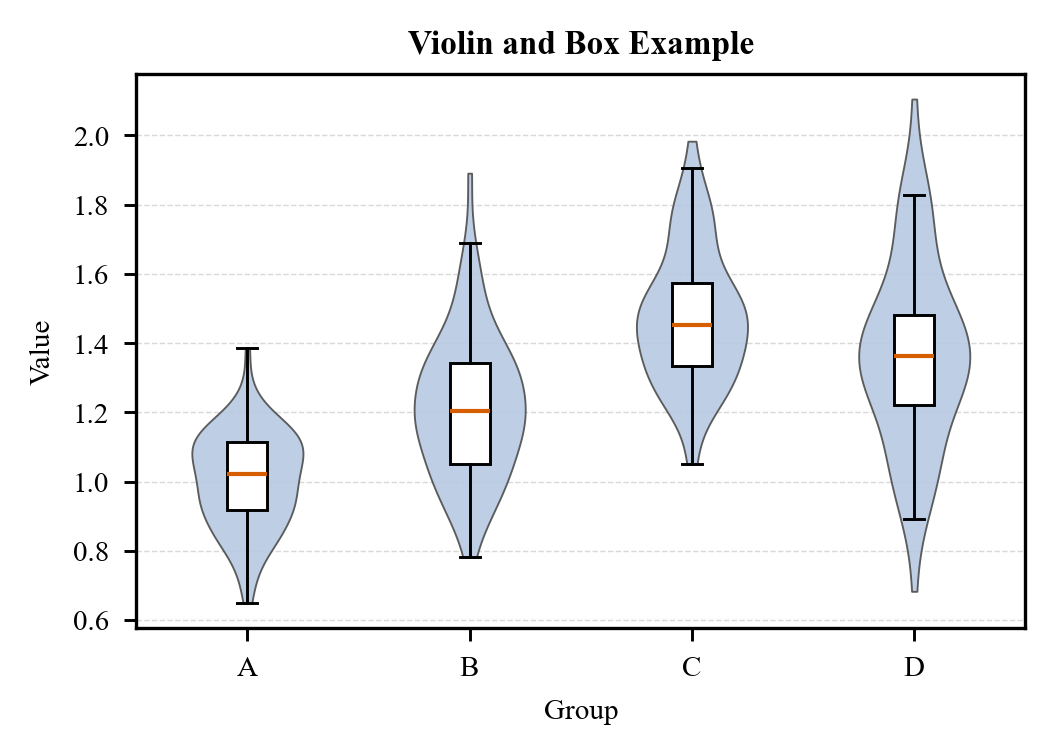 |
Distribution shape, median emphasis, group spread |
| Interval plot | 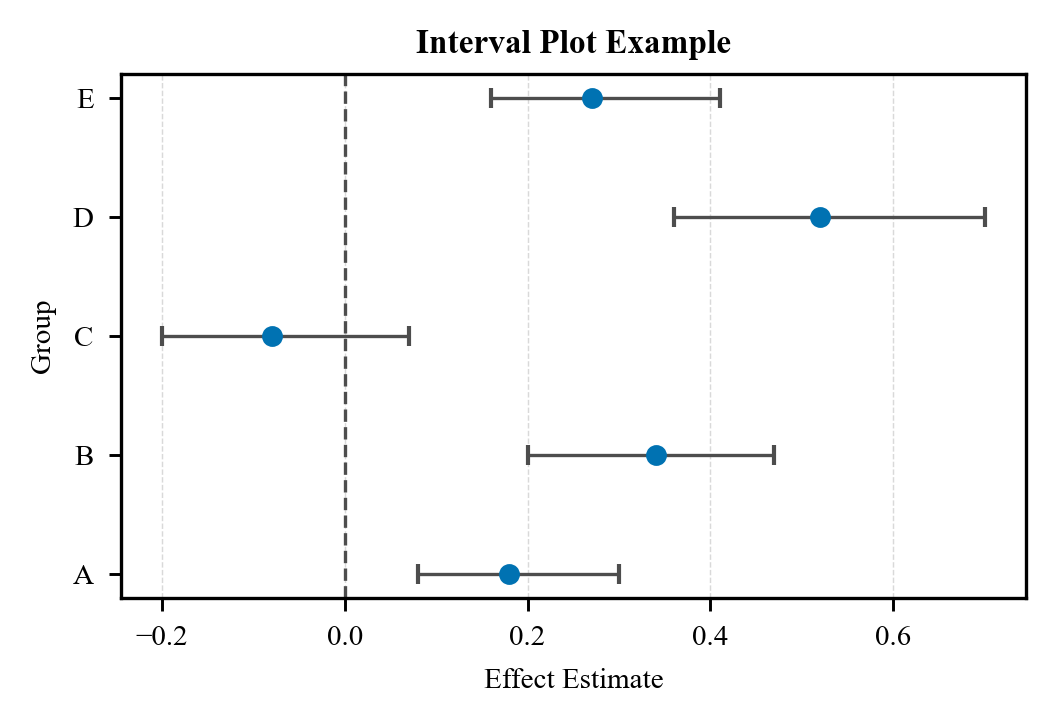 |
Effect estimates, uncertainty intervals, null reference |
| Multi-panel figure | 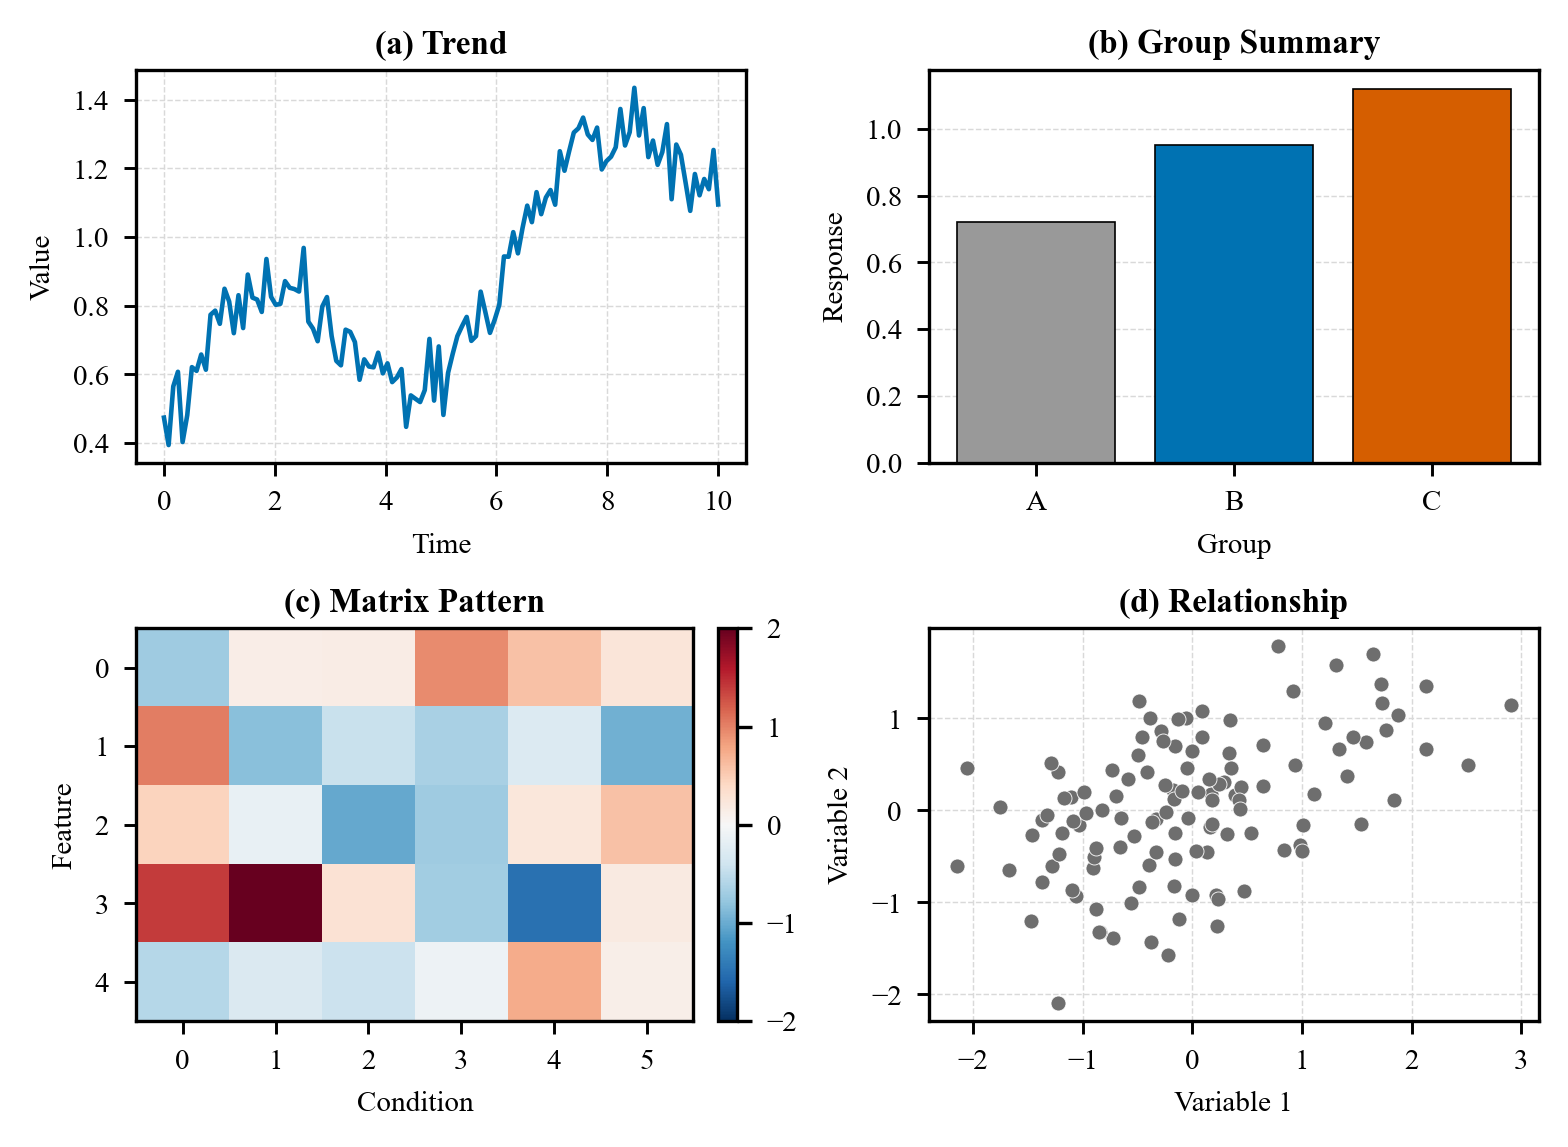 |
Integrated panel titles, mixed evidence, compact layout |
Gallery PNGs are lightweight previews for documentation. For manuscript use,
regenerate editable SVG/PDF and high-resolution TIFF/PNG from the scripts.
Chart-type atlas
| Chart family | Common use |
|---|---|
| Scatter and bubble plots | Correlation, calibration, clusters, third-variable encoding |
| Line and trend plots | Time courses, longitudinal series, uncertainty ribbons |
| Bar charts | Group comparison, ablation, signed deltas, stacked composition |
| Heatmaps | Matrices, z-scores, annotated grids, sensitivity maps |
| Histograms and densities | Distribution shape, residuals, error spread |
| Box and violin plots | Group spread, sample-level variability |
| Forest and interval plots | Effect sizes, confidence intervals, point ranges |
| Multi-panel layouts | Evidence hierarchy, validation panels, comparative summaries |
File structure
sci-figure/
├── README.md
├── LICENSE
├── skill.md
├── references/
│   ├── backend-selection.md
│   ├── style-guide.md
│   ├── chart-patterns.md
│   └── qa-checklist.md
└── examples/
    ├── python/
    │   ├── scatter_example.py
    │   ├── line_example.py
    │   ├── histogram_example.py
    │   ├── bar_example.py
    │   ├── heatmap_example.py
    │   ├── violin_box_example.py
    │   ├── errorbar_example.py
    │   └── multipanel_example.py
    └── gallery/
        ├── scatter-example.png
        ├── line-example.png
        ├── histogram-example.png
        ├── bar-example.png
        ├── heatmap-example.png
        ├── violin-box-example.png
        ├── interval-example.png
        └── multipanel-example.png
Quick start
- Give
skill.mdto an AI agent as a reusable skill. - Ask for a scientific figure and specify Python or R.
- Provide data, target dimensions, and export needs.
- Run the generated script and inspect the output before manuscript use.
Example prompt:
Use the sci-figure skill to create a Python scatter plot for a manuscript.
The plot should compare measured and predicted values, export SVG/PDF/TIFF,
and follow the default SCI style.
Run the included Python examples:
python examples/python/scatter_example.py
python examples/python/line_example.py
python examples/python/histogram_example.py
python examples/python/bar_example.py
python examples/python/heatmap_example.py
python examples/python/violin_box_example.py
python examples/python/errorbar_example.py
python examples/python/multipanel_example.py
Each script writes a PNG preview to examples/gallery/.
Design rules
- Build the figure around a scientific claim, not around decoration.
- Use one backend for all rendering once Python or R is selected.
- Keep text editable in SVG/PDF outputs.
- Prefer Times New Roman for manuscript figures, with compatible math text.
- Keep all four axis spines visible by default.
- Show ticks only on the left and bottom, and point them outward.
- Use panel subtitles only for multi-panel figures.
- Use compact, restrained color systems that survive grayscale review.
Search keywords
AI skill, AI skills, scientific plotting skill, scientific figure skill,
publication figure, SCI figure, Elsevier figure style, manuscript plots,
matplotlib, ggplot2, editable SVG, research visualization.
中文
sci-figure 是一套面向 AI agent 的通用科研绘图 skill,用于生成适合
SCI 论文、技术报告和投稿图的可复现图表。它包含可复用的绘图指令、参考规则
和示例脚本,可以作为 AI skills / agent skills 的一部分使用。
项目主页:https://xiao-yuling.github.io/sci-figure/
本项目参考了nature-figure
的组织方式,尤其是“先建立 figure contract,再进入绘图和美化”的思路。
但 sci-figure 不是对它的复制:这里的说明、示例和默认样式都是重新编写的,
更偏向 Elsevier / SCI 工程类期刊常见的视觉规范,例如 Times 系列字体、四边框坐标轴、
只在左侧和下方显示外向刻度、紧凑的多子图标题,以及克制的科研配色。
sci-figure 不绑定任何特定 AI 平台。你可以把 skill.md 作为一个 skill
交给任意 AI agent,也可以把其中的规则复制到项目提示词、agent memory、
自定义助手、工作流模板或团队绘图规范中。
这个 skill 适合做什么?
这个 skill 教 AI agent 如何规划和绘制科研图。它适合论文图、SCI 绘图、
投稿图、多子图结果展示,以及需要可复现脚本和期刊友好导出的绘图任务。
示例图库
下面的图片都由模拟数据生成,展示默认样式规则:Times 风格字体、四边框、
仅左/下外向刻度、可编辑导出设置,以及中性的科研配色。
| 图类型 | 预览 | 展示内容 |
|---|---|---|
| 散点图 | |
相关关系、1:1 参考线、线性拟合、紧凑统计标注 |
| 折线图 | |
多序列趋势比较、克制图例、浅色辅助网格 |
| 直方图 | |
分布概览、参考线、均值标记、紧凑坐标轴标签 |
| 分组柱状图 | |
组间比较、误差帽、克制分类配色 |
| 热图 | |
矩阵模式、发散色标、紧凑 colorbar |
| 小提琴 + 箱线图 | |
分布形状、中位数强调、组内离散程度 |
| 区间图 | |
效应估计、不确定性区间、零值参考线 |
| 多子图组合 | |
集成式子图标题、混合证据、紧凑版式 |
图库中的 PNG 是 README 预览图。正式投稿时,应从脚本重新导出可编辑的 SVG/PDF
和高分辨率 TIFF/PNG。
图类型索引
| 图族 | 常见用途 |
|---|---|
| 散点图和气泡图 | 相关性、校准、聚类、第三变量编码 |
| 折线图和趋势图 | 时间序列、纵向变化、不确定性带 |
| 柱状图 | 组间比较、消融实验、有符号差值、堆叠组成 |
| 热图 | 矩阵、z-score、标注网格、敏感性分析 |
| 直方图和密度图 | 分布形状、残差、误差分布 |
| 箱线图和小提琴图 | 组内离散、样本级变化 |
| 森林图和区间图 | 效应量、置信区间、点估计范围 |
| 多子图版式 | 证据层级、验证面板、对比汇总 |
文件结构
sci-figure/
├── README.md
├── LICENSE
├── skill.md
├── references/
│   ├── backend-selection.md
│   ├── style-guide.md
│   ├── chart-patterns.md
│   └── qa-checklist.md
└── examples/
    ├── python/
    │   ├── scatter_example.py
    │   ├── line_example.py
    │   ├── histogram_example.py
    │   ├── bar_example.py
    │   ├── heatmap_example.py
    │   ├── violin_box_example.py
    │   ├── errorbar_example.py
    │   └── multipanel_example.py
    └── gallery/
        ├── scatter-example.png
        ├── line-example.png
        ├── histogram-example.png
        ├── bar-example.png
        ├── heatmap-example.png
        ├── violin-box-example.png
        ├── interval-example.png
        └── multipanel-example.png
快速开始
- 把
skill.md作为可复用 skill 提供给 AI agent。 - 请求绘制科研图,并明确选择 Python 或 R。
- 提供数据、目标尺寸和导出需求。
- 运行生成的脚本,并在正式投稿前检查输出。
示例提示词:
Use the sci-figure skill to create a Python scatter plot for a manuscript.
The plot should compare measured and predicted values, export SVG/PDF/TIFF,
and follow the default SCI style.
运行示例脚本:
python examples/python/scatter_example.py
python examples/python/line_example.py
python examples/python/histogram_example.py
python examples/python/bar_example.py
python examples/python/heatmap_example.py
python examples/python/violin_box_example.py
python examples/python/errorbar_example.py
python examples/python/multipanel_example.py
每个脚本都会把 PNG 预览图写入 examples/gallery/。
设计规则
- 先围绕科学结论组织图,而不是先追求装饰效果。
- 一旦选择 Python 或 R,所有渲染、预览、导出和检查都使用同一个后端。
- SVG/PDF 中尽量保留可编辑文字。
- 论文图优先使用 Times New Roman,并保持兼容的数学字体。
- 默认保留四条坐标轴边框。
- 刻度只显示在左侧和下方,并朝外。
- 只有多子图才使用
(a) Panel title形式的子图标题。 - 使用紧凑、克制、灰度下仍可读的配色。
搜索关键词
AI skill、AI skills、agent skill、科研绘图 skill、SCI 绘图、论文图、
投稿图、Elsevier 风格、爱思唯尔绘图风格、matplotlib、ggplot2、可编辑 SVG、
科研可视化。
License / 许可证
MIT License. See LICENSE.
Reviews (0)
Sign in to leave a review.
Leave a reviewNo results found