agentcap
Health Warn
- No license — Repository has no license file
- Description — Repository has a description
- Active repo — Last push 0 days ago
- Community trust — 11 GitHub stars
Code Fail
- rm -rf — Recursive force deletion command in build/fetch-toolchain.sh
- rm -rf — Recursive force deletion command in build/kernel-matrix.sh
Permissions Pass
- Permissions — No dangerous permissions requested
No AI report is available for this listing yet.
eBPF Prometheus exporter for AI-agent activity — per-agent tools, domains, ports, files, CPU & network — with a Grafana dashboard. A yeet service.
agentcap





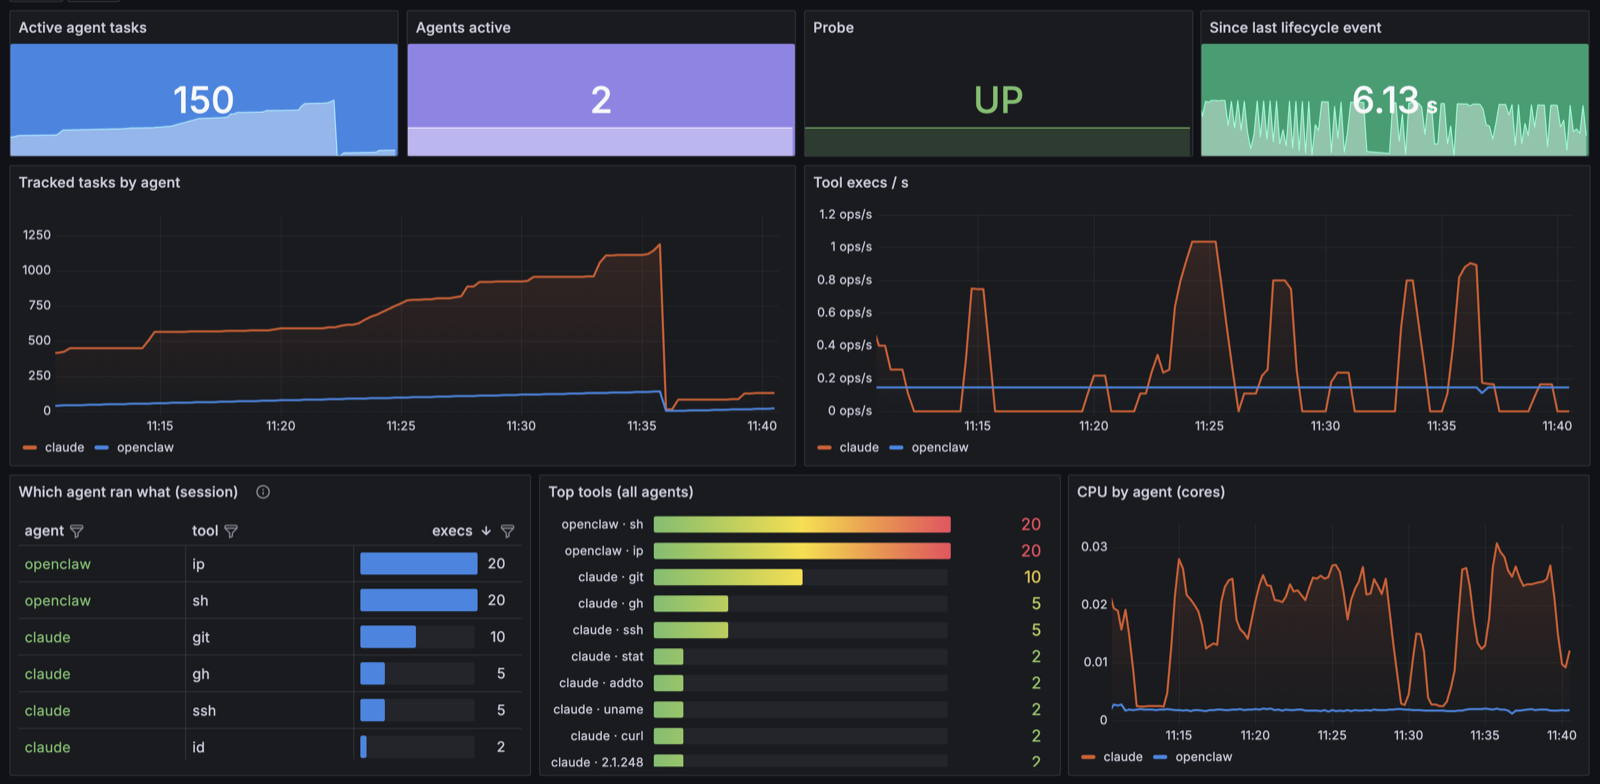
AI coding agents run shell commands, open files, and make network calls on
your machine, and most of it goes unseen. agentcap records that activity from
the kernel with eBPF and exposes it as per-agent Prometheus metrics with a
Grafana dashboard. It needs no SDK or changes to the agents, works on agents
that are already running, and attributes child processes (a bash or curl a
tool spawns) to the agent that launched them.
Per agent, it reports:
- tools run — each binary the agent exec'd
- domains queried and destination ports
- files opened, read vs. write
- CPU time, network bytes, file I/O, and process churn
That's enough to audit what an agent did, notice an unexpected domain or port,
or track resource use over time. OpenClaw, Claude Code, Codex, Gemini, aider
and others are recognized by default; add any process by
name. Built on yeet and eBPF.
Quickstart
curl -fsSL https://yeet.cx | sh          # 1. install yeet (CLI + yeetd daemon)
yeet login                               # 2. authenticate this host
git clone https://github.com/yeet-src/agentcap && cd agentcap
make up                                  # 3. build + start the exporter on :9464
make wire                                # 4. print how to add it to your Grafana
make up runs the exporter (a Prometheus endpoint at 127.0.0.1:9464);make wire prints the scrape-config + dashboard-import steps for your Grafana.
No Grafana handy? Run make demo for a throwaway Prometheus + Grafana in
Docker at http://localhost:3000/d/agentcap/agent-activity. Full detail in
Setup; make down stops everything.
Agents included
Tracked out of the box (edit src/agents.txt to change the
list — one comm prefix per line):
OpenClaw (openclaw) |
Claude Code (claude) |
OpenAI Codex (codex) |
Gemini CLI (gemini) |
aider (aider) |
opencode (opencode) |
Block goose (goose) |
Cline (cline) |
Continue (continue) |
Cursor (cursor) |
qwen-code (qwen) |
Charm crush (crush) |
Sourcegraph amp (amp) |
grok (grok) |
omp (omp) |
pi (pi) |
Each name is a process-comm prefix; a match pulls in that process's whole
tree, so the bash / node / curl an agent spawns is counted under it. Only
agents actually running appear in the metrics — the list is the watch set, not
a requirement that all be present.
How it watches agents
The BPF side (src/bpf/agentcap.bpf.c) is policy-free: the collector
reads the prefix list from src/agents.txt and pushes it into a kernel
LPM trie at startup, so matching is a single loop-free trie lookup with
no per-agent cost. The word-boundary rule is encoded in the data — each prefix
is inserted as name\0 / name- / name_ / name. — so "pi" catchespi, not pipewire. A task is tracked when its comm matches the trie or
when a tracked task forks it — each tree keeps the
identity of the prefix that rooted it, so a bash exec'd by openclaw is
counted as agent="openclaw". Roots that predate the probe (a running
gateway) are adopted on their first context switch, fork, or socket/file op.
Attach types: tracepoints, LSM hooks, and fexit trampolines — no
kprobes. LSM (socket_connect, socket_sendmsg) carries exact
before-the-fact semantics and is a stable security API; fexit supplies what
LSM never sees: actual received bytes (sock_recvmsg) and actual file I/O
(vfs_read/vfs_write). The LSM programs need a kernel with BPF-LSM
available, which modern distros ship; if it isn't, the probe reportsagentcap_probe_up 0 and the app stays up rather than crashing.
Egress is split by rate: rare lifecycle events (fork/exec/exit, with names)
stream over a ring buffer; high-rate sums (CPU ns, socket and file bytes)
live in a {agent, slot}-keyed hash the collector polls once a second.
Audit: domains and destination ports
For security review, the probe also streams, per agent, the destination
port of every inet connect and the domain of every name lookup it can
see. To keep the kernel side verifier-safe, the probe only filters and
copies raw bytes; the collector parses them in JavaScript, where loops are
free. Two lookup paths are covered:
- Port-53 DNS — direct resolver traffic (c-ares, aiodns,
dig): the
DNS packet head is shipped and the qname decoded from label format. - nss-resolved varlink — glibc
getaddrinfoon systemd hosts resolves
over a unix socket, never touching port 53. The probe recognizes the
varlinkResolveHostnameJSON on tracked tasks' unix sends and lifts the
name.
DoH/DoT are invisible — an agent resolving over its own HTTPS/TLS
channel shows only as a :443 connect, not a domain. That's a real limit
of watching from the kernel, documented rather than papered over.
Metrics
All labeled agent. A few carry an extra label — execs a comm (the tool
that ran), net_connections a port, dns_queries a domain, andfiles_opened a path + mode — each capped per agent (then folded intoother) to bound cardinality.
| Metric | Type | Meaning |
|---|---|---|
agentcap_tasks |
gauge | tracked tasks alive per agent tree |
agentcap_execs_total |
counter | binaries exec'd (tools the agent ran), by comm |
agentcap_forks_total / agentcap_exits_total |
counter | process churn |
agentcap_cpu_seconds_total |
counter | on-CPU time of the tree |
agentcap_net_connects_total |
counter | inet socket connects |
agentcap_net_transmit_bytes_total / ..._receive_bytes_total |
counter | inet socket traffic (unix sockets excluded) |
agentcap_file_read_bytes_total / ..._write_bytes_total |
counter | actual VFS bytes |
agentcap_net_connections_total |
counter | inet connects by destination port — the audit view |
agentcap_dns_queries_total |
counter | lookups by domain (see DNS note below) |
agentcap_files_opened_total |
counter | regular files opened, by path + mode (read/write) |
agentcap_last_activity_timestamp_seconds |
gauge | unix time of last lifecycle event |
agentcap_probe_up |
gauge | BPF object loaded and attached |
agentcap_events_dropped_total |
counter | ring-buffer backpressure |
yeet_worker_up is prepended by the renderer: 0 means the scrape route is
alive but the collector worker is not.
Setup
It works out of the box: the common agents — OpenClaw, Claude Code, Codex,
Gemini, aider, opencode, goose, cline, continue, cursor, qwen, crush, amp,
grok, omp, pi — are pre-filled in src/agents.txt, one
comm prefix per line. Edit that file to change what's watched.
1. Install yeet and log in
curl -fsSL https://yeet.cx | sh    # installs the yeet CLI + the yeetd daemon
yeet login                         # authenticate this host
yeet status                        # must print "Status: Ok."
yeetd is the daemon the installer sets up; it does the eBPF loading and runs
the service. Verify your environment anytime with make check.
2. Run the exporter
make up # build + start the exporter on 127.0.0.1:9464 (no Docker)
That's the whole product — a Prometheus endpoint at
http://127.0.0.1:9464/metrics (make metrics to eyeball it). make up is
also how you pick up edits to src/ (it re-imports; the daemon copies unit
scripts at import time). Stop it with make down.
3. Point Grafana at it
The exporter is a plain Prometheus endpoint, so add it to the Grafana +
Prometheus you already run — no Docker. make wire prints both steps with
absolute paths:
Prometheus — scrape the exporter. It binds
0.0.0.0:9464, so use127.0.0.1on the same host or the host's IP from a remote Prometheus
(firewall the port if the box is network-reachable):scrape_configs: - job_name: agentcap static_configs: - targets: ["127.0.0.1:9464"] # or "<host-ip>:9464" from elsewhereGrafana — with a Prometheus datasource in place, import
deploy/grafana/dashboards/agent-activity.json(Dashboards → New → Import);
pick your datasource if its uid isn'tprometheus. Re-import to update it
later (regenerate first withmake dashboardif you edited the generator).
No Grafana handy?
make demospins up a throwaway Prometheus + Grafana
in Docker with the dashboard pre-loaded, at
http://localhost:3000/d/agentcap/agent-activity.make downtears it back
down. Docker is only needed for this.
The service (service.toml) is three units: keeper (eager) holds the
collector shared worker — and the BPF probe and metric registry inside it —
alive; scrape (lazy, per-connection) renders one exposition document per
request over the console portal; web binds 0.0.0.0:9464 and mounts/metrics.
Changing the agent set
Edit src/agents.txt — one comm prefix per line, #
comments and blank lines ignored — then make up. Or override for one
run without editing anything:
make dev AGENTS=openclaw,claude,mybot # standalone, live dump, no HTTP
Make targets
| Target | What it does |
|---|---|
make up |
Build the probe and start the exporter on 127.0.0.1:9464 (no Docker). Alias: make exporter. Re-run to pick up src/ edits. |
make wire |
Print how to add the exporter to your own Grafana/Prometheus (scrape job + dashboard-import path). |
make demo |
Optional: run the exporter plus a throwaway Prometheus + Grafana in Docker, dashboard pre-loaded. |
make down |
Stop everything — the demo stack (if up) and the exporter service. |
make check |
Preflight: verify the yeet CLI, daemon, login, and Docker. |
make metrics |
curl the /metrics endpoint so you can eyeball the exposition. |
make status |
Show the running yeet service (yeet service tree). |
make dev |
Run the collector standalone — live registry dump, no HTTP. AGENTS=a,b,c overrides the watch set. |
make |
Compile the BPF object only (bin/probe.bpf.o). |
make veristat |
Load the object with veristat to check the verifier accepts it on this kernel (needs sudo). |
make dashboard |
Regenerate deploy/grafana/dashboards/agent-activity.json from the Python generator. |
make clean |
Remove build artifacts. |
Lower-level pieces make up/demo build on: make deploy (import + start the
service), make obs-up / make obs-down (just the Docker stack), andmake start / stop / restart / remove (service lifecycle).
The dashboard
The Agent Activity dashboard (deploy/grafana/dashboards/agent-activity.json)
is filterable by agent, with a stable color per agent across every panel. It
has four sections:
- Overview — hero stats, tracked tasks, tool-exec rates, a "which agent
ran what" table, top tools, CPU / network / file-I/O / churn timeseries. - Audit — who talked to what — per-agent domain and destination-port
tables (ports classified and color-coded: HTTPS/DNS green, SSH/SMTP
amber, telnet/RDP red, unknown neutral), plus DNS and connection rates. - Activity mix — CPU-share and egress-share donuts, a tool-launch bar
chart, an active/idle state-timeline across agents, and per-agent CPU
gauges — varied forms for a fast read. - Agent detail — $agent — a repeated, collapsed row per selected agent
with its own tools, lifecycle, CPU/tasks, network, domains and ports.
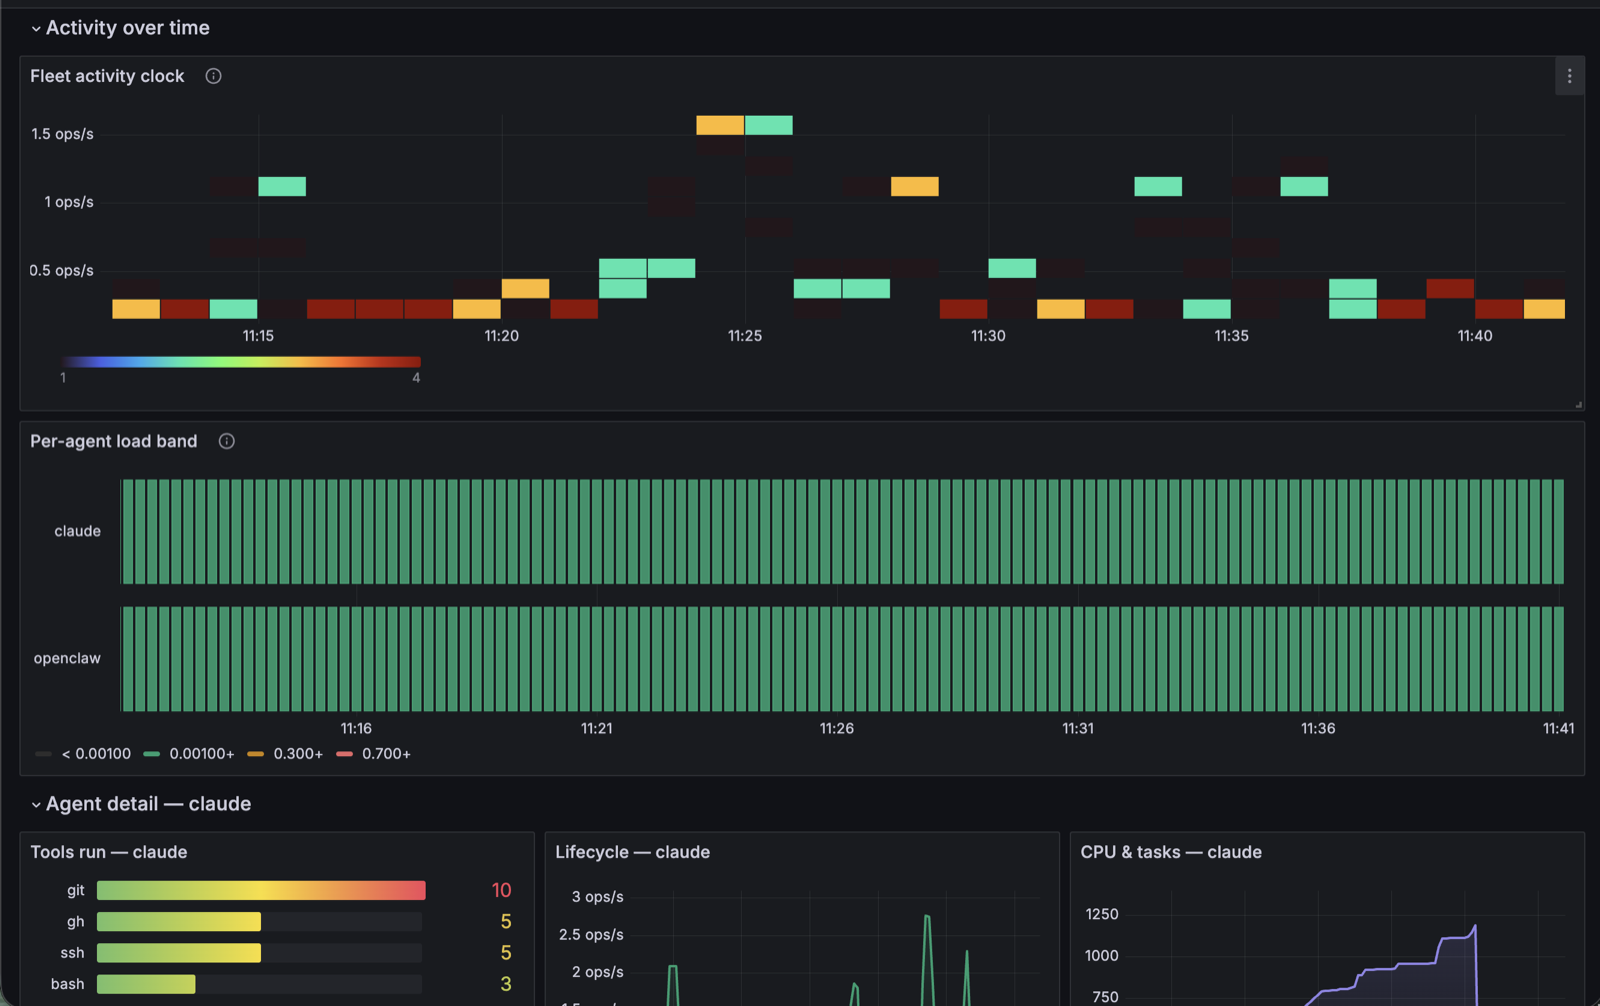
The dashboard is generated by deploy/grafana/gen-dashboard.py (edit the
Python, rerun it, Grafana's file provider reloads within 30s) so the panel
boilerplate and the per-agent color mapping stay consistent.
CI
.github/workflows/ci.yml— BPF object builds, JS syntax,service.toml
parses,promtool check config, dashboard JSON lint, compose config..github/workflows/kernel-matrix.yml— boots 6.1 / 6.6 / 6.12 / bpf-next
in VMs and runs veristat againstbin/probe.bpf.o; a rejection on an old
kernel is the signal of the minimum supported kernel (LSM + fexit programs
need BTF andCONFIG_BPF_LSM). Same check locally:make veristat-matrix.
Layout
src/bpf/agentcap.bpf.c   the probe: sched tracepoints + LSM + fexit
src/agents.txt           the tracked agent list (one comm prefix per line)
src/agents.js            parses agents.txt into the prefix array
src/collector.js         shared worker: fills kernel maps, owns the
                         Telemetry registry, polls counters, serve()s scrapes
src/scrape.js            per-request /metrics renderer (console portal)
src/main.js              eager keeper — holds the worker (and probe) alive
service.toml             yeet service: units, web server, /metrics route
deploy/                  prometheus.yml, docker-compose, grafana provisioning
Makefile                 build + run lifecycle (make up, wire, demo, …)
Customization
The whole thing is a small yeet script — a BPF program (src/bpf/*.bpf.c), a
JS collector (src/collector.js), and a generated dashboard
(deploy/grafana/gen-dashboard.py). Each of these is a one- or two-file
change, so point a coding agent at this repo and paste a prompt:
Watch a new agent
Add
mybotas a new line insrc/agents.txtand redeploy withmake up.
Then scrapehttp://127.0.0.1:9464/metricsand confirmagentcap_tasks{agent="mybot"}shows up while mybot is running. Leave the
other agents' matching unchanged.
Alert on suspicious egress
Add a Grafana alert rule that fires when
agentcap_net_connections_total
records a destination port outside {80, 443, 53} for any agent. Include theagentandportlabels in the notification text. Add the rule to the
generated dashboard so it ships with the repo.
Map where agents connect (geomap)
Extend the BPF
conn_eventto include the destination IP, decode it insrc/collector.js, and add a GeoIP lookup so each connect gets a country.
Expose it asagentcap_connections_by_country_total{agent,country}and add a
Grafana geomap panel indeploy/grafana/gen-dashboard.py. This should also
surface DoH/DoT egress that has no visible domain.
Add a metric
Add a gauge
agentcap_agents_totalinsrc/collector.jscounting agents
with at least one live task, updated on the existing poll loop. Register it in
the telemetry registry next to the others. Then add a stat tile for it in the
dashboard generator and rerunmake dashboard.
Restrict what's watched
Change the probe so it only tracks agents whose process is under a given
systemd unit or cgroup, and add that as a metric label. Keep the comm-prefix
matching fromsrc/agents.txtas a second filter. Document the new option in
the README's Setup section.
Ship it somewhere else
Add a second scrape route to
service.tomlthat renders the registry as
OpenMetrics or JSON instead of Prometheus text. Reuse the shared collector
worker so it reports the same data. Updatemake wireto mention the new
endpoint.
Built with yeet,
a JS runtime for writing eBPF programs and live system dashboards on Linux.
Join us on Discord.
Reviews (0)
Sign in to leave a review.
Leave a reviewNo results found