claude-meter
Health Warn
- No license — Repository has no license file
- Description — Repository has a description
- Active repo — Last push 0 days ago
- Community trust — 74 GitHub stars
Code Pass
- Code scan — Scanned 12 files during light audit, no dangerous patterns found
Permissions Pass
- Permissions — No dangerous permissions requested
This tool acts as a local proxy that intercepts traffic between Claude Code and Anthropic's API. It captures, normalizes, and logs rate-limit signals to help users understand and reverse-engineer hidden usage quotas.
Security Assessment
The proxy requires access to all API traffic passing between your local client and Anthropic, meaning it routinely handles highly sensitive conversational data and API keys. The automated code scan found no hardcoded secrets, malicious network callbacks, dangerous permissions, or suspicious execution patterns. It actively redacts sensitive headers and restricts file permissions for local logs. However, because it sits in the middle of your secure API requests, overall risk is rated Medium.
Quality Assessment
The project is actively maintained, with its most recent push occurring today. It enjoys a solid level of community trust with 74 GitHub stars. The primary concern is the complete lack of a license file, which legally means the code is strictly "all rights reserved" and technically cannot be copied, modified, or distributed without explicit permission from the creator. Furthermore, the developer openly states this is an early-stage alpha research tool, not a polished product.
Verdict
Use with caution: the code itself is safe and contains no malicious behavior, but you must be comfortable routing your sensitive API traffic through an unlicensed, experimental proxy.
Tracking Claude Code Usage Limits
Claude Meter
claude-meter is a local research proxy for understanding how Claude Code usage maps to Anthropic's hidden quota system.
The core problem is simple:
- Claude Max / Pro users can see rough usage state, but not the real hidden budget
- Anthropic appears to enforce multiple windows such as
5hand7d - Claude Code traffic includes useful usage and rate-limit signals, but they are not surfaced in a way that is easy to study over time
claude-meter sits between Claude Code and Anthropic, captures those signals locally, normalizes them, and helps estimate rough budget bands from real traffic.
Status
This project is currently an alpha research tool, not a polished end-user product.
What that means:
- it is already useful for reverse-engineering and observing hidden quota behavior
- it is not yet an exact “Claude Max limit meter”
- current estimators produce rough ranges, not precise truth
The right way to think about the project today is:
working local proxyworking local data captureworking local normalizationearly-stage estimator
What We Are Trying To Do
The immediate goal is to answer questions like:
- what
5hand7dquota windows does Claude Code actually see? - how do different models affect those windows?
- do cache reads behave more like cheap API cost than raw token count?
- can we estimate a rough
5hbudget band with enough confidence to track changes over time?
The longer-term goal is bigger:
- help users understand their own hidden Claude usage limits
- detect changes in Anthropic behavior over time
- eventually compare behavior across plans, models, and accounts
What Already Works
Proxy
- transparent pass-through proxy for
api.anthropic.com - asynchronous logging so proxying stays ahead of disk writes
- all capture is local
- color-coded CLI logging for every request (model, tokens, utilization)
- periodic status summaries via
--status-interval - live web dashboard at
http://localhost:7735with auto-refresh setupsubcommand to auto-configure your shell
Raw Capture
- full raw request / response exchange capture
- raw JSONL written under
~/.claude-meter/raw/ - request / response bodies persisted locally
- sensitive headers redacted before persistence
- raw directories and files created with private permissions
Normalization
- normalized JSONL written under
~/.claude-meter/normalized/ - background derivation from raw exchanges
/v1/messagesparsing/v1/messages/count_tokensparsing- SSE parsing for real streamed Claude responses
- best-effort handling for partial gzip event streams
- header-driven fallback records for unknown endpoints
Observed Signals
From live Claude Code traffic, claude-meter can already capture:
anthropic-ratelimit-unified-*headers5hand7dutilization windows- model-specific windows such as
7d_sonnetwhen present input_tokensoutput_tokenscache_creation_input_tokenscache_read_input_tokens- model names
- session ids
- declared plan tier
Analysis
The current analysis layer can already:
- summarize observed windows
- compare raw-token and price-weighted usage formulas
- build interval-based estimates
- compute filtered
5hestimate bands - estimate dollar budgets per 5h and 7d window using API pricing
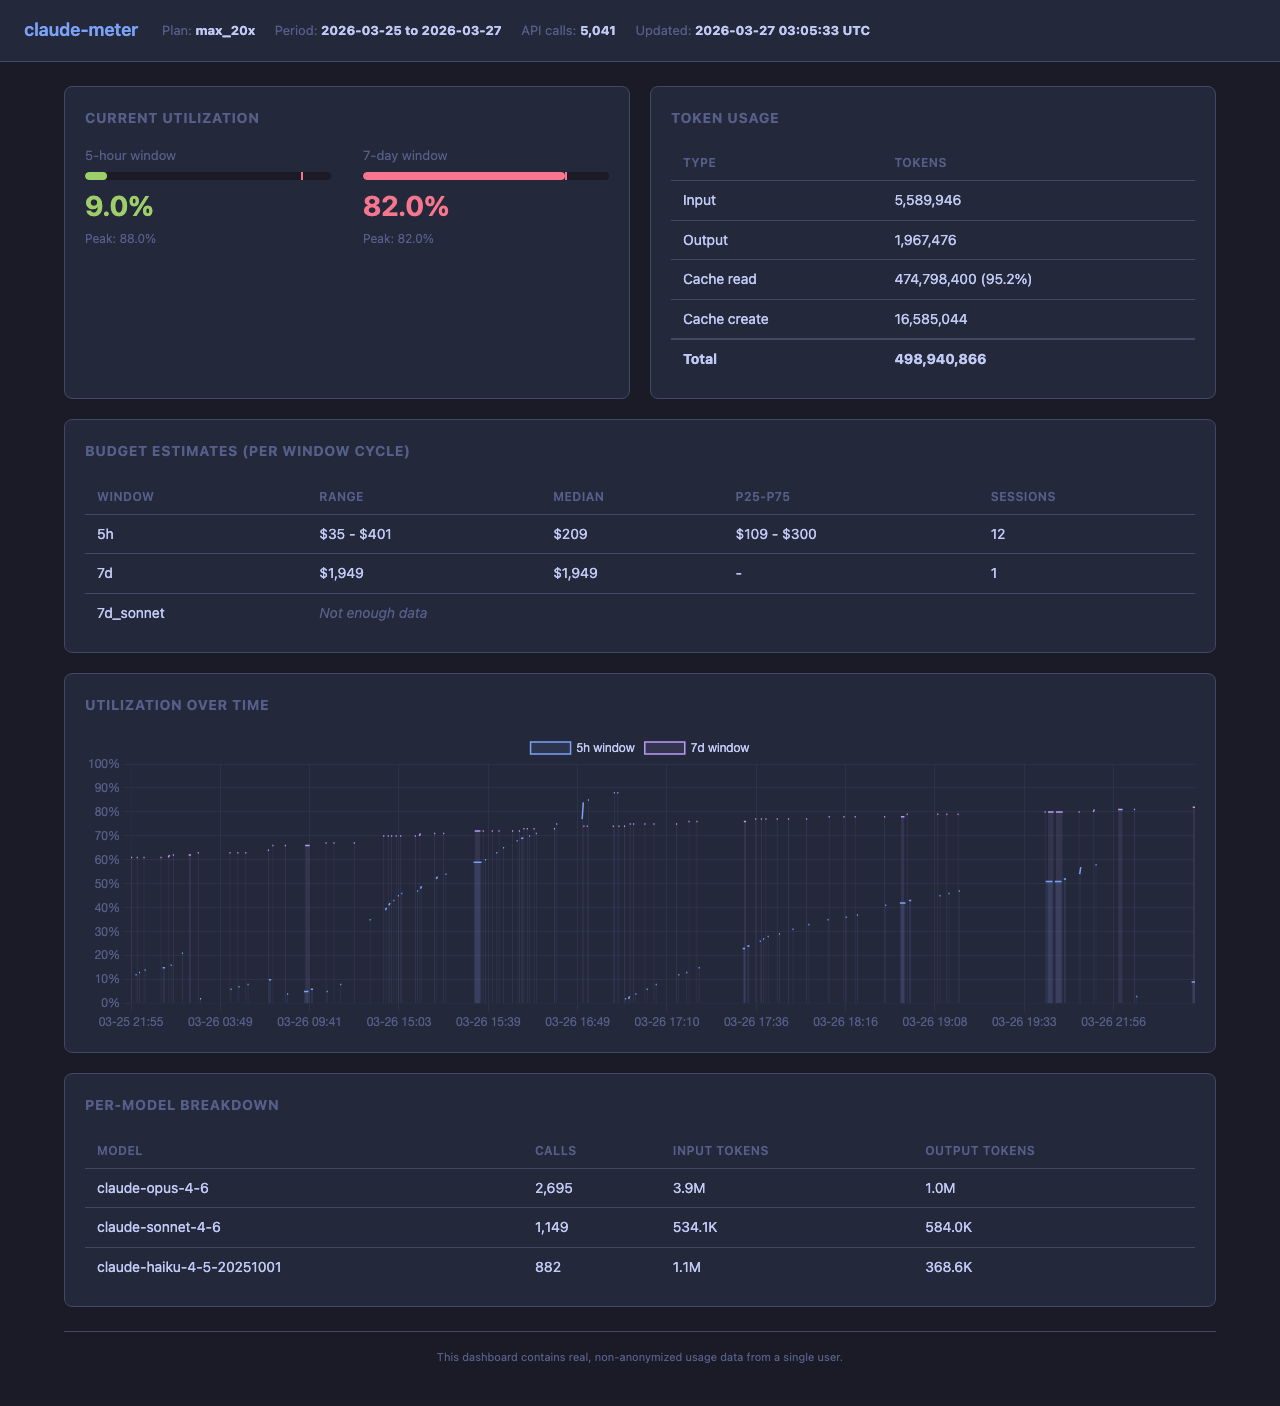
- show token usage breakdown (input, output, cache read, cache create)
- report current and peak utilization per window
- output a human-readable summary via
--summaryflag
What Is Not There Yet
These are important gaps, not footnotes:
- no exact hidden-limit estimator
- no high-confidence scoring yet
- no automatic reset-aware experiment mode
- no packaged installer or background service
- no built-in anonymized sharing flow
- no cross-account comparison yet
- no strong claim that the current estimate band is “the true limit”
In particular, the estimator still has outliers. That is expected at this stage. The data capture is real; the hard part is interpreting a coarse hidden utilization meter.
Current Working Thesis
The current working thesis is:
- raw token counting is too naive
- price-weighted usage appears to explain Anthropic's hidden
5hmeter better than raw token totals - cache reads should likely be weighted much more cheaply than fresh input or output
- the useful product output is probably a
rough 5h budget band, not a fake exact cap
So the project is moving toward:
- “you probably have roughly this much
5hbudget” - not “you have exactly
Ntokens remaining”
How It Works
- Claude Code is pointed at the local proxy with
ANTHROPIC_BASE_URL - The proxy forwards all traffic upstream unchanged
- Raw exchanges are stored locally
- A background normalizer derives structured records
- Offline analysis scripts estimate behavior from those records
This separation is deliberate:
- live traffic path stays simple
- raw capture remains the local source of truth
- normalization can evolve
- estimator logic can be rewritten without touching the proxy
Quickstart
Option 1: One-liner install (builds from source)
curl -sSL https://raw.githubusercontent.com/abhishekray07/claude-meter/main/install.sh | bash
Option 2: Manual install (review source first)
git clone https://github.com/abhishekray07/claude-meter.git
cd claude-meter
go build -o claude-meter ./cmd/claude-meter
./claude-meter start --plan-tier max_20x
Auto-configure your shell
claude-meter setup
This detects your shell (bash, zsh, fish) and adds the ANTHROPIC_BASE_URL export to your rc file so Claude Code always routes through the proxy.
Run from source
Run the proxy:
go run ./cmd/claude-meter start --plan-tier max_20x
Point Claude Code at it (or use claude-meter setup to make this permanent):
ANTHROPIC_BASE_URL=http://127.0.0.1:7735 claude
Backfill normalized records from existing raw logs:
go run ./cmd/claude-meter backfill-normalized --log-dir ~/.claude-meter --plan-tier max_20x
Run the analyzer (human-readable summary):
python3 analysis/analyze_normalized_log.py ~/.claude-meter --summary
This reads all normalized logs and outputs:
claude-meter analysis
========================================

Plan: max_20x
API calls: 4,721
Period: 2026-03-25 21:55 -> 2026-03-26 22:15

Token Usage
--------------------
  Input:             5,509,548
  Output:            1,850,132
  Cache read:      443,884,520 (95.1%)
  Cache create:     15,574,984

Current Utilization
--------------------
  5h           2% (peak: 88%)
  7d           81% (peak: 81%)
  7d_sonnet    37% (peak: 37%)

Estimated 5h Budget (11 sessions observed)
--------------------
  Range:   $35 - $401
  Median:  $164
  p25-p75: $99 - $291

Estimated 7d Budget (1 session observed)
--------------------
  Estimate: ~$1,949

By Model
--------------------
  claude-opus-4-6                          2,423 calls
  claude-sonnet-4-6                        1,146 calls
  claude-haiku-4-5-20251001                  855 calls
For raw JSON output (e.g. for piping to other tools):
python3 analysis/analyze_normalized_log.py ~/.claude-meter/normalized/2026-03-26.jsonl --pretty
Generate charts and a markdown report:
python3 analysis/report.py ~/.claude-meter --output /tmp/cm-report
CLI Logging
When the proxy is running, every API request is logged to stderr with color-coded output:
- Success (2xx): model name, token counts (input/output/cache), and rate-limit utilization
- Rate limited (429): red warning with utilization percentages and retry-after
- Errors (4xx/5xx): status code and message in yellow
Utilization colors: green (<50%), yellow (50-80%), red (>=80%). Respects NO_COLOR for plain output.
Use --status-interval N to print a periodic summary every N requests showing total counts, per-model breakdown, and current utilization.
Dashboard
The dashboard is built into the proxy. Just open your browser:
http://localhost:7735
When the proxy is running, visiting that URL in a browser serves a live dashboard with utilization gauges, budget estimates, and time-series charts. API requests from Claude Code continue to proxy normally.
You can also generate a standalone HTML file:
python3 analysis/dashboard.py ~/.claude-meter --output index.html --open
Publish to GitHub Pages with one command:
make dashboard
This generates the HTML from your local data, then pushes it to the gh-pages branch.
Privacy and Safety
Right now this is intentionally local-first.
- raw logs stay on disk on your machine
- headers with obvious secrets are redacted before persistence
- prompts and responses may still be present in local raw logs
This is acceptable for a research tool, but it is not yet the final product privacy posture.
Roadmap
Now
- tighten the estimator
- improve interval hygiene
- produce better
5hestimate bands - make the README and install path clear enough for alpha users
Next
- add confidence scoring for estimate bands
- detect reset boundaries more explicitly
- improve model-aware analysis
- make it easier to run the proxy by default in daily Claude Code usage
- add better export / snapshot tooling for sharing findings
Later
- compare plan tiers cleanly
- support anonymized summary sharing
- build a crowdsourced view of hidden quota behavior
- detect Anthropic changes over time across many users
- possibly add a lightweight UI on top of the local data
Why Crowdsourcing Would Help
One account can tell you:
- what your own hidden meter appears to do
- what your own rough
5hband looks like
Many accounts can tell you:
- whether
Pro,Max, and higher tiers behave differently - whether the same estimator works across accounts
- whether model-specific buckets are universal or account-specific
- whether Anthropic changes hidden limits over time
- whether an estimate band is stable or just a single-user artifact
That is why the long-term value is not just local observability. It is eventually building a better map of the hidden system.
Repo Layout
- cmd/claude-meter: proxy entrypoint, backfill command, and setup subcommand
- internal/app: application lifecycle, CLI logging, color output, and embedded dashboard
- internal/proxy: transparent HTTP proxy
- internal/normalize: response parsing and normalized record derivation
- internal/storage: raw and normalized JSONL writers
- analysis: offline estimators and supporting scripts
- docs/plans: implementation plans and design notes
Current Recommendation
If you use claude-meter today, use it as:
- a local observability tool
- a research proxy
- a way to collect evidence
Do not use it yet as:
- a precise quota oracle
- a billing truth source
- a final “remaining tokens” meter
Reviews (0)
Sign in to leave a review.
Leave a reviewNo results found