dataranger
Health Uyari
- License — License: MIT
- Description — Repository has a description
- Active repo — Last push 0 days ago
- Low visibility — Only 5 GitHub stars
Code Gecti
- Code scan — Scanned 12 files during light audit, no dangerous patterns found
Permissions Gecti
- Permissions — No dangerous permissions requested
Bu listing icin henuz AI raporu yok.
Open-source AI agent that patrols your data, fixes only what it can prove against the source, and sends the rest to a person with the evidence. Works with Snowflake, dbt and DuckDB, runs as a GitHub Action, and speaks MCP.

DataRanger patrols your data, fixes what it can prove, and calls you for the rest.
A park ranger walks the trails, fixes what is safe to fix on the spot, radios in anything dangerous, and files a report. DataRanger does the same for your tables. It finds data-quality incidents, tests every candidate fix on a copy against the source's control totals, applies only the fixes it can prove, and keeps wrong fixes under a rate you choose. Everything else goes to a person, with the evidence attached.


The dotted line under the name is a patrol trail: one marker per daily partition, the same marks the patrol console uses.
Most data-quality tools stop at an alert. Letting an AI agent fix data is the obvious next step, and a risky one: a wrong fix can pass every monitor you have. In the DQ-Repair benchmark, a rules engine left wrong data behind in 31% of incidents and an agent checked only by monitors in 24%. DataRanger's calibrated gate kept it under 1% while handling 59% of incidents without a person.
The patrol loop
- Detect. Rules and statistics find nulls, duplicates, schema drift, late partitions, broken references, unit errors and silent shifts. No LLM.
- Diagnose. A language model answers one narrow question: what is the likely cause?
- Propose fix. A templated fix (dedupe, backfill, quarantine, patch). The model fills in parameters only.
- Verify. pipeverify checks the fix against source data, on a copy.
- Gate. Proven and low risk: applied as a new version, never an overwrite. Anything else: escalated.
- Report. Every detection, fix and decision lands on a live dashboard and an audit log.
The patrol console
Every patrol writes one self-contained page that answers a data team's morning question: what broke, what DataRanger fixed, and what needs a person.
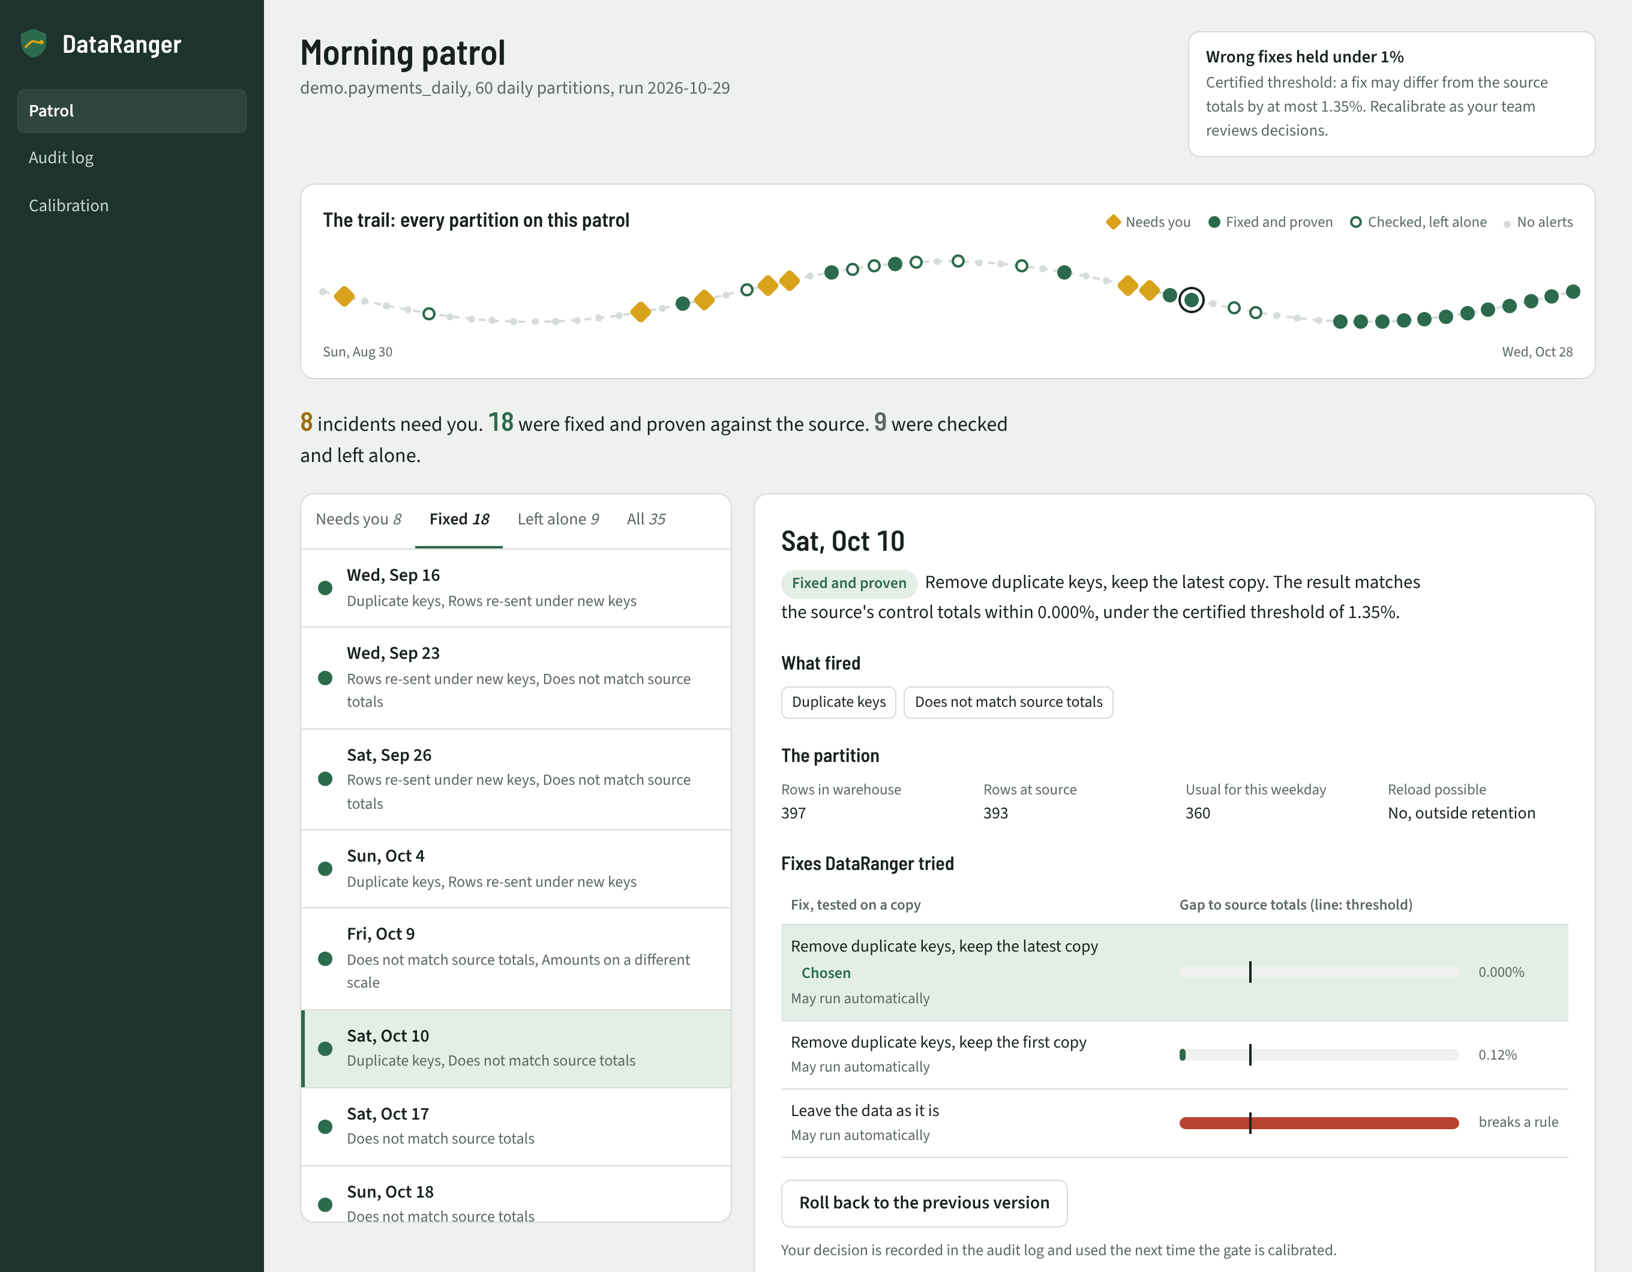
- The trail across the top shows every daily partition on the patrol. Yellow diamonds need you, solid green markers were fixed and proven against the source, hollow ones were checked and left alone.
- The queue lists incidents by what they need from you.
- The evidence view shows what fired, the partition next to its source totals, and every fix DataRanger tested on a copy, with its gap to the source against the certified threshold. Above, two copies of re-sent rows disagree: keeping the first copy would leave a 0.12% gap, so DataRanger kept the latest copy, which matches exactly.
- Decisions (approve, reject, roll back, reopen) are recorded in the audit log and feed the next calibration.
Try it

Run the demo notebook in your browser to see the
summary, audit rows and interactive dashboard without installing anything locally.
pip install dataranger
dataranger demo                 # patrol a sample table with planted problems; opens as dataranger-demo/dashboard.html
On your own DuckDB tables (a fact table partitioned by date, a reference table, and the source's control totals):
dataranger patrol --db warehouse.duckdb --table payments --ref-table customers \
    --manifest-table control_totals --key payment_id --reference customer_id \
    --date booking_date --segment channel --amount amount
Or point it straight at exported files, no database needed (.csv, .tsv or .parquet; the reader follows the extension):
dataranger patrol --facts-file payments.csv --ref-file customers.csv \
    --manifest-file control_totals.csv --key payment_id --reference customer_id \
    --date booking_date --segment channel --amount amount
Use one source at a time. With files, --table is optional and only sets the report title (it defaults to the facts file name). Add --days 45 to any source to patrol only the most recent days.
The control-totals table has one row per date and segment, plus a row with segment * for the whole day, with columns n (rows) and amount (sum). DataRanger never modifies your tables: fixed partitions go to fixed_version.csv, every decision and its evidence to audit.jsonl, a one-row-per-incident summary for spreadsheets to incidents.csv, and the morning report to dashboard.html.
For scheduled jobs, add --json to either patrol command to print one JSON object withincidents, auto_fixed, no_action, escalate, and the report path. Add--fail-on-escalate to return exit code 2 when any incident needs review, or 0 otherwise.
The flags work independently: --fail-on-escalate also works with the normal text summary.
To run a daily patrol and download the morning report, copy the
GitHub Actions example. It runs on demo data without credentials
and includes instructions for your own tables.
The default threshold was calibrated on the DQ-Repair benchmark for a 1% target. Once people have reviewed some of DataRanger's decisions, calibrate on your own data:
dataranger calibrate --audit report/audit.jsonl --labels reviewed.csv --alpha 0.01
reviewed.csv has columns partition and verdict (right or wrong). About 300 reviewed incidents certify a 1% target and about 60 certify 5%.
Where it runs
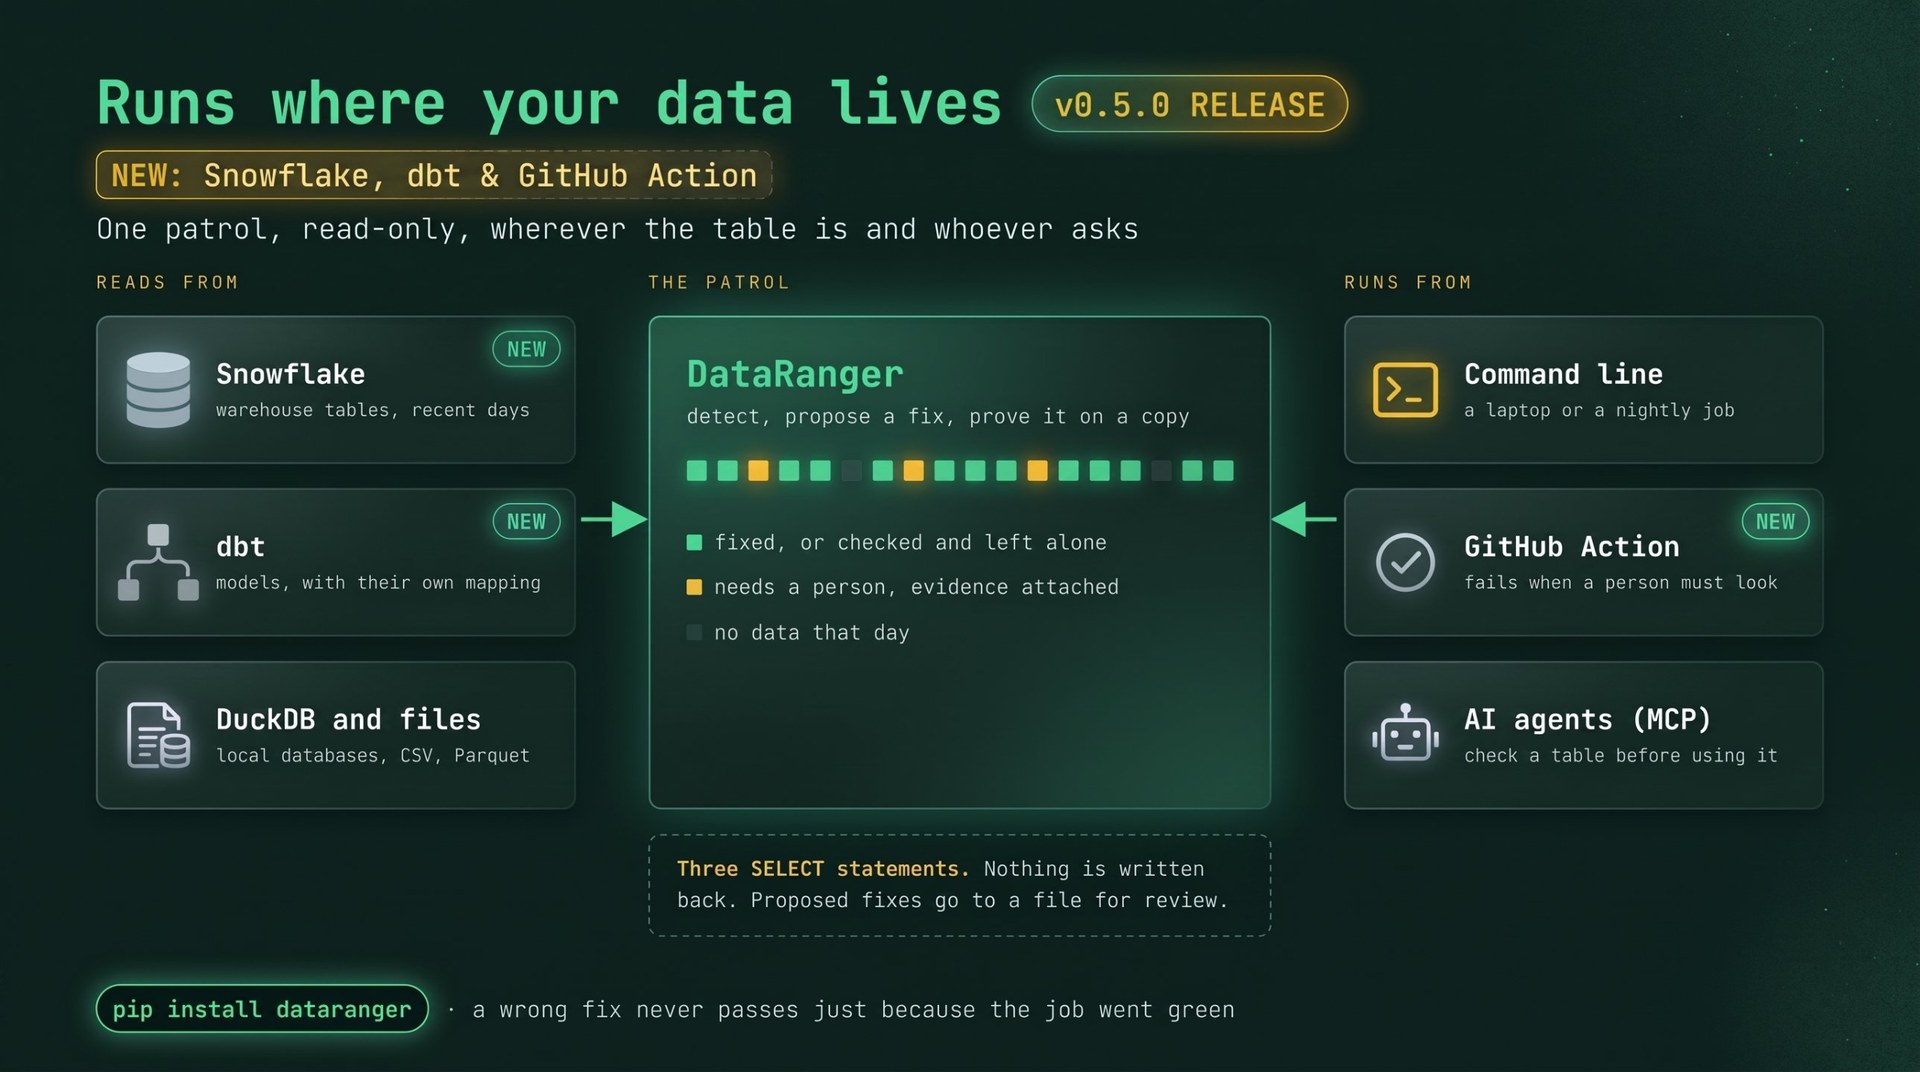
DataRanger reads from Snowflake, dbt models, DuckDB and files, and runs from the command line, a GitHub Action or an AI agent. Whatever the source, a patrol is three SELECT statements: nothing is written back.
Snowflake
pip install "dataranger[snowflake]"
dataranger patrol --snowflake --table ANALYTICS.GOLD.PAYMENTS --ref-table ANALYTICS.GOLD.CUSTOMERS \
    --manifest-table ANALYTICS.OPS.CONTROL_TOTALS --key payment_id --reference customer_id \
    --date booking_date --segment channel --amount amount --days 45
DataRanger runs three SELECT statements and nothing else, so a read-only role is enough and the warehouse is never modified. It selects only the mapped columns, and --days limits both the facts and the control totals, so a patrol costs a few seconds of a small warehouse. Use at least 30 days so the checks have a baseline. Queries carry the query tag dataranger, so they are easy to find in query history.
Credentials are read from where you already keep them; DataRanger stores nothing:
--snowflakeusesSNOWFLAKE_ACCOUNTandSNOWFLAKE_USER, withSNOWFLAKE_PASSWORD,SNOWFLAKE_PRIVATE_KEY_PATH(andSNOWFLAKE_PRIVATE_KEY_PASSPHRASE) orSNOWFLAKE_AUTHENTICATOR, plusSNOWFLAKE_ROLE,SNOWFLAKE_WAREHOUSE,SNOWFLAKE_DATABASEandSNOWFLAKE_SCHEMA. With multi-factor login, setSNOWFLAKE_AUTHENTICATOR=username_password_mfaand put the current code from your authenticator app inSNOWFLAKE_PASSCODE. For scheduled jobs, use a key pair.--snowflake produses the connection namedprodin~/.snowflake/connections.toml, the file the Snowflake CLI uses.
Column names are matched without regard to case, so --key payment_id finds PAYMENT_ID. To try it on a trial account with demo data, follow examples/snowflake.
dbt
Patrol the table behind a dbt model. DataRanger reads dbt's target/manifest.json to find the table and profiles.yml to connect (DuckDB and Snowflake targets), then queries the warehouse itself; it does not run dbt.
Keep the column mapping with the model:
models:
  - name: fct_payments
    meta:
      dataranger:
        ref_model: dim_customers
        manifest_model: control_totals
        key: payment_id
        date: paid_on
        segment: channel
        amount: amount
pip install "dataranger[dbt]"        # add the snowflake extra for a Snowflake target
dbt build
dataranger patrol --dbt-model fct_payments --days 45
Flags such as --key or --dbt-ref-model override the meta block, and --dbt-target prod picks another target. There is a complete project you can run without a warehouse in examples/dbt.
GitHub Action
Run a patrol in CI, after a load or on a schedule. The action writes the result to the job summary, uploads the report, and fails the job when an incident needs a person.
- uses: akshaysharma1088/[email protected]
  with:
    snowflake: "true"
    table: ANALYTICS.GOLD.PAYMENTS
    ref-table: ANALYTICS.GOLD.CUSTOMERS
    manifest-table: ANALYTICS.OPS.CONTROL_TOTALS
    key: payment_id
    date: booking_date
    days: "45"
  env:
    SNOWFLAKE_ACCOUNT: ${{ secrets.SNOWFLAKE_ACCOUNT }}
    SNOWFLAKE_USER: ${{ secrets.SNOWFLAKE_USER }}
    SNOWFLAKE_PASSWORD: ${{ secrets.SNOWFLAKE_PASSWORD }}
    SNOWFLAKE_ROLE: READER
    SNOWFLAKE_WAREHOUSE: XS
After dbt build, one line is enough when the mapping is in the model's meta block:
- uses: akshaysharma1088/[email protected]
  with:
    dbt-model: fct_payments
The same inputs work for DuckDB (db, table, ref-table, manifest-table) and files (facts-file, ref-file, manifest-file). Set fail-on-escalate: "false" to report without failing. The outputs incidents, auto-fixed, no-action, escalate and report are available to later steps. All inputs are listed in action.yml.
Use it from an AI agent (MCP)
Agents now change pipelines and query data on their own. DataRanger can run as an MCP server, so an agent can check a table before it trusts it, and hand anything it cannot prove to a person.
With uv there is nothing to install first. Claude Code:
claude mcp add dataranger -- uvx dataranger mcp
Claude Desktop, Cursor or VS Code (add to the client's MCP config):
{
  "mcpServers": {
    "dataranger": { "command": "uvx", "args": ["dataranger", "mcp"] }
  }
}
Or pip install dataranger and use dataranger mcp as the command. DataRanger is listed in the MCP Registry as io.github.akshaysharma1088/dataranger.

The server exposes six tools:
| Tool | What it does |
|---|---|
patrol_duckdb |
Patrol a fact table in a DuckDB file, with your column names |
patrol_files |
Patrol exported CSV, TSV or Parquet files |
patrol_snowflake |
Patrol a Snowflake table, reading only the last N days |
patrol_dbt |
Patrol the table behind a dbt model, using the mapping in its meta block |
get_incident |
Return the full evidence for one incident from a previous patrol |
run_demo |
Patrol generated data with planted problems, to see the output |
Each patrol returns the counts (auto-fixed, no action needed, escalate), the incidents that need a person, and the paths to the dashboard, audit log and proposed fixed version.
The tools are read-only towards your data. Inputs are opened read-only, nothing is written back, and fixes exist only in the proposed fixed version for review. An agent can learn what is wrong and what DataRanger could prove; it cannot change your warehouse through this server.
Try asking your agent: "Use DataRanger to run the demo and tell me which partitions need a person, and why."
DQ-Repair benchmark
DQ-Repair measures how many data-quality issues an agent can fix safely. This branch adds the benchmark data and the detection stage.
Synthetic cases. A transactions table and a customer dimension, generated per seed in three sizes (about 24k, 120k and 480k rows over 60 days). Each case keeps the source of record and a dirty warehouse copy with known issues and the correct fix for each:
| Type | What happens | Correct response |
|---|---|---|
| Duplicates | A retried load appends 1 to 8% of a partition again | Dedupe on txn_id |
| Late partition | A day's file arrives after the job ran | Reload the partition |
| Schema drift | Upstream renames channel to payment_channel |
Remap, after review |
| Broken references | A bad key mapping points rows at missing customers | Quarantine, escalate |
| Unit or scale | One channel starts sending cents | Rescale by 0.01 |
| Silent drop | A join change quietly drops one slice of a day | Reload the partition |
| Decoys | A promotion day or a big-ticket travel day, real in the source | Do nothing |
Real datasets. Hospital, Flights and Beers, the standard cell-level cleaning datasets with known clean versions, downloaded on first use from the Raha repository at a pinned commit.
Detection so far (deterministic, no LLM, results/detection.json):
- Synthetic, 5 seeds per size: the statistical monitors find every structural error, 60 to 100% of silent drops, and none of the partial-late partitions. Every decoy is flagged too, which is the point: detection cannot tell a real spike from an error, so the later stages must.
- Hospital: F1 0.83. Beers: F1 0.98. Flights: F1 0.10 with no configuration, 0.50 when told the entity key (
flight).
pip install -e .
dataranger bench --size small --seed 1        # one synthetic case
python benchmarks/run_detection.py            # all sizes and the real datasets
Repair with a calibrated gate
The loop proposes template fixes for each incident, checks every candidate against the source's control totals and the declared invariants (unique keys, valid references), and applies the best-supported fix only if its residual clears a threshold chosen by Learn-then-Test. Fixes that delete data or change meaning always escalate. The source publishes control totals per partition and channel; 15% of them are stale by up to 1%, so even a correct fix can leave a small residual.
250 instances (150 small, 100 medium), 6,600 incidents, 100 random calibration and test splits by instance, delta = 0.05. Silent harm is the share of incidents that end with a wrong fix applied. All numbers are in results/repair_summary.json.
| Policy | Auto-applied | Silent harm | Real errors fixed |
|---|---|---|---|
| Rules: default fix for every alert | 66.6% | 31.1% | 49.3% |
| Agent checked by the monitors | 58.2% | 23.8% | 49.7% |
| Verified, calibrated for alpha = 1% | 58.6% | 0.56% | 56.4% |
| Verified, calibrated for alpha = 2% | 69.4% | 1.42% | 59.0% |
| Verified, calibrated for alpha = 5% | 79.3% | 3.91% | 61.1% |
- The bound holds. Test harm exceeded alpha in 1 to 5% of splits, within delta = 5%, for both evidence granularities.
- Versioned duplicates. Rules and the monitor-checked agent kept the pre-settlement copy in 500 and 498 of 500 such incidents; the gate picked the settled copy by its match to the control totals.
- Hand-picked thresholds do not travel. A threshold of 0.01 is safe with per-channel totals but breaks a 1% target in every split when only partition totals exist; calibration moves the threshold to 0.003 on its own.
- Exchangeability matters. Calibrated without any partial-late incidents, the gate then wrongly applies "no action" to 67% of them. New incident types need recalibration, which is what epoch recalibration with repair memory is for.
- Source-aware detection. The statistical monitors miss every partial-late partition; a reconciliation check against the control totals catches all of them.
python benchmarks/run_repair.py 150 100       # about 6 minutes on two cores
python benchmarks/analyze_repair.py
Language models as proposers
Qwen2.5 7B and 14B, served by Ollama on free GitHub Actions runners (.github/workflows/llm.yml, triggered by pushing to the llm-run branch; responses are committed to llm-results), proposed one fix per incident. At a 5% target:
| Model | Policy | Automated | Harm | Real errors fixed |
|---|---|---|---|---|
| 7B | Apply the model's fix | 93.4% | 42.4% | 23.6% |
| 7B | Apply it if the monitors go quiet | 66.5% | 29.4% | 23.3% |
| 7B | Apply it if its own gap to the totals is under 0.5% | 33.6% | 5.58% | 20.8% |
| 7B | Through the gate | 27.2% | 3.19% | 20.4% |
| 7B | Gate over model + templates | 79.3% | 3.17% | 63.4% |
| 14B | Apply the model's fix | 92.8% | 35.5% | 40.1% |
| 14B | Apply it if its own gap to the totals is under 0.5% | 39.5% | 5.22% | 33.8% |
| 14B | Through the gate | 32.3% | 2.43% | 31.9% |
The models' fixes were right for 51% (7B) and 57% (14B) of incidents. An agent that checks its own fix against the control totals is not enough: with a 0.5% tolerance it still breaks a 5% target, while the same tolerance is safe for the pooled candidates. The safe tolerance depends on the proposer, which is what calibration measures. python benchmarks/eval_llm.py <runs/<id>/llm> reproduces the table.
TPC-DS
The same loop on a benchmark we did not design: TPC-DS store_sales at scale factor 1 (DuckDB's dsdgen), store as the segment for control totals, item category as the category, net paid as the amount. Thirty 60-day windows, three injections each: 4,299 incidents, 58% of them false alarms from TPC-DS's seasonal volume. Splits are by window.
| Policy | Automated | Silent harm | Real errors fixed |
|---|---|---|---|
| Rules: default fix per alert | 82.8% | 63.4% | 44.0% |
| Fix must quiet the monitors | 40.1% | 31.6% | 22.2% |
| Calibrated on TPC-DS, alpha = 1% | 77.6% | 0.59% | 55.8% |
| Calibrated on TPC-DS, alpha = 5% | 90.7% | 3.74% | 61.6% |
| Calibrated on DQ-Repair, applied to TPC-DS, alpha = 1% | 75.8% | 0.47% | 54.9% |
pip install -e ".[bench]"                      # includes the DuckDB tpcds extension
python benchmarks/run_tpcds.py 1 3             # about 6 minutes on two cores
python benchmarks/analyze_tpcds.py
How strong is the guarantee?
Learn-then-Test assumes independent incidents, and incidents of one table share its manifest. benchmarks/analyze_guarantee.py measures it: the intraclass correlation of the loss within an instance is about 0.005 (design effect at most 1.16). calibrate_clusters makes the table the unit instead, which needs no independence inside a table; it certifies 5% and 10% targets from 125 tables, and needs about 300 tables for 1%.
Larger tables
On 40 large instances (about 480k rows each, 1,069 incidents), a threshold calibrated on small and medium tables gave 0.75%, 1.87% and 5.24% harm at targets of 1, 2 and 5%: close to target and just above it at 5%, since relative gaps shrink as partitions grow. Calibrating separately for "no action" decisions and for repairs (calibrate_groups) transferred with margin: 0.28%, 1.59% and 4.40%.
Repair memory under drift
benchmarks/run_stream.py simulates a year: five data estates of ten tables each, a new incident type (partial-late partitions) from month 5, and staler control totals from month 9. At a 2% target:
| Policy | Silent harm | Automated | Months over target |
|---|---|---|---|
| Calibrated once | 3.05% | 75.4% | 60% |
| Recalibrated monthly | 1.30% | 62.4% | 18% |
| Monthly + repair memory | 0.39% | 55.0% | 7% (all in month 5) |
Memory (dataranger.repair.memory) escalates unfamiliar incident signatures, blocks signatures whose fixes went wrong, and recalibrates on what it would have done. It recovered from the new incident type within a month (harm on partial-late incidents 32% in month 5, 5% in month 6). The price is automation: when the world changes, staying inside the promise means asking people more often.
Sensitivity and cost
benchmarks/ablations.py (results in results/ablations.json):
- Labels needed. A 5% target is certifiable from about 130 labeled incidents (66% automated); a 1% target needs about 300 before anything is automated, then reaches 50% at about 530 and 59% at 3,300.
- Stale control totals. At a 1% target, automation falls from 71% with exact totals to 29% when half of them are stale; harm stays under target.
- Corrupt control totals (
run_corrupt.py,analyze_corrupt.py): totals computed downstream of the error agree with the wrong data, so no check against them can see it. Calibrated on the same corrupted source, the gate fails safe (no threshold certified at 1%); calibrated on clean totals and then hit by corruption, the bound breaks like under any drift. Such a source needs a second, independent check. - Without invariant checks the calibration refuses to certify any threshold and automation collapses to about 0%: the gate fails safe.
- Cost. A full patrol takes 2.7 s, 4.1 s and 10.1 s on one CPU core for 23k, 117k and 470k-row tables.
Real datasets: Hospital, Flights, Beers
No source of record here, so the evidence comes from the table itself (agreeing dependencies, normalization rules). Half the rows are labels: a quarter fits an evidence score and a quarter certifies the threshold. Compared on held-out rows with Baran (20 labeled tuples, Raha detection) and conformal data cleaning (reimplemented, trained on clean rows):
| Data | Method | Errors fixed | Precision | Wrong per 1k cells |
|---|---|---|---|---|
| Hospital | Baran | 55.0% | 93.5% | 0.96 |
| Hospital | Conformal cleaning | 85.0% | 64.7% | 11.80 |
| Hospital | DataRanger, alpha 5% | 62.8% | 98.2% | 0.37 |
| Flights | Baran | 51.2% | 81.7% | 34.37 |
| Flights | Conformal cleaning | 51.6% | 94.6% | 8.83 |
| Flights | DataRanger, alpha 5% | 25.0% | 95.3% | 3.67 |
| Beers | Baran | 89.2% | 94.0% | 9.46 |
| Beers | Conformal cleaning | 64.9% | 60.2% | 70.40 |
| Beers | DataRanger, alpha 1% | 85.0% | 100.0% | 0.02 |
The target held in every split. Baran's corrections are in results/baran/; benchmarks/run_baran.py reproduces them (it needs pip install raha).
Reproducing the paper
pip install -r environment.txt && pip install -e .   # the exact versions used for the paper
./reproduce.sh          # every analysis from the committed incident records (about 30 minutes, 2 cores)
./reproduce.sh full     # regenerate the records too
Seeds are fixed, so the numbers come out the same (wall-clock timings aside). The LLM proposals (from the Actions workflow, saved in results/llm_responses/) and Baran's corrections (results/baran/, needs raha) are scored from their saved outputs, so the archive alone is enough to reproduce every table.
Contributing
Contributions are welcome. Issues labelled good first issue are small and come with clear steps; see CONTRIBUTING.md to get started.
If DataRanger is useful to you, a ⭐ on the repo helps other people find it.
Citing
See CITATION.cff. Archived on Zenodo: 10.5281/zenodo.23787418.
License
MIT
Yorumlar (0)
Yorum birakmak icin giris yap.
Yorum birakSonuc bulunamadi