Cascade
Health Uyari
- License — License: Apache-2.0
- Description — Repository has a description
- Active repo — Last push 0 days ago
- Low visibility — Only 5 GitHub stars
Code Basarisiz
- Hardcoded secret — Potential hardcoded credential in adapters/sql/test_catalog_live_container.py
Permissions Gecti
- Permissions — No dangerous permissions requested
Bu listing icin henuz AI raporu yok.
Code-to-column change-impact knowledge graph for AI coding agents: the round trip from a screen to a database column and back, over MCP
English | 한국어
 Cascade
A code-to-column change-impact knowledge graph for AI coding agents, and for the
people who work beside them. Apache-2.0.
- A picture first
- What it answers
- Supported stacks
- Install
- Ten minutes on your own project
- Set it up for your AI agent
- The edit loop
- Several projects, one server
- Honesty, verify and doctor
- The viewer
- Profile and framework packs
- How it is measured
- Layout of the repository
- Contributing, security, conduct
- License
A picture first
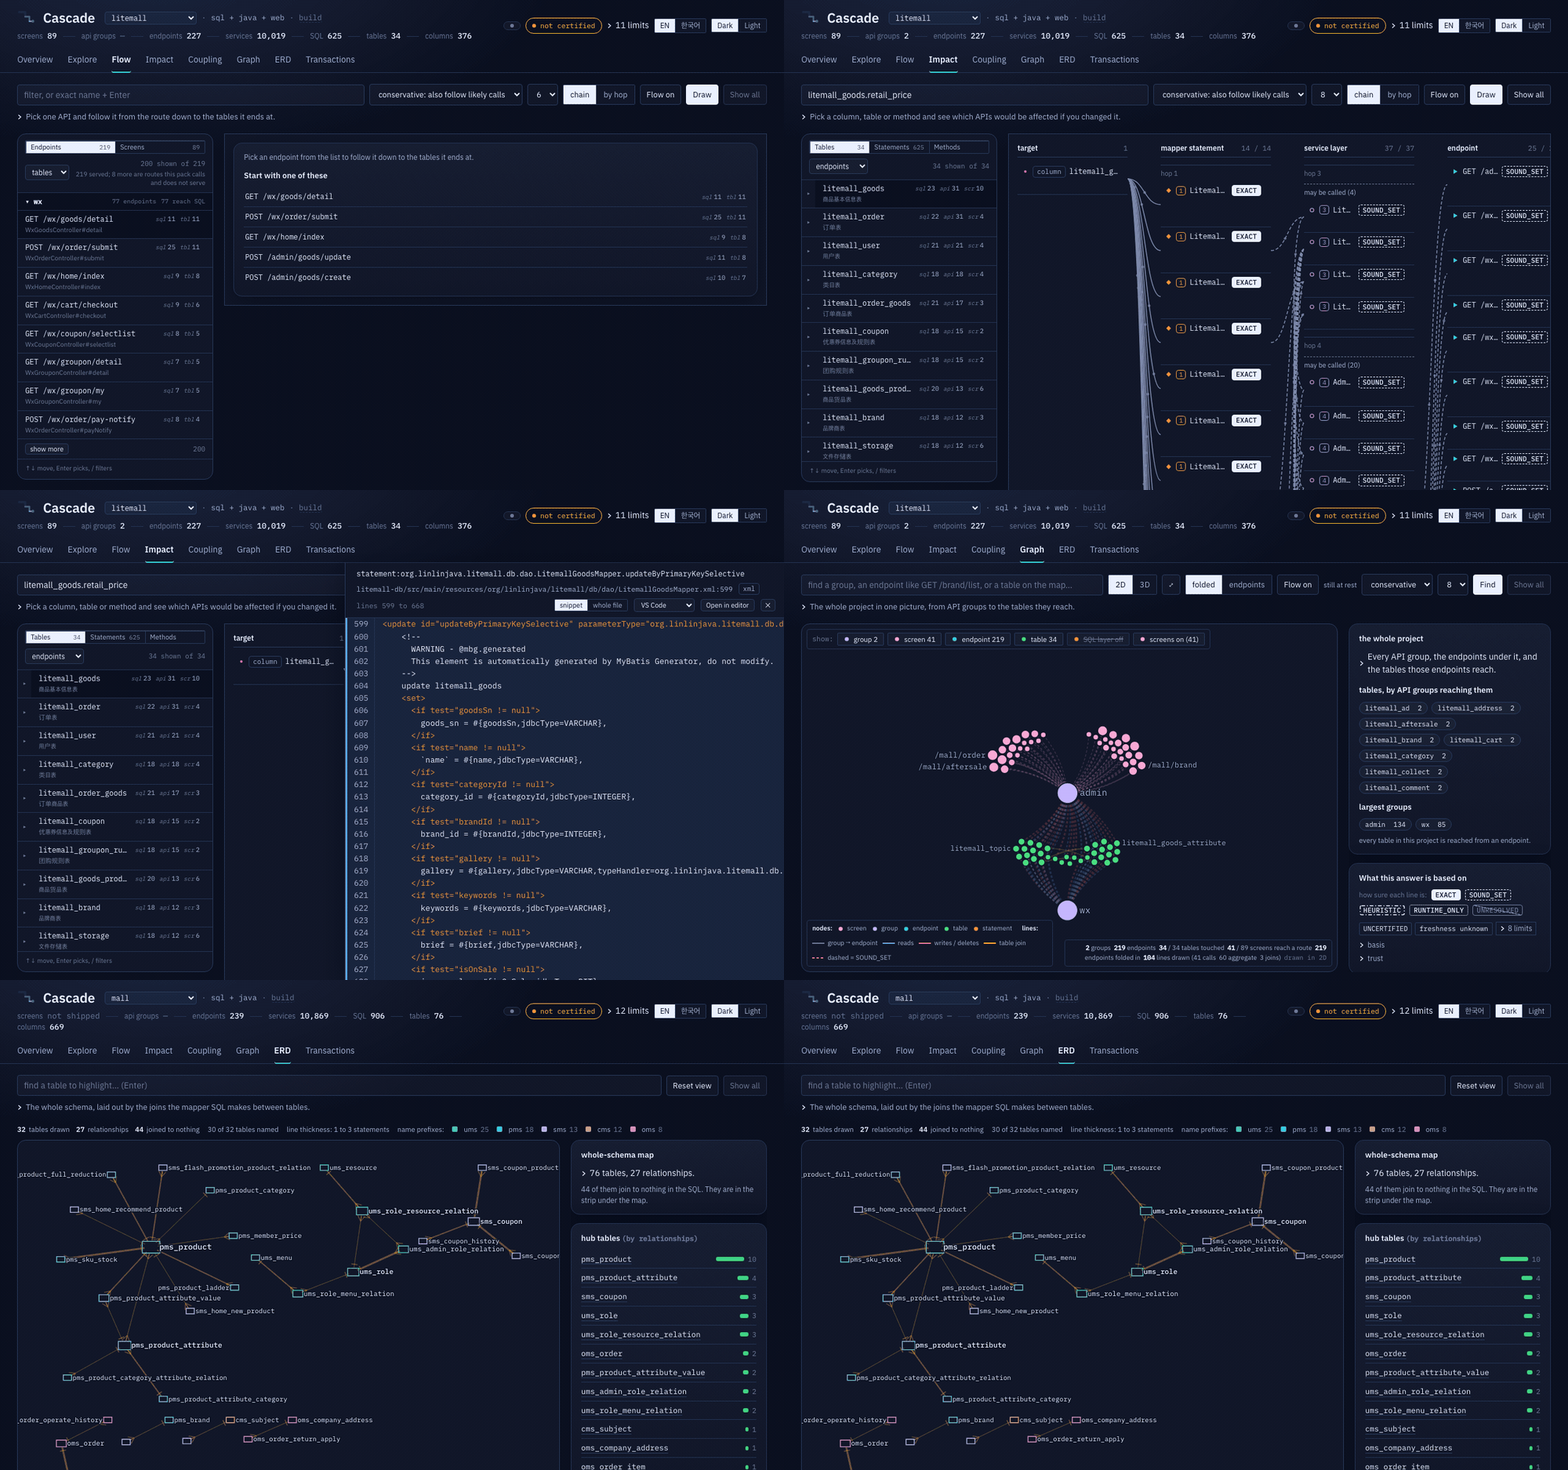
That is one column changed and the answer read in both directions, on two real
open-source projects. The still shots below walk the same views one at a time.
Cascade answers one question in both directions: if I change this database
column, which SQL statements, service methods, HTTP endpoints and user-facing
screens are affected, and if I open this screen, which column does it end at?
It answers over MCP so an AI coding agent can ask before it edits, and it draws
the same answers in a local viewer so a person can read them.
Every edge carries its own grade, so an answer tells you exactly how far to
trust it: what was proved, what is a sound candidate set, what is a hint. An AI
agent reads that grade and knows whether it can act on an answer or should check
it first, which is what makes an impact graph safe to hand to something that
edits code on its own. What a parser cannot see, Cascade leaves out and says so:
runtime wiring, reflection and AOP proxies are marked absent, never guessed.
That calibration is the product, not a caveat.
Where it fits
SAST and CodeQL look for vulnerabilities. Cascade looks for what a change
reaches, the round trip from a screen to a database column and back, with a
grade on every edge and no build to run. No SAST or dependency scanner answers
that round trip. Where the source does not settle a call, Cascade marks it
rather than inventing an edge, because an answer you can calibrate is one an
agent can act on, and that is the whole point.
What it answers
Six questions, and the tool that answers each. tools/list is the full
surface; these are the six worth learning first.
| Question | Tool |
|---|---|
| I am about to change this column. Which HTTP endpoints are affected? | endpoint_impact |
| Which screens does that column reach, through the frontend's own calls? | screen_impact |
| Which SQL statements read or write it, and which of those write? | column_impact |
| I am about to change this endpoint or open this screen. What does it run through, down to the tables? | flow |
| I have edited these files but not committed. What is the blast radius right now? | changed_impact |
| Which two API groups share data through the database without calling each other? | coupling |
Supported stacks
| Stack | What is read | Grade ceiling | What is not read |
|---|---|---|---|
| Java Spring MVC controllers | @RestController / @Controller mapping annotations, parsed with the JDK's own compiler in parse-only mode. No Gradle, no Maven, no dependency classpath |
EXACT for a mapping on a concrete controller method; SOUND_SET for a mapping on an interface the implementer serves |
a controller assembled at run time; a handler registered programmatically |
| MyBatis XML and annotations | <mapper namespace> files, <include refid> fragments resolved through a global index, and SQL written in @Select / @Insert / @Update / @Delete |
EXACT: a statement id is the mapper interface FQN plus the method |
a ${} substitution, which is recorded as a diagnostic rather than guessed at |
| MyBatis-Plus | @TableName, @TableField, @TableId, @TableLogic, the BaseMapper / IService / ServiceImpl built-ins, and condition wrappers down to the method references and literals they carry |
EXACT where the source names the table or column; HEURISTIC where a naming rule had to be assumed |
a wrapper whose conditions come from an HTTP query string: the table stays a fact, the columns are marked decided at run time |
| JPA and Spring Data | @Entity, @Table, @Column, @Id, @JoinColumn, @JoinTable, @MappedSuperclass, derived query method names, JPQL @Query, native @Query through the SQL analyzer, and the repository built-ins a caller reached |
EXACT where the mapping spells the name out or jpa.namingStrategy is declared; HEURISTIC where the strategy was assumed |
@Embedded, @SecondaryTable, @Inheritance, @AttributeOverride, @Convert, @ElementCollection, named queries |
| SQL DDL catalogs | CREATE TABLE and ALTER TABLE with types, nullability, primary keys and comments, per dialect: MySQL and MariaDB, PostgreSQL, Oracle, and H2 and HSQLDB through the ANSI parser. Each dialect brings its own identifier-case rule |
EXACT |
a dialect this engine cannot route, which is refused rather than parsed as MySQL |
| Live catalog fetch | one read-only connection that reads tables, columns, comments and primary keys and writes a pinned snapshot | EXACT |
anything but metadata: no table data is ever selected, and analysis itself never connects |
| Frontends | .js, .mjs, .cjs, .jsx, .ts, .tsx and the <script> blocks of .vue single-file components; axios and fetch and XMLHttpRequest and the project's own wrappers traced to whichever of them sends the request; vue-router and react-router declarations composed into screens; OpenAPI 3 and Swagger 2 documents as declared routes; HAR recordings as runtime evidence |
SOUND_SET for a call traced to a client that sends it; EXACT for a RENDERS edge onto the file a route declares |
which of an imported component's functions really runs, which is a run-time question and stays SOUND_SET |
Not supported, and the engine says so rather than guessing. Kotlin sources.
Any backend this engine has no lane for, unless it publishes an OpenAPI
document, in which case the routes exist and nothing below them is walked.
Angular and Svelte routers. Runtime wiring, reflection and AOP proxies.
GraphQL. WebSocket. A menu the server sends the frontend when the app starts,
beyond the routes the source itself declares.
Install
npm install -g @alexsoft-hq/cascade     # the command is `cascade`
cascade doctor                          # says what else, if anything, is missing
Or run it without installing anything: npx @alexsoft-hq/cascade doctor. From a
clone of this repository the same commands are node bin/cascade.mjs …, and the
rest of this page is written that way so it works before you have installed
anything.
Node 20 or newer for the engine itself, and nothing else. The engine and its
servers have no npm dependencies of their own, so nothing is fetched beyond the
package.
A JDK 17 or newer for the Java lane. The lane uses the JDK's own compiler
Tree API in parse-only mode, so javac and java are all it wants:
brew install openjdk                          # macOS
export JAVA_HOME=/opt/homebrew/opt/openjdk
sudo apt-get install default-jdk              # Debian or Ubuntu
Python 3 for the SQL lane, and one command to wire it up. The sqlglot
version is pinned in the requirements file rather than chosen at install time,
because a different one parses some statements differently and would move the
pack digest, so let the tool install the pinned set:
node bin/cascade.mjs setup
It finds a python3, builds the virtual environment where a run looks for one,
installs the pinned requirements, and proves it by importing sqlglot with the
interpreter a run will actually use. If you already have an interpreter withsqlglot in it, point CASCADE_PYTHON at it and skip the command.
Nothing at all for the web lane. Its parser is vendored underadapters/web/vendor/, so reading a frontend needs no install and makes no
network call.
Then let the tool tell you what is missing:
node bin/cascade.mjs doctor
ok      node >= 20                                      v24.20.0
ok      git                                             git version 2.50.1 (Apple Git-155)
ok      python venv (SQL lane)                          .venv/bin/python: Python 3.9.6
ok      sqlglot importable (SQL lane)                   sqlglot 30.17.0
ok      JDK 17+ (java lane)                             javac 26.0.2.1 via homebrew keg (arm64)
ok      web lane parser (vendored)                      adapters/web/vendor/babel-parser.cjs loads and parses
missing mysql driver (optional, catalog fetch)          ModuleNotFoundError: No module named 'pymysql'
                                                        -> .venv/bin/pip install pymysql. This is only needed for `cascade catalog fetch` against mysql
missing postgres driver (optional, catalog fetch)       ModuleNotFoundError: No module named 'psycopg'
                                                        -> .venv/bin/pip install psycopg[binary]. This is only needed for `cascade catalog fetch` against postgres
missing oracle driver (optional, catalog fetch)         ModuleNotFoundError: No module named 'oracledb'
                                                        -> .venv/bin/pip install oracledb. This is only needed for `cascade catalog fetch` against oracle
ok      docker (optional, live-catalog container test)  server 29.7.2
ok      project registry readable                       ~/.cascade/registry.json: 12 project(s)
ok      cache directory writable                        ~/.cache/cascade/doctor-probe

all 7 required prerequisite(s) ok (9 ok, 0 warn, 3 missing)
One editorial note that holds for every output excerpt on this page: an absolute
path the engine printed is written here as the relative or ~-prefixed path you
would type. Nothing else in any excerpt is edited.
doctor exits 0 only when every required prerequisite is ok. The optional
lines, the three database drivers and Docker, are reported and never fatal: the
analysis path never connects to a database, so a missing driver costs youcascade catalog fetch and nothing else.
Ten minutes on your own project
The run below is the one that produced every number on this page. It reads
macrozheng/mall (Apache-2.0, Spring Boot
with MyBatis XML mappers and a MySQL dump in the repository) at commit0504e86b, together with its Vue admin frontend
macrozheng/mall-admin-web at81fc17e5. Point the same commands at your own tree instead.
git clone https://github.com/macrozheng/mall ../target-examples/mall
git clone https://github.com/macrozheng/mall-admin-web ../target-examples/mall-admin-web
1. init: what is in this tree
node bin/cascade.mjs init --root ../target-examples/mall --project mall
project mall at ../target-examples/mall
repositories (1): .@0504e86b
files scanned 717: 524 java (48 spring handlers, 0 JPA entities), 104 mybatis mapper xml, 1 DDL, 0 kotlin, 0 frontend package.json
build tool maven; package prefixes [com.macro.mall]; lanes [sql,java]
wrote ../target-examples/mall/.cascade/manifest.json
wrote ../target-examples/mall/.cascade/profile.json
registered mall -> ../target-examples/mall/.cascade in ~/.cascade/registry.json
diagnostics: none
It writes three things and nothing else: manifest.json (each repository pinned
to a full commit), profile.json (the reading convention, which you may edit),
and a .cascade/.gitignore that ignores pack/ and catalog/ because those
carry your SQL text and your column comments. It also adds one line to the home
registry, so later commands can say --project mall instead of a path.
A technology the engine has no lane for comes back as anUNSUPPORTED_TECHNOLOGY diagnostic rather than being quietly skipped. A second
run keeps your edits unless you pass --force, and --json prints the whole
discovery report.
2. analyze: the lanes, and one content-addressed pack
With no lane flag the inputs come from the project itself: the DDL from the
profile, the mapper directories and Java source roots from discovery. The run
prints which lane got what, and from where.
node bin/cascade.mjs analyze --root ../target-examples/mall
lanes [sql,java]: ddl 1 file(s) (profile): ../target-examples/mall/document/sql/mall.sql; mappers 4 dir(s) (discovery); java-src 7 root(s) (discovery; 4 test root(s) excluded (the standard src/test layout; pass --java-src to include): mall-admin/src/test, mall-demo/src/test/java, mall-portal/src/test/java, mall-search/src/test/java); web none; openapi none; har none
SQL lane: lineage (dialect mysql, identifiers fold-lower) over 904 statement(s)…
Java lane: 246 endpoints, 9876 calls, 251 dispatch, 904 stmt-bindings (358 unresolved, 439 external, 0 mapper method(s) with no statement in this pack)
wrote ../target-examples/mall/.cascade/pack/pack.json: 12674 nodes, 19269 edges, lanes [sql,java], digest 99141d55e969
axes: catalog=shipped statements=shipped jpa=not-shipped mybatisPlus=not-shipped column=shipped code=shipped web=not-shipped screen=not-shipped
cold (no previous facts-index.json beside the pack, so there is nothing to reuse): parsed 519 java file(s), 904 lineage shard(s) over 906 statement(s), pack digest 99141d55e969
The lane line is the one to read. It names every input, where it came from,
and what was left out: here, the four src/test roots an unflagged run does not
read. The axes line under it is the pack's own declaration of what it can
answer, per axis, before anybody asks a question.
mall's frontend lives in a repository of its own, so one flag adds it:
node bin/cascade.mjs analyze --root ../target-examples/mall \
  --web-src ../target-examples/mall-admin-web/src
Web lane: 128 file(s) (83 .vue, 45 .ts/.tsx, 0 .js/.jsx), 0 parse error(s); 155 call site(s) carry a URL (89 literal, 59 template, 2 constant, 5 unresolved), 54 route declaration(s), 1 alias(es), 0 proxy rule(s)
Web lane: 153 call site(s), 145 resolved (145 sound, 0 heuristic), 8 unresolved (expression 4, noMatch 3, parameter 1), 3 outside-pack; prefix ../mall-admin-web: (none) (derived)
Web lane: 54 screen(s) from 54 route declaration(s), 54 with a component (0 unresolved), 121 exact and 64 candidate RENDERS edge(s); 301 frontend function node(s) (148 send a request, 153 lead to one), 174 CALLS edge(s) (174 exact, 0 sound, 0 heuristic; 0 of them a function handed over as a value)
wrote ../target-examples/mall/.cascade/pack/pack.json: 13032 nodes, 19797 edges, lanes [sql,java,web], digest 7994e1a5fd22
axes: catalog=shipped statements=shipped jpa=not-shipped mybatisPlus=not-shipped column=shipped code=shipped web=shipped screen=shipped
Adding a lane widened the pack, and the calibration gate stopped the run the
first time because a ratio moved: see
Honesty, verify and doctor below for the exact
refusal and the one override.
A second analyze reuses what did not change. On this tree, with nothing
edited:
incremental: reparsed 0 java files (519 reused, 0 dropped), reparsed 0 web file(s) (127 reused, 0 dropped), lineage recomputed 0 statements (904 reused), mapper statements reused, catalog reused, pack digest 7994e1a5fd22
The digest is the same as the cold run's, which is the point: an incremental
pack must equal a cold pack of the same state byte for byte, and a test holds
that against randomly mutated projects.
3. estimate: what it will answer, and what it will not
node bin/cascade.mjs estimate --root ../target-examples/mall
MEASURED. What the pack that exists actually answers:
  pack 7994e1a5fd22 built 2026-09-06T19:32:15.901Z lanes [sql,java,web]
  statementsWithColumnFacts       753 / 906    83.1%
  statementsWithStringSubst       396 / 906    43.7%
  endpointsReachingAStatement     205 / 242    84.7%
  webCallsResolved                145 / 153    94.8%
  mapperMethodsBound              904 / 904    100.0%
  callsResolved                  9437 / 10234  92.2%
  exactAnswerable                 509 / 906    56.2%
Run it before you analyze and it answers from discovery alone: what this
tree will ship, degrade or not ship, axis by axis, with the reason on each line.
Run it after and it adds the measured half above.
4. view: look at it yourself
node bin/cascade.mjs view --project mall
cascade viewer at http://127.0.0.1:4319/ serving 1 project(s) [mall], budget 512 MB of pack JSON
The page is described under The viewer.
5. mcp: serve it to an agent
node bin/cascade.mjs mcp --project mall
cascade mcp: serving 1 project(s) [mall]: packs load on first use, budget 512 MB of pack JSON
That is a normal MCP server speaking JSON-RPC over stdio: initialize, thentools/list, then tools/call. The next section wires it into a client.
Set it up for your AI agent
cascade agent --write                     # Claude Code: .mcp.json + CLAUDE.md
cascade agent --client cursor --write     # Cursor: .cursor/mcp.json + a rule file
Run it in the project. It writes two things: the MCP server configuration, with
the absolute path and the project id filled in from the registry, and a short
block that tells the agent when to ask (before it edits a mapper, an entity,
a controller or a screen), which tool to ask with, and how to read the trust,limits and grade fields that come back. That block is the half people forget,
and it is the half the value sits on: a server with no rule attached is a server
the model never calls, because nothing in its context says a question is due.
The block goes into CLAUDE.md (or AGENTS.md for Codex) between two markers,
so a second run replaces it in place and your own text around it survives.
Without --write the command prints every file it would write instead of
writing one. Claude Code then needs one approval: a server that arrives in a
project .mcp.json sits at Pending approval until you run claude there once
and approve cascade.
What the command writes, if you would rather do it by hand
Every configuration below runs the same command, node <path>/bin/cascade.mjs mcp --project <id>. Use an absolute path to bin/cascade.mjs: an MCP client
starts the server from a working directory you do not control.
Claude Code, from a shell:
claude mcp add cascade -- node /path/to/cascade/bin/cascade.mjs mcp --project mall
Claude Desktop, in claude_desktop_config.json:
{
  "mcpServers": {
    "cascade": {
      "command": "node",
      "args": ["/path/to/cascade/bin/cascade.mjs", "mcp", "--project", "mall"]
    }
  }
}
Drop --project mall and the server serves every project in your registry, and
each tool then takes a project argument. Name several instead and it serves
exactly those: "args": ["/path/to/cascade/bin/cascade.mjs", "mcp", "--project", "mall", "--project", "shop"].
Cursor and a generic stdio client take the same three fields.docs/setup/agents.md has each client in full, plus
what to check when a client reports the server as failed.
A worked session
An agent that has just been asked to add a discount field starts by asking what
the pack even is, then narrows. These are real answers from the run above,
abridged to the fields under discussion.
1. What is in here?
{"name": "overview", "arguments": {}}
{ "answer": {
    "pack": { "project": "mall", "digest": "7994e1a5fd22", "lanes": ["sql", "java", "web"] },
    "nodes": [ {"kind": "symbol", "count": 11085}, {"kind": "statement", "count": 906},
               {"kind": "column", "count": 669}, {"kind": "endpoint", "count": 242},
               {"kind": "table", "count": 76}, {"kind": "screen", "count": 54} ],
    "reach": { "endpoints": 239, "statementsReached": 208, "tablesReached": 49,
               "columnsReached": 461, "endpointsWithoutStatement": 34 } },
  "basis": { "project": "mall", "buildDigest": "7994e1a5fd22",
             "builtAt": "2026-09-06T19:32:15.901Z", "freshness": { "verdict": "unknown" } },
  "trust": { "trustLevel": "UNCERTIFIED", "axes": ["overview"],
             "knownGaps": ["no-project-golden", "jpa-axis-not-shipped", "mybatisPlus-axis-not-shipped"] },
  "limits": [ { "scope": "axis:jpa",
                "reason": "the jpa axis of this pack is not-shipped: the JPA bridge did not run, because there is no Java lane or the profile declares no jpa pack. Persistence declared by @Entity or Spring Data is absent, not empty" } ],
  "truncated": { "any": true, "fields": [ { "field": "nodes", "shown": 6, "total": 6, "nextOffset": null } ] } }
Read the four fields at the bottom before the answer at the top, because they
are what makes the answer usable.
basisis what the answer is anchored to: which project, which pack
digest, when it was built, and a freshness verdict ofcurrent,behind,provisional-overlayorunknown.unknownnever reads ascurrent.trustis a computed level, never a typed-in one.UNCERTIFIEDhere
means this project has no approved golden corpus, which is stated rather than
hidden.knownGapsnames each axis that is degraded or was never built.limitsis what the engine could not see, in sentences, each scoped. The
one above says the JPA axis is absent rather than empty, which is a different
claim from "this project uses no JPA".truncatedsays, per list, how many rows were shown out of how many
exist, in what order, and where to continue. A truncated list that called
itself complete is the failure this field exists to prevent.
There is a fifth thing to read, and it is the shape of an empty list. empty
answers not-shipped (the axis was never built), degraded (built without
something it needed) or none (looked, found nothing). Those are three
different answers and they never collapse into [].
2. Which statements touch the column?
{"name": "column_impact", "arguments": {"column": "pms_product.price"}}
{ "column": "pms_product.price", "type": "DECIMAL(10, 2)",
  "statements": [ { "id": "com.macro.mall.mapper.PmsProductMapper.insert", "access": "write", "grade": "EXACT" },
                  { "id": "com.macro.mall.mapper.PmsProductMapper.updateByExample", "access": "write", "grade": "EXACT" } ] }
18 statements: 8 write it, 10 read it, all EXACT. This axis is exact because a
MyBatis statement id is the mapper interface plus the method name, and the
column lineage comes from a real SQL parse against a real catalog.
3. Which endpoints does that reach?
{"name": "endpoint_impact", "arguments": {"column": "pms_product.price"}}
27 endpoints, 12 of them under /product/*, the rest spread over /home/*,/member/*, /brand/*, /esProduct/*, /cart/*, /productCategory/* and/flashProductRelation/*. Every row is SOUND_SET, not EXACT, and that is
the honest grade: a chain is graded by its weakest link, and a parse-only lane
resolving a call by name produces a candidate set the real target is guaranteed
to be inside, not a proof.
4. And which screens?
{"name": "screen_impact", "arguments": {"column": "pms_product.price"}}
{ "screen": "/pms/updateProduct", "grade": "SOUND_SET", "observed": false,
  "endpoints": ["GET /product/updateInfo/{id}", "POST /product/create",
                "POST /product/update/deleteStatus", "POST /product/update/{id}"] }
12 screens. observed says whether a browser recording confirmed the call, andfalse here means no recording was supplied, not that the call does not happen.
5. Then walk one screen down to the tables.
{"name": "flow", "arguments": {"screen": "/pms/product", "direction": "down"}}
The walk crosses six lanes and stops at the tables: 20 frontend functions, then
10 endpoints, 35 service methods, 7 mapper statements and 5 tables, out of 79
links followed, 38 of them EXACT and 41 SOUND_SET. walk.cut reports
whatever the depth cap or the mode floor stopped, so a short answer says why it
is short.
The edit loop
You have edited a file and not committed it. Ask what you may have touched:
node bin/cascade.mjs impact --project mall --verbose
overlay 4ed662d103d9 (fresh): re-parsed 1 java + 0 frontend file(s), dropped 0, provisional 2 node(s) / 2 edge(s)
timings ms: load-base 27 + java 133 + web 39 + sql 31 + graph 81 = 311
  reused 645 cached java shard(s); dirty documents: mall-admin/src/main/java/com/macro/mall/controller/PmsProductController.java@0478df64
changed files: 1  (matched 1, unmatched 0)
touched: 10 symbols, 0 statements, 11 endpoints

upstream endpoints affected (11):
  GET /product/list  [EXACT]
  GET /product/priceCheck/{id}  [EXACT]  PROVISIONAL (only in the overlay)
  GET /product/simpleList  [EXACT]
  ...

downstream columns affected (88):
  ...

(provisional-overlay) provisional overlay: the dirty files were RE-PARSED and this answer describes the bytes on disk. Rows marked provisional exist only in the overlay (no certified run has seen them); nothing here is published and the pack digest is unchanged.
The same question over MCP is changed_impact, and its answer carries the same
machinery in fields:
{ "overlay": { "applied": true, "state": "fresh",
    "overlaySessionId": "4ed662d103d9ef080bd477fe9e5cde08c2222ac135497970bc66c4747c38be06",
    "baseCommit": "0504e86b…", "headCommit": "0504e86b…",
    "docVersions": { "mall-admin/…/PmsProductController.java": "0478df64…" },
    "provisionalIds": { "symbols": ["symbol:com.macro.mall.controller.PmsProductController#priceCheck"],
                        "endpoints": ["endpoint:GET /product/priceCheck/{id}"], "statements": [] },
    "timingsMs": { "loadBase": 25, "java": 132, "web": 40, "sql": 26, "build": 78, "total": 301 } },
  "basis": { "freshness": { "verdict": "provisional-overlay", "overlaySessionId": "4ed662d103d9…" } } }
provisional is a marker, not a grade. It says this node or edge exists
only in the overlay and no certified run has ever seen it. The grade lattice is
untouched by it: the new endpoint above is EXACT because a mapping annotation
on a concrete controller method is its handler, and it is alsoPROVISIONAL because nothing certified has seen that method yet.
overlaySessionId is the sha256 identity of this particular overlay: the
base commit plus the sha256 of every dirty document. Two answers with the same
session id describe the same bytes on disk. Two with different ones do not, even
one second apart, and an agent that caches answers should key on it.
behind is what you get after you commit. The overlay is discarded rather
than laid onto a base that has moved:
overlay NOT applied (stale-commit): the pack was built at 0504e86b1f1b but HEAD is now 9477dd387ecc, so the overlay is discarded rather than laid onto a base that has moved
limit [overlay]: HEAD moved past the pack's base commit; the answer below is the BASE pack's, not the working tree's. Run `cascade analyze` (it is incremental) to certify the new commit
(behind) provisional: computed from the base pack (files as last analyzed). Edited regions may add or remove connections. Re-run `cascade analyze` for a certified result.
The one second rule. This loop is only useful if it fits inside the pause
between an edit and the next question, so the overlay has a one-second budget
and the run above spent 311 ms of it on a 519-file backend plus a 128-file
frontend. Nothing is written while it runs: not the pack, not the fact cache.
The overlay may over-approximate; it may not omit, and that is a test rather
than a promise, comparing it against a full re-analysis of the same bytes.
Several projects, one server
cascade init writes one line per project into ~/.cascade/registry.json, and
that file holds addresses only: {id, dotCascadePath, source, stack, lastCertifiedAt}. The analysis itself never leaves the project's own.cascade/.
With no flag, cascade mcp and cascade view serve every registered project:
node bin/cascade.mjs mcp                                 # every registered project
node bin/cascade.mjs mcp --project mall --project shop   # just these two
node bin/cascade.mjs mcp --pack .cascade/pack            # one pack directly
node bin/cascade.mjs mcp --memory-budget 256             # MB of pack JSON held
Packs are lazy. Starting the server reads the registry and nothing else:
{"name": "projects", "arguments": {}}
{ "answer": {
    "projects": [ { "id": "jpetstore", "stack": ["sql", "java"], "loaded": false, "bytes": null },
                  { "id": "mall", "stack": ["sql", "java", "web"], "loaded": false, "bytes": null } ],
    "cache": { "loaded": 0, "bytes": 0, "budgetBytes": 536870912, "evictions": 0, "hits": 0, "misses": 0 } },
  "basis": { "project": "*", "scope": "server", "buildDigest": null } }
Every other tool takes an optional project argument. One served project
answers without being named. Several, with no project, is refused:
error [ambiguous]: several projects are registered: jpetstore, mall. Pass "project"
There is no "pick the first one" fallback, because a confident answer about the
wrong project is exactly the failure this tool exists to prevent.
The cache budget. --memory-budget <MB> bounds the pack JSON held in
memory, 512 MB by default, and eviction is least-recently-used. That number is a
proxy rather than a heap measurement, because Node cannot price a live object
graph and measuring the real thing would mean loading the pack the budget is
meant to refuse. The ratio of resident graph to proxy that two independent tools
measured, and the two scripts that re-measure it on your own pack, are indocs/mcp.md. A pack
that does not fit the budget alone is refused outright, naming both numbers,
rather than half-loaded.
The viewer's header carries a project selector for the same set, and the choice
rides in the URL hash.
Honesty, verify and doctor
The grade lattice
Every edge carries one of five grades, and nothing ever moves up the
lattice.
| Grade | What it means | Example |
|---|---|---|
EXACT |
proved unique by syntax, symbols and constants | a MyBatis statement id, which is the mapper interface plus the method |
SOUND_SET |
a conservative candidate set the real target is guaranteed to be inside | the implementations behind an interface dispatch |
HEURISTIC |
plausible from a project convention, or a recovered or partial binding | a column name derived from a field name with no declared naming strategy |
RUNTIME_ONLY |
not statically decidable, and needs runtime evidence | a request seen in a browser recording |
UNRESOLVED |
the analysis failed, or the shape is unsupported | a URL that resolved to a route nothing here serves |
A candidate set of one is never promoted to EXACT. Narrowing is not
proving. The lattice is computed in one file, src/core/policy.mjs, and the
workers emit evidence rather than grades. A walk is graded by its weakest
link, so one SOUND_SET hop makes the whole chain SOUND_SET. Query modes
pick a floor: strict uses confirmed edges only, conservative adds candidate
calls, heuristic also admits guessed rules, and RUNTIME_ONLY sits below all
three, which is why a recorded call is shown and never walked.
The four fields every answer carries
basis, trust, limits and truncated, described in the worked session
above. They are stamped with a private Symbol in the one file allowed to build
a response, so an object that merely has the right shape is refused before it is
serialised. Over HTTP that refusal is a 500 contract-violation, never a 200.
The long version is in docs/concepts.md.
verify
node bin/cascade.mjs verify --project mall
verified ../target-examples/mall/.cascade: 7 check(s) agreed: pack, fact index and gate state match the receipt, the running engine is the one that signed it, and it is valid until 2026-10-06T19:32:05.381Z
gate NO_CHANGE -> GREEN
It recomputes every digest in the receipt from the files on disk, checks the
running engine against the one that signed the receipt, and refuses an expired
receipt. Exit 4 on any disagreement, never a partial pass.
doctor
Shown under Install. It exists so that a missing prerequisite is one
report rather than five failures discovered one command at a time.
Calibration: every run judged against the last certified one
Each project keeps a sealed baseline in .cascade/calibration/, and everyanalyze is compared against it. The gate first asks why this run differs:NO_SEAL (no baseline yet, so this run becomes it), NO_CHANGE (same engine,
same pins), ENGINE_MOVED (an engine upgrade), REPIN (the analyzed commits
moved), or BOTH_MOVED.
Here is the gate refusing a real run: the same tree, the same engine, with the
web lane added.
gate: NO_CHANGE -> RED - endpointsReachingAStatement dropped 1.28% (>0%)
  [error] endpointsReachingAStatement: same engine and same pin, but endpointsReachingAStatement moved from 85.8% (205/239) to 84.7% (205/242). Identical inputs must produce identical measurements
  [error] node:endpoint: same engine and same pin, but node:endpoint moved from 239 to 242
REJECTED: the pack was written to ../target-examples/mall/.cascade/pack-rejected/pack.json and the certified pack at ../target-examples/mall/.cascade/pack/pack.json was NOT touched
  a regression is not a new snapshot: fix it. If this drop is the intended new normal, re-run with `--accept-baseline`,
  which re-seals the baseline from THIS run. That is the only override, and it is a human decision.
Read that carefully, because it is the gate working rather than misfiring. The
numerator did not move: 205 endpoints still reach a statement. The denominator
grew from 239 to 242, because the web lane found three routes the frontend calls
that nothing here serves. The ratio therefore fell while nothing got worse. The
gate is comparative, not absolute, so it reports the finding and leaves the
judgement to a person:
node bin/cascade.mjs analyze --root <repo> --web-src <front/src> --accept-baseline
That re-seals the baseline from that run, so tomorrow's comparison is
against today. It is the only override there is. A RED run is never silently
discarded: its pack goes to <packDir>-rejected/, the certified pack is left
exactly where it was, and the command exits 3.
Alongside the gate, cascade golden keeps the project's own labelled corpus.
The tool proposes cases and a human approves them, a hash decides which
are held out, and check scores the approved ones through the shipped MCP
tools. The tool never approves itself, which is why the trust level on every
answer can mean something.
A missing axis is declared, not fatal
Every lane input is optional, and every lane can be switched off by name:--no-ddl, --no-mappers, --no-java, --no-web, --no-openapi. The run
still produces a valid pack, and the pack records meta.axes per axis. Here is
mall with no database catalog:
node bin/cascade.mjs analyze --root ../target-examples/mall --no-ddl \
  --out ../mall-no-ddl-pack
{"code":"summary","columnFacts":1248,"defaultSchema":null,"diagnostics":2,"dialect":"mysql","identifierCase":"fold-lower","identifierCollisions":0,"joinFacts":0,"level":"info","statements":904,"tableFacts":948,"unresolvedColumns":5135,"unresolvedJoins":46,"unresolvedRate":0.8045,"version":"lineage/2"}
wrote ../mall-no-ddl-pack/pack.json: 12598 nodes, 13479 edges, lanes [sql,java], digest f0ba9c2b4d78
axes: catalog=not-shipped statements=shipped jpa=not-shipped mybatisPlus=not-shipped column=degraded code=shipped web=not-shipped screen=not-shipped
Column facts fall from 6342 to 1248 and unresolved column references rise from
396 to 5135. Nothing is dropped to make the answer look clean: what cannot be
attributed without a catalog is recorded as unresolved, the column axis
declares itself degraded, that declaration lands in trust.knownGaps on every
answer, and an empty list then says degraded rather than none.
The viewer
cascade view starts one local web app over the same tool catalog the MCP
server uses. The page never reimplements a query: every number on it arrives in
a contract-valid answer from the engine, so the page and a model asking over MCP
can never be told different things. It binds 127.0.0.1 and authenticates
nothing, because it is not meant to be reachable from anywhere else.
The masthead carries the dateline (which project answered, its digest, which
lanes ran, the commit it was built from), the chain with a count on each step,
three chips for freshness, trust and the limit count, a project selector, a
language toggle and a theme toggle. Two themes sit on one set of tokens: dark
is the signal room and the default, light is the engineering drawing that
still reads when printed in greyscale.
Overview
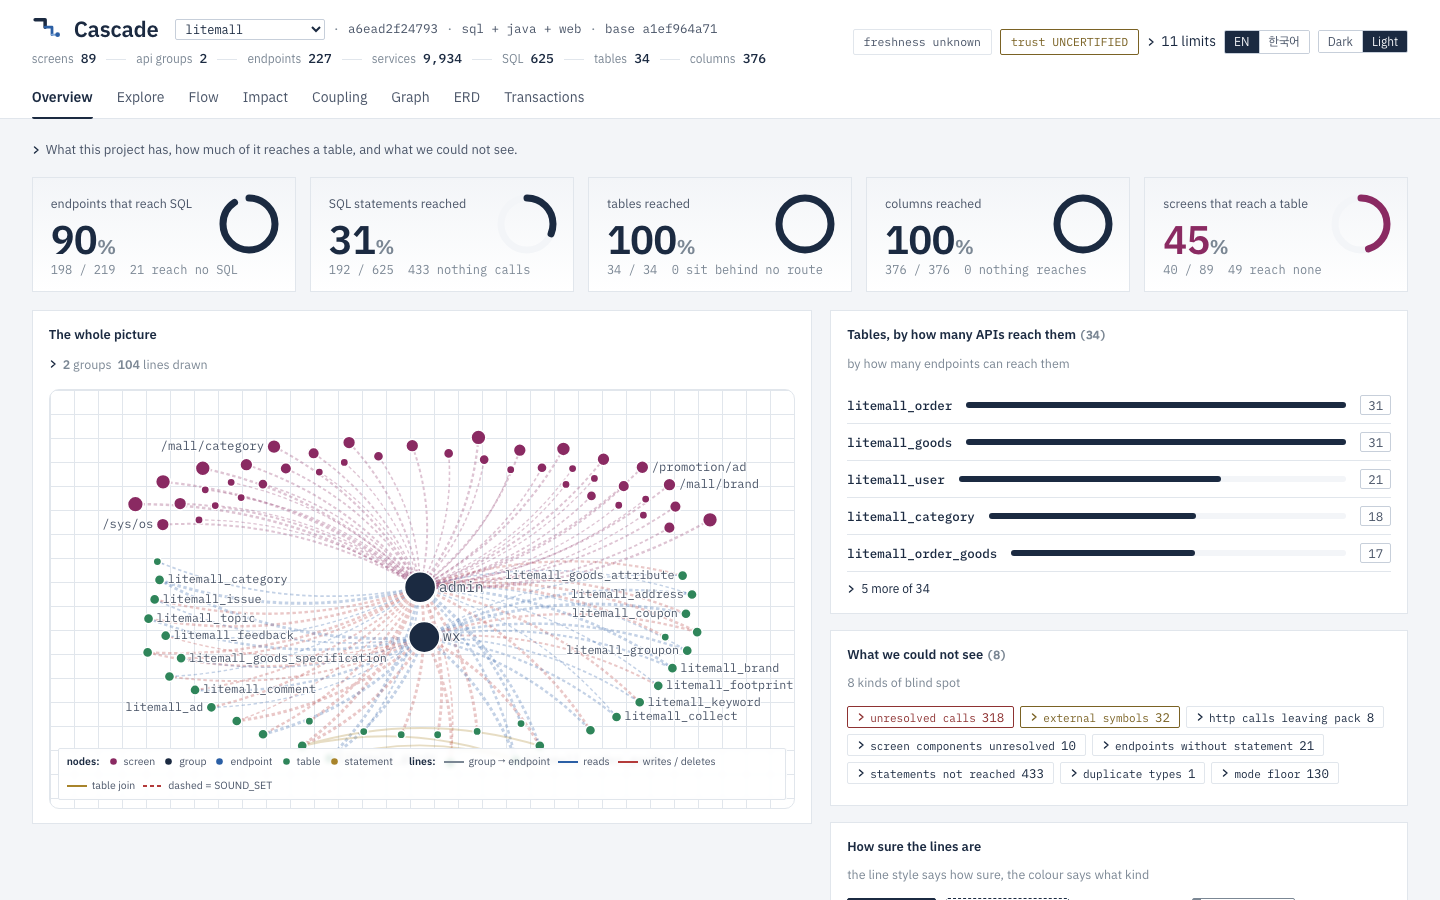
Five dials across the top, from the overview answer's own reach field: how
many endpoints reach SQL, how many statements, tables and columns are reached,
and how many screens reach a table. Under each number is what it leaves out, in
that step's own terms, because a share only means something beside its
remainder. Beside them is the live whole-project map, asked once and shared with
the Graph tab. Below that: the cascade ribbon, what is in the pack, edges by
type and grade, the hub tables and endpoints, and a panel of what the engine
could not see.
Explore
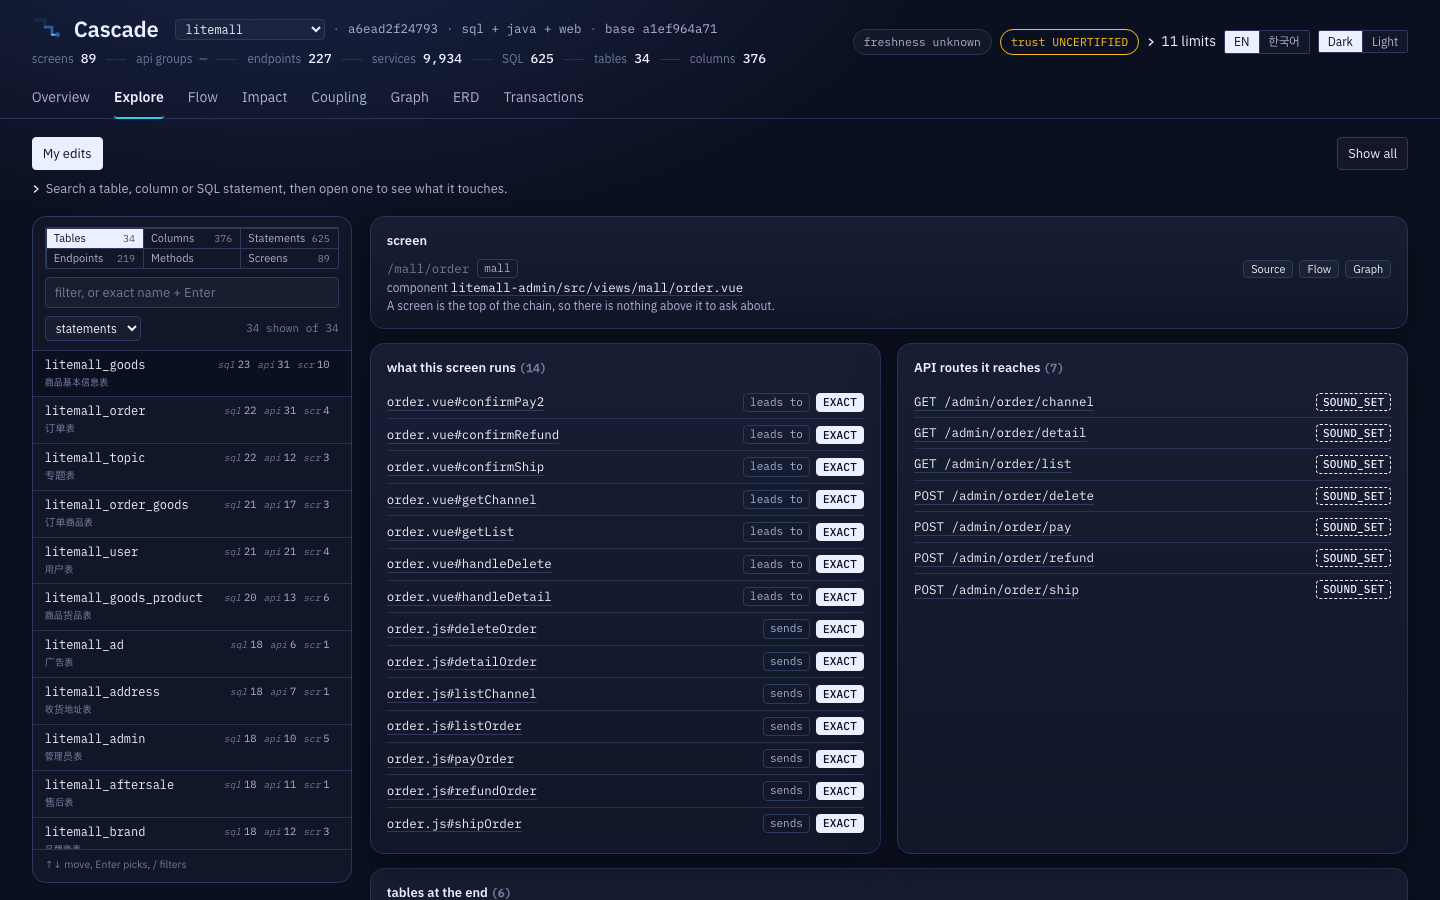
Pick a table, column, statement, endpoint, method or screen and see what it
touches. The card above is a screen: the .vue file the route declares, the
functions on it, each marked leads to or sends, and the routes they reach
with the grade on each. My edits asks the same question about your
uncommitted changes.
Flow
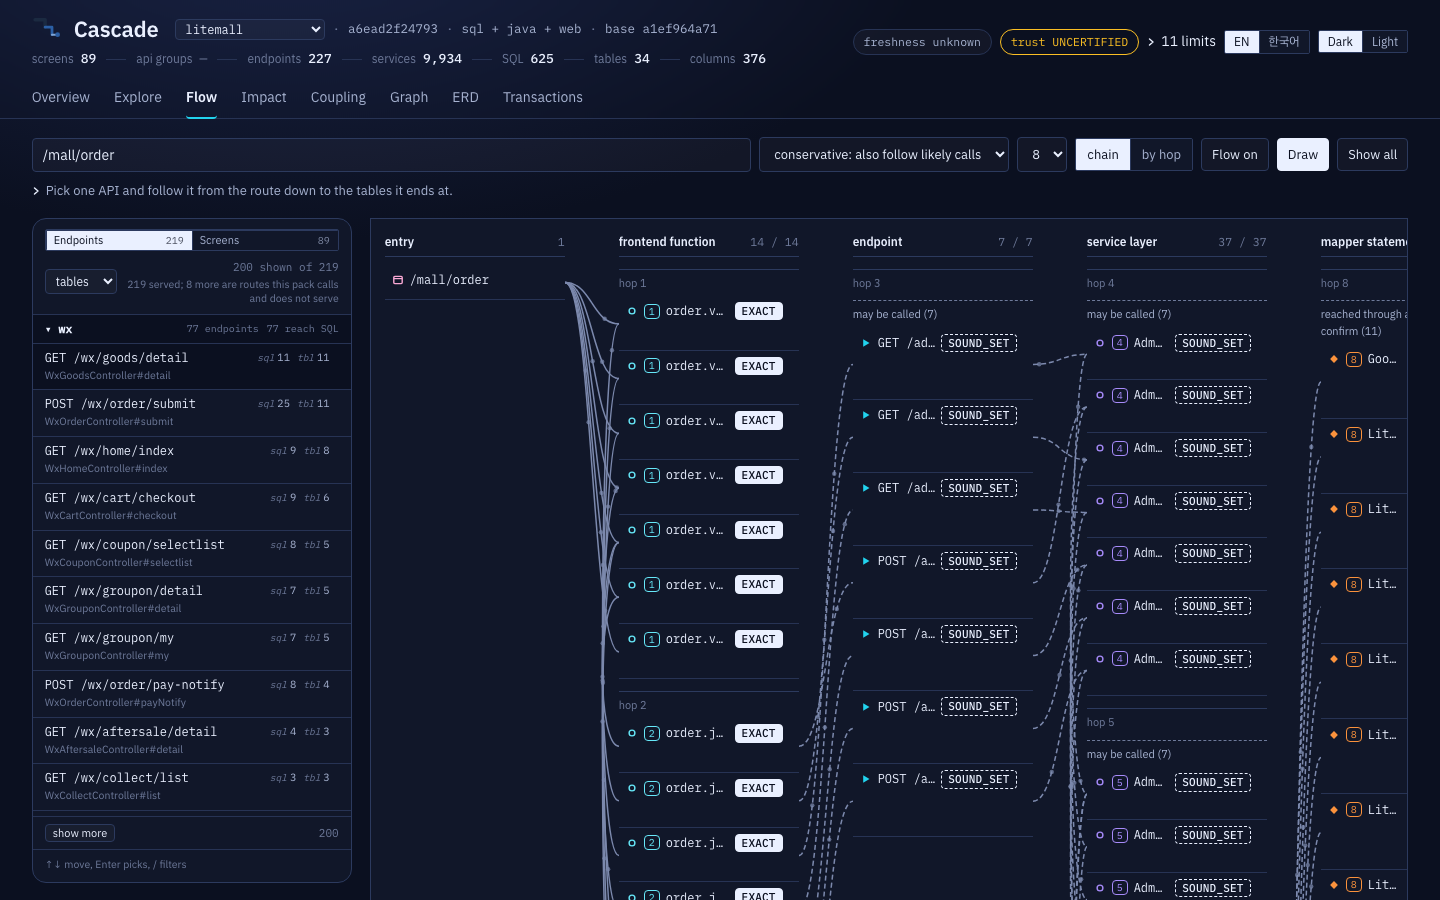
One call read left to right: the entry, the frontend functions, the endpoint,
the service methods it may run through, the mapper statements those reach, and
the tables at the end. A solid connector is a call the engine can prove, a
dashed one a call it thinks happens but could not confirm. by hop groups the
same rows one step at a time with a census per hop.
Impact
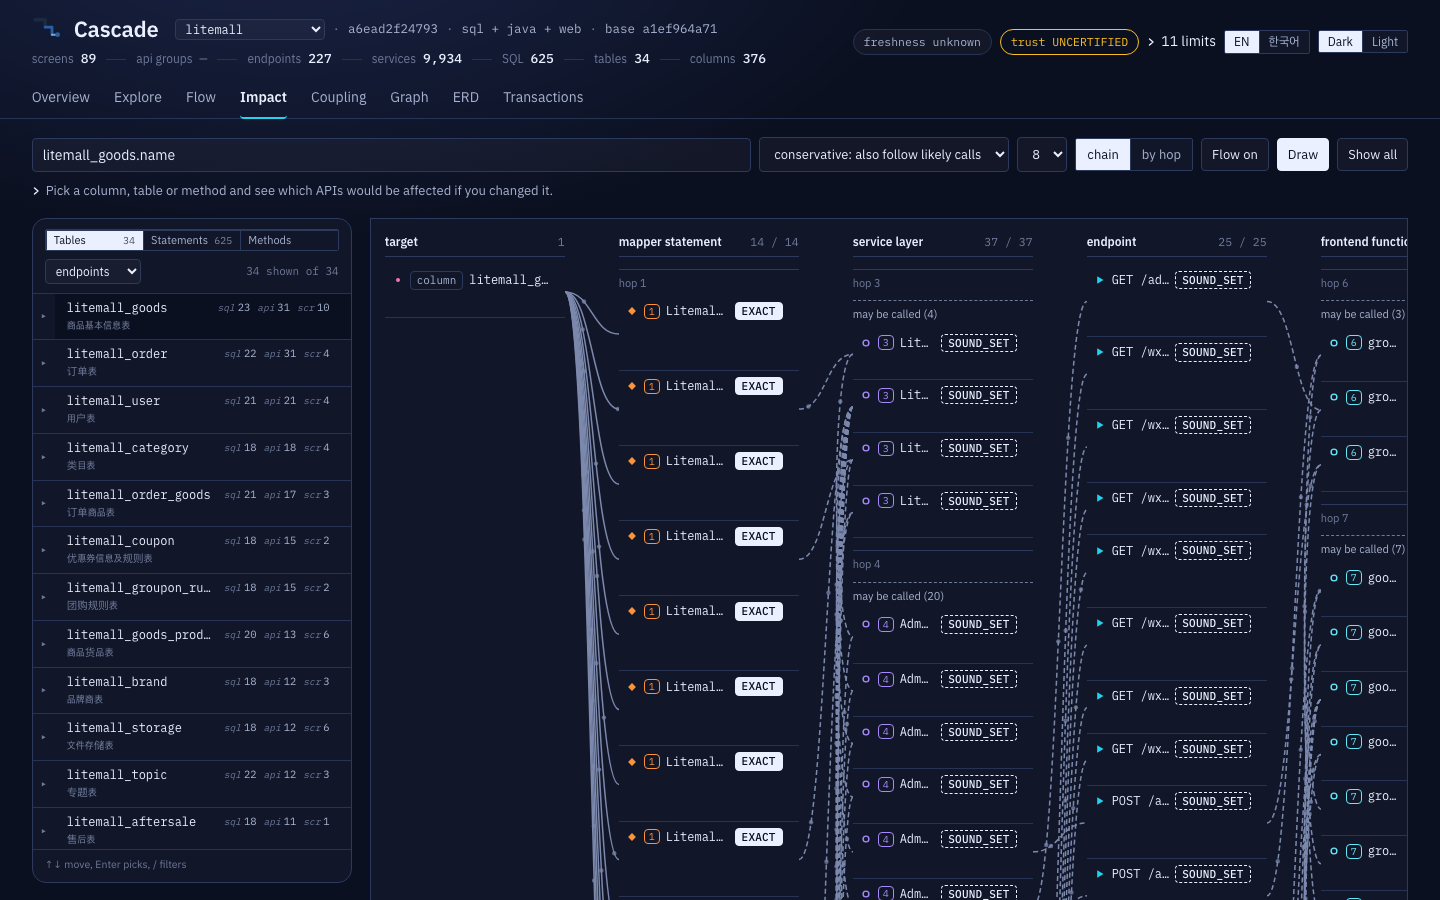
The same machinery run backwards from a column, table, statement or method, up
to the endpoints and screens that can reach it. The rail on the left gives every
table a caret that opens it into its own columns, so you can walk from a table
down to the column you are about to change.
Coupling
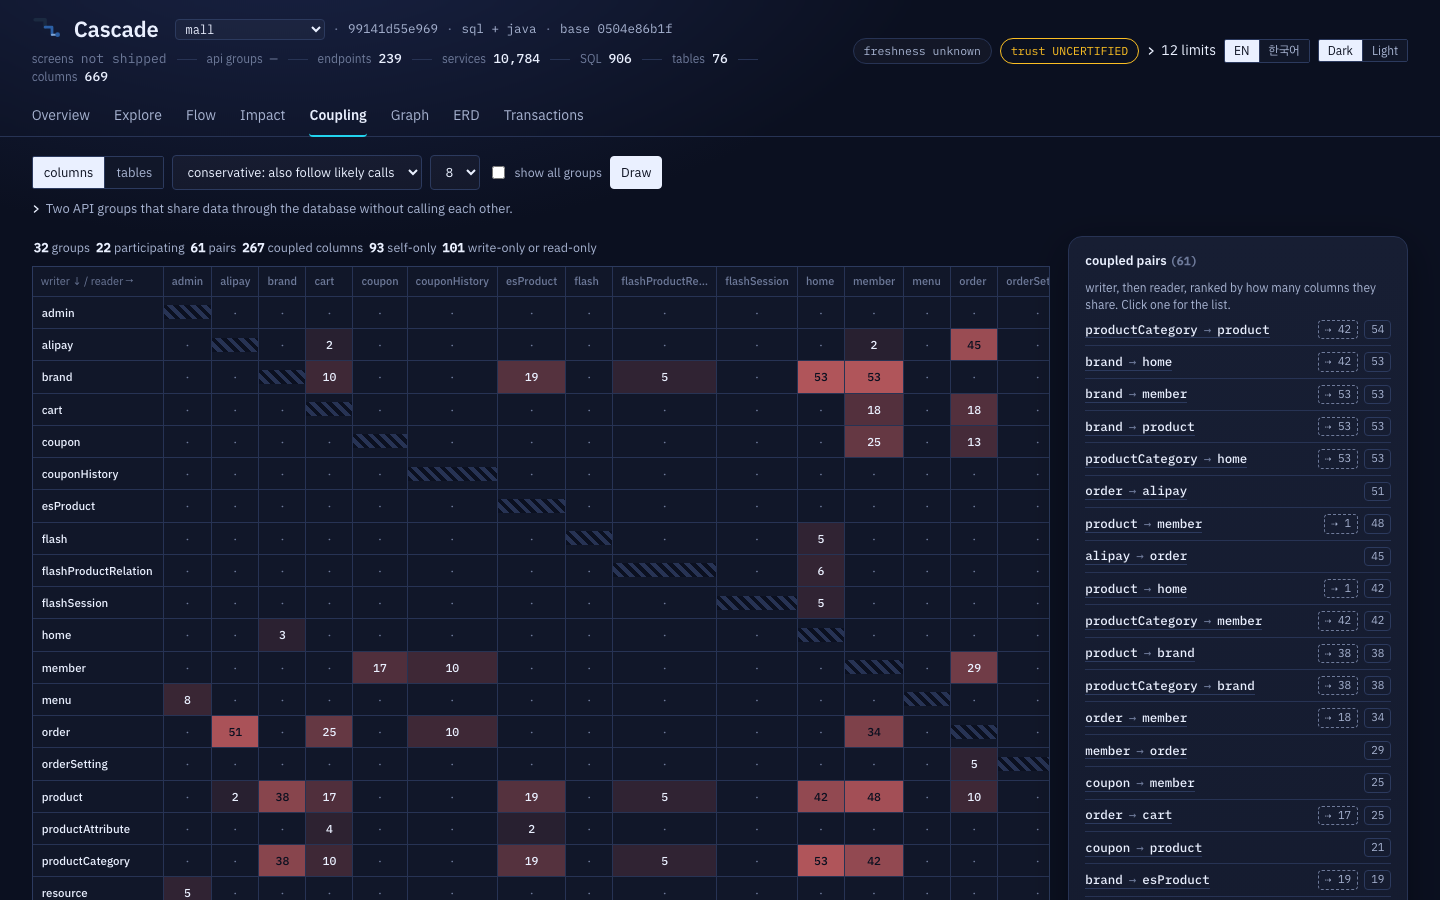
Two API groups can depend on each other without ever calling each other: one
writes a column, the other reads it. The matrix shows those pairs, writer down
the side and reader across the top. On mall that is 61 pairs across 32 groups,
267 coupled columns, and 93 columns only one group touches. Click a cell for the
columns the two share and the statements that carry them.
Graph
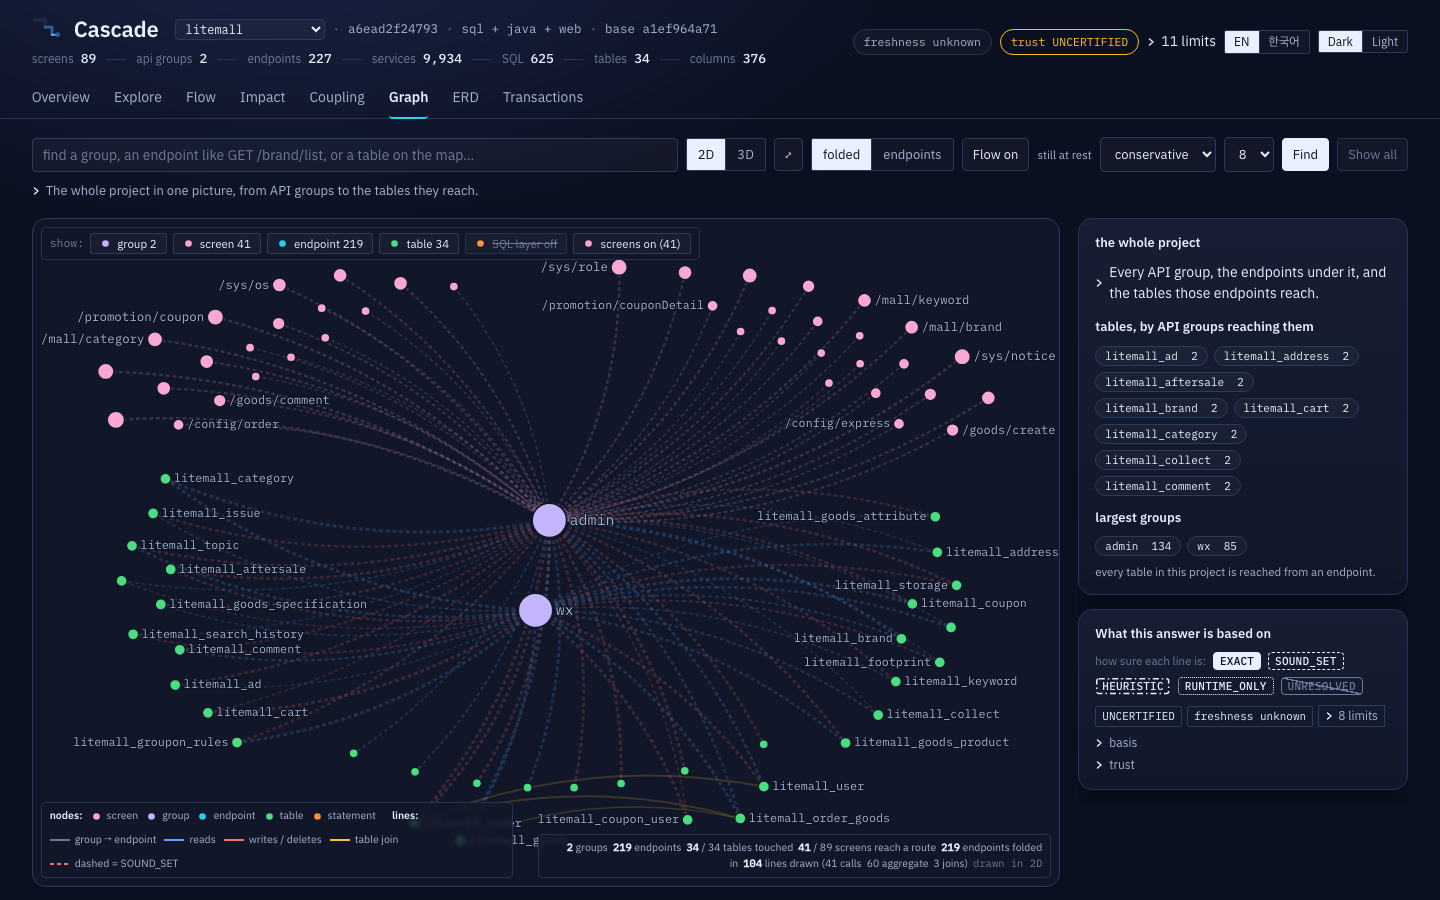
The whole pack as one picture. At rest it draws API groups and tables only, with
each group-to-table line standing for every endpoint in that group that touches
the table; click a group and its endpoints unfold as satellites. A node's radius
follows the square root of its degree, line colour is what the endpoint does to
the table, and thickness is how many statements carry it. The map does not move
at rest. Double-click a node for Around <node>: that node in the middle,
what touches it on ring 1, what touches those on ring 2.
ERD
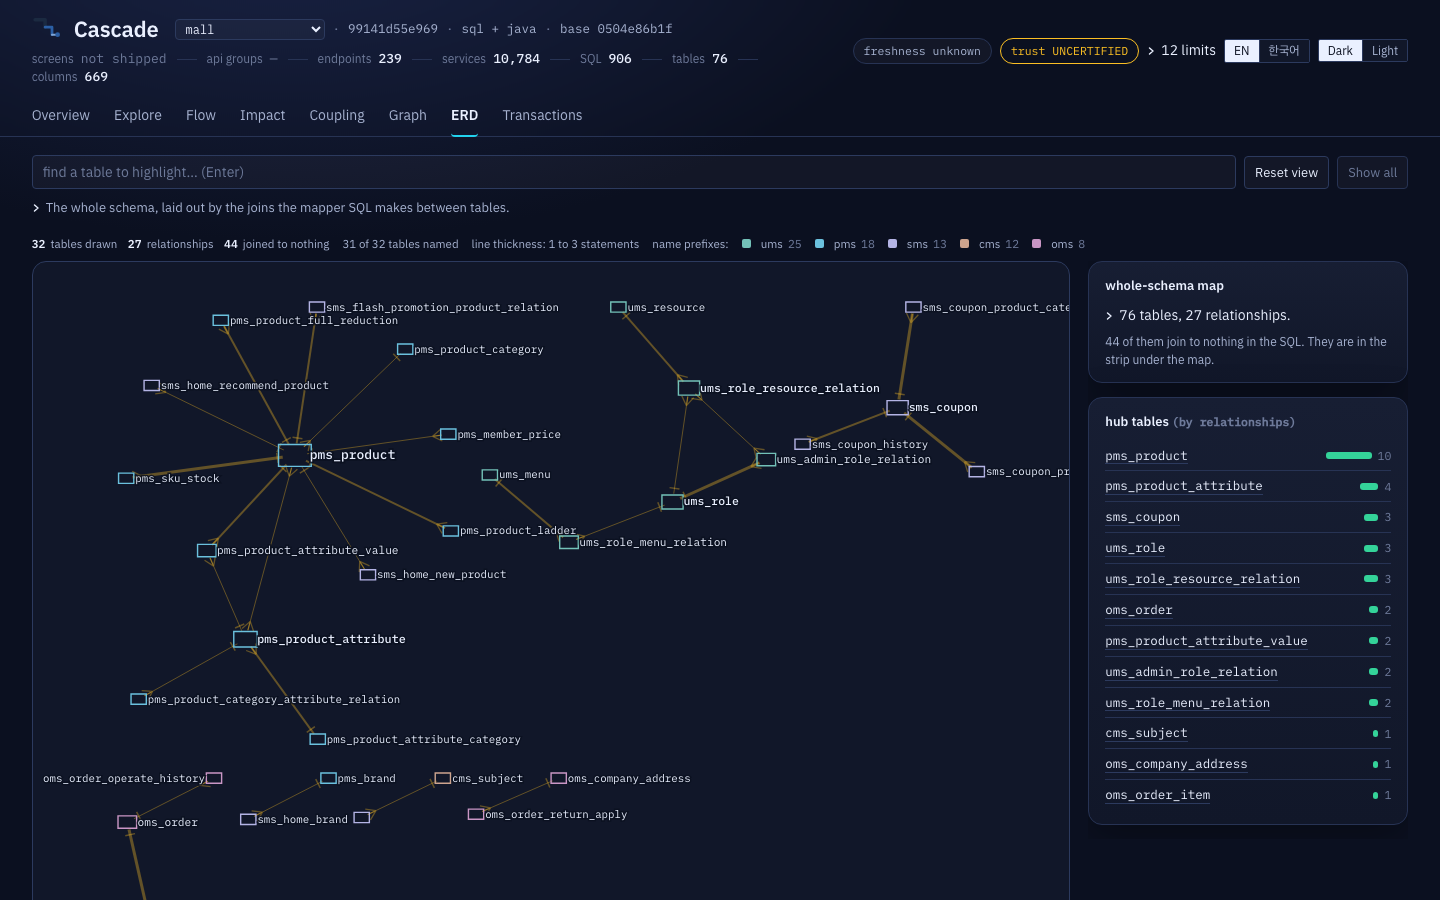
The whole schema, laid out by the joins the mapper SQL makes between tables.
Foreign keys are never read, so a relationship here is a join some statement
actually makes. On mall that is 27 relationships over 76 tables, joining 32 of
them; the other 44 sit in a strip under the map, named as such rather than
dropped.
Transactions
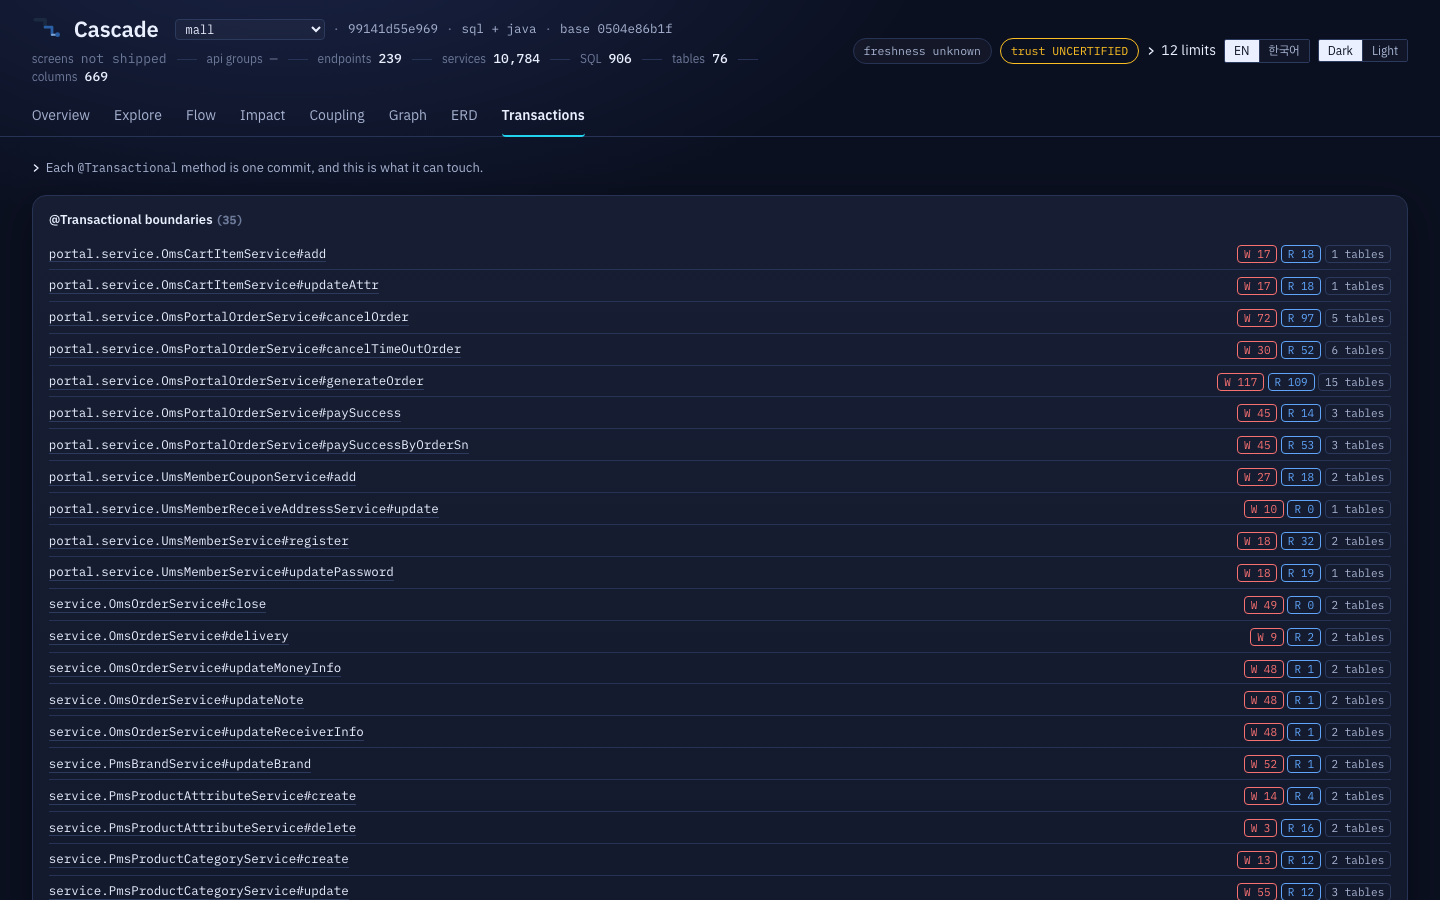
Every @Transactional method, and what one commit can touch through it. mall
has 35 of them, and the largest reaches 15 tables.
The source pane
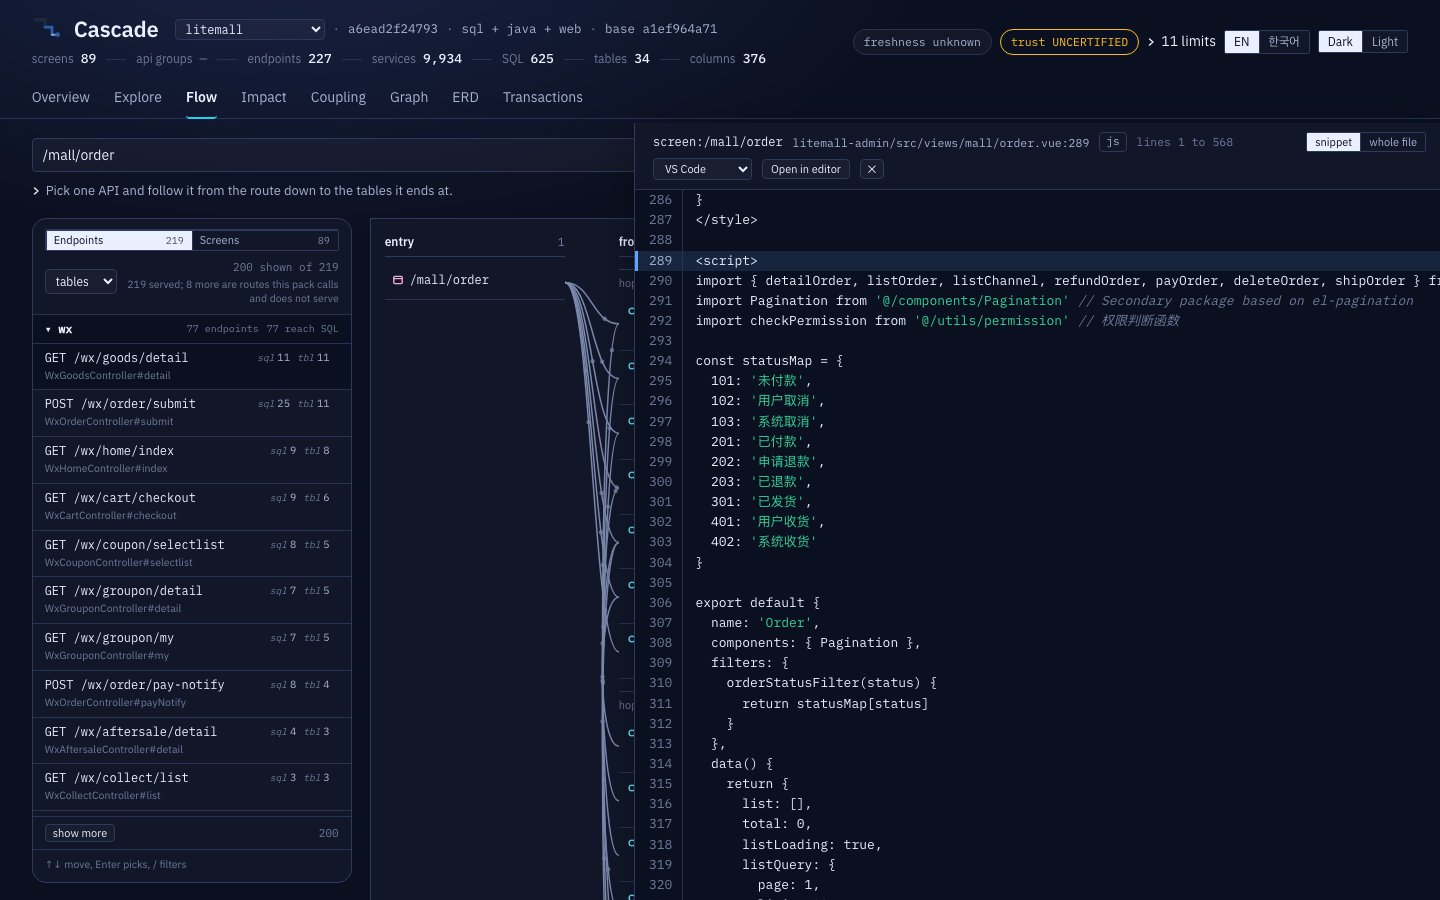
The picture is the claim; the source is the evidence. One pane shows it, docked
to the right edge, and every row that makes a claim can open it. It reads the
file on disk through a local route, so it shows what is there right now rather
than a copy baked into the pack. It carries the file's own line numbers, marks
the lines the answer is about, and Open in editor hands the file and the line
to VS Code or IntelliJ.
The browse rail
Explore, Flow and Impact open on a list, not on an empty search box: the
kinds that tab can show with their counts, a filter, a sort, and the rows with
the numbers you would pick by. Every row is one browse answer, so the page
counts nothing itself; typing filters the rows it already holds and sends no
request. / puts the cursor in the filter, the arrow keys move the highlight,
Enter picks. Under 1100px the rail becomes a drawer behind a Browse button.
The interface language toggle switches the chrome only. Grades, trust,
limits, empty reasons and every tool's own message stay exactly as the engine
wrote them, because a translated grade is a grade this project invented and no
reader could check it against the engine's own answer.
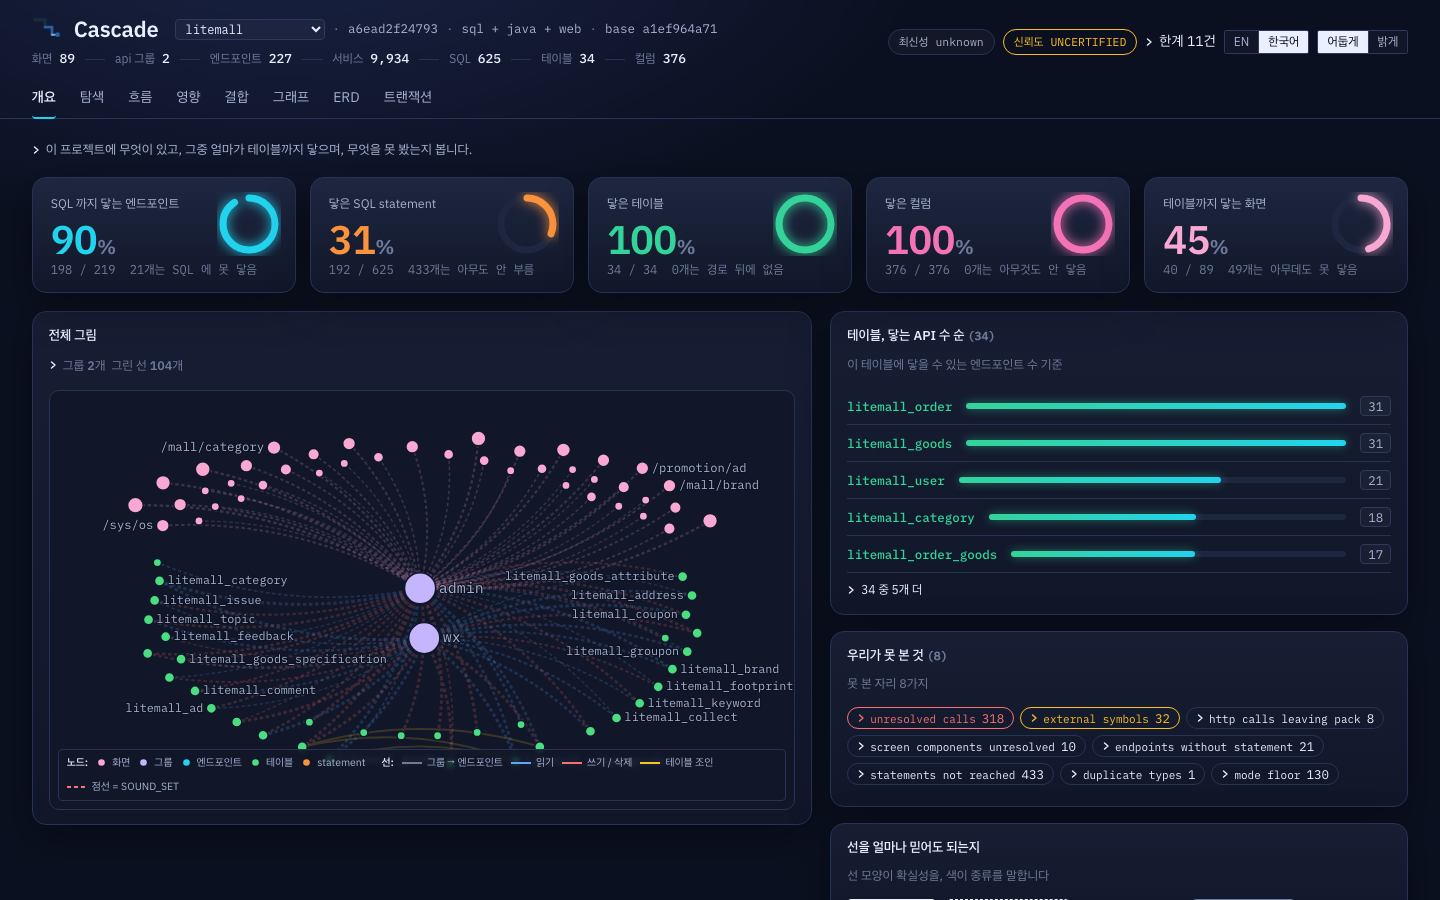
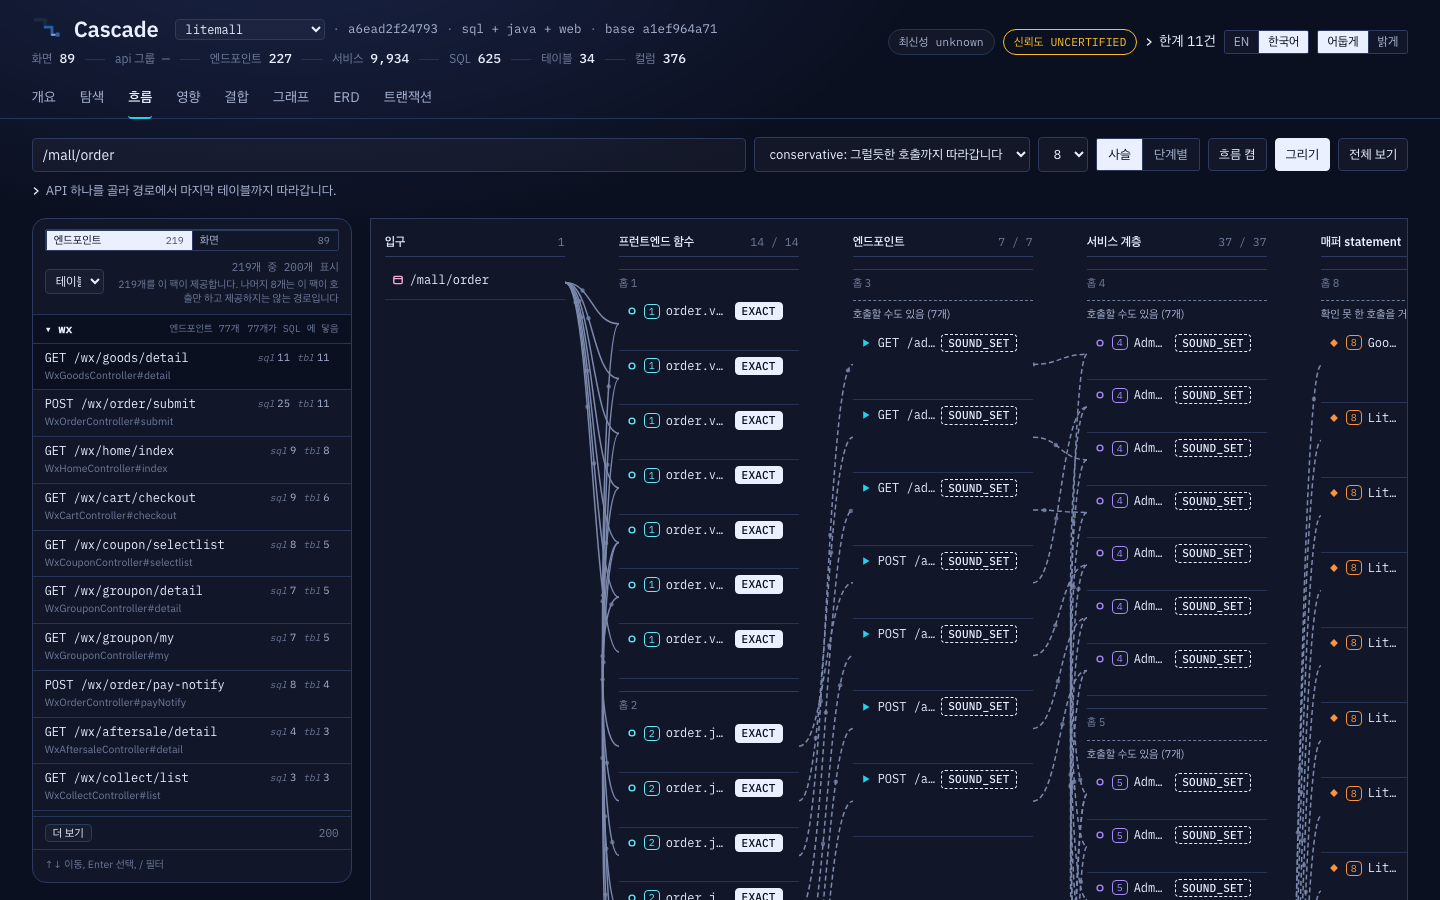
Full detail, including how to add a language:docs/viewer.md.
Profile and framework packs
cascade init writes .cascade/profile.json, and you edit it. It is the
reading convention: what this project's code means, in the places a parser
cannot tell. Every key in it is either CONSUMED, meaning it changes what the
engine does, or RECORDED and diagnosed the moment you set it. There are no dead
keys, and a test holds that.
{
  "build": { "tool": "maven", "javaRelease": null, "profiles": [] },
  "packagePrefixes": ["com.macro.mall"],
  "schema": { "default": null, "propertyNames": [], "rewriteLayer": null },
  "sqlDialects": { "main": "mysql" },
  "sqlIdentifierCase": null,
  "gatewayRoutes": { "/dev-api": "" },
  "screenAxis": {
    "enabled": null,
    "nameSource": "route-meta",
    "pathRule": "last-segment",
    "codeRegex": "([A-Z]{2}\\d{4})"
  },
  "moduleAttribution": { "packageDepth": null, "codeLength": 2 },
  "frameworkPacks": ["spring-mvc", "mybatis-xml", "jpa", "mybatis-plus", "web", "vue-router", "react-router"],
  "jpa": { "namingStrategy": "spring-snake-case" },
  "mybatisPlus": { "namingStrategy": "underscore", "tablePrefix": null,
                   "logicDeleteValue": "1", "logicNotDeleteValue": "0" },
  "openapi": { "documents": ["api/openapi.yaml"] },
  "runtimeEvidence": { "har": ["evidence/admin-session.har"],
                       "otel": ["evidence/checkout-smoke.json"] },
  "catalog": { "source": "file", "connectionFrom": "../document/sql/mall.sql" },
  "calibration": { "firstRun": "bootstrap", "maxRelativeDrop": 0.05,
                   "maxRelativeDropOnRepin": 0.25, "receiptTtlDays": 30 }
}
frameworkPacks turns lanes on. spring-mvc reads mapping annotations,mybatis-xml reads mapper XML, jpa maps entities and repositories,mybatis-plus reads generic CRUD and condition wrappers, web reads the
frontend, and vue-router and react-router say which router declarations to
recognise. cascade init writes the ones it can see: an @Entity file getsjpa, an extends BaseMapper< or a @TableName gets mybatis-plus, apackage.json depending on Vue or React gets web and its router.
gatewayRoutes maps the prefix the frontend writes to the prefix the
backend serves. {"/dev-api": ""} says the dev server strips it, and "*"
applies to every call in the project. Declaring it moves the web axis fromdegraded to shipped and its edges from HEURISTIC to SOUND_SET, because
the engine no longer has to work the prefix out by counting matches.
screenAxis decides whether router declarations become screens.enabled has three states: true and false are your word and are obeyed
whatever the run reads, and null, the default, means decide it from what this
run actually reads. That third state is what lets a backend analysed with--web-src ../front/src build screens with nothing configured. nameSource,pathRule and codeRegex shape the label and the grouping only, never the
path.
openapi.documents names OpenAPI 3 or Swagger 2 documents to read as
declared routes. A route the code also serves is corroborated; a route nothing
here serves is added with no handler edge, because a declaration says a route
exists and says nothing about what runs below it. Both drift lists, declared and
not served, served and not declared, are reported and neither is judged.
runtimeEvidence.har names browser recordings. Every request in one that
matches a route this pack serves becomes a screen to endpoint edge gradedRUNTIME_ONLY, which is below every mode's floor: it is shown and never
walked, and it never raises the grade of the static edge beside it. There is
no discovery step for recordings, on purpose: a recording is something you made
deliberately, and picking one up because it happens to be in the tree would let
an unrelated capture decide what this pack claims was observed.
runtimeEvidence.otel names OpenTelemetry trace exports (OTLP/JSON). A trace
says which concrete implementation really handled a request and which
statement it ran, which is the one thing no reading of the source can decide: a
mapper interface has no implementor in the source at all, and an interface call
is a candidate set whatever the code says. A confirmed hop keeps its grade and
gains observed: true beside it, an unobserved candidate is left exactly where
it was, and a hop no static rule explains becomes a RUNTIME_ONLY edge that is
shown and never walked. Nothing is promoted, no SQL text or bound parameter
enters the pack, and there is no discovery step.docs/setup/runtime-evidence.md.
Per-lane detail: docs/setup/sql-lane.md,docs/setup/java-lane.md,docs/setup/web-lane.md,docs/setup/db-catalog.md,docs/setup/runtime-evidence.md.
How it is measured
Three mechanisms, and the full record with the commands is ondocs/measured.md, together with the list of what is not
verified.
The generality gate
scripts/generality-gate.mjs runs this engine, unchanged and with nothing
configured, over a pinned corpus of real repositories nobody here wrote it for,
and prints what it reached. test/generality_gate.test.mjs compares the result
against test/fixtures/generality-gate.baseline.json and fails when a
repository reaches less than it did. A rise changes nothing until somebody runs--accept, which rewrites the baseline and prints the diff, because a number
that improves silently is a number nobody checked.
| Repository | Endpoints reaching a statement | Tables reached | Columns reached | Frontend calls resolved | Screens reaching a table |
|---|---|---|---|---|---|
| jeecgboot/JeecgBoot | 744 / 969 | 73 / 177 | 836 / 2092 | 538 / 929 | 19 / 166 |
| jishenghua/JSH_ERP | 330 / 339 | 32 / 32 | 409 / 413 | 165 / 221 | 0 / 7 |
| apache/dolphinscheduler | 204 / 239 | 42 / 65 | 457 / 622 | 219 / 233 | 0 / 44 |
| macrozheng/mall (+ mall-admin-web) | 205 / 239 | 49 / 76 | 461 / 669 | 145 / 153 | 44 / 54 |
| linlinjava/litemall | 198 / 219 | 34 / 34 | 376 / 376 | 172 / 191 | 40 / 89 |
| yangzongzhuan/RuoYi-Vue (+ RuoYi-Vue3) | 123 / 147 | 22 / 33 | 224 / 305 | 122 / 142 | 8 / 21 |
| jeequan/jeepay | 126 / 134 | 22 / 23 | 302 / 314 | no frontend read | no frontend read |
| xuxueli/xxl-job | 31 / 42 | 7 / 8 | 70 / 71 | no frontend read | no frontend read |
| mybatis/jpetstore-6 | 11 / 22 | 12 / 13 | 77 / 86 | no frontend read | no frontend read |
| spring-projects/spring-petclinic | 9 / 17 | 4 / 7 | 18 / 24 | no frontend read | no frontend read |
| spring-petclinic-microservices | 12 / 15 | 5 / 7 | 20 / 24 | no frontend read | no frontend read |
node scripts/generality-gate.mjs --fetch     # clone every pin, then run
node scripts/generality-gate.mjs             # run over whatever is cloned
node scripts/generality-gate.mjs --accept    # rewrite the baseline, printing the diff
The clones live outside this repository, under the cache directory, and every
run gets its own registry so the gate never writes into yours. Read the numbers
as what they are: "204 of 239 endpoints reach a statement" says the engine
connected 204 chains, not that the other 35 are wrong.
The goldens
Two real projects are pinned to a commit and checked end to end.
- mall, the MyBatis and Spring MVC golden: 239 endpoints, 906 mapper
statements, 76 tables, 669 columns and 10784 symbols, rebuilt from a fresh
clone at a new absolute path by the documented no-flag path, producing the
same pack digest each time, andpms_product.pricereaching 8 writing plus 10
reading statements and 27 endpoints. - jpetstore-6, the HSQLDB and MyBatis golden: 13 tables, 86 columns, 25
mapper statements and 22 endpoints, of which 11 reach a statement.
node --test test/mall_demo.test.mjs
node --test test/jpetstore.test.mjs
node --test test/petclinic.test.mjs      # the JPA golden, spring-petclinic
Each of these skips out loud without its fixture, naming the fixture and the
command that produces it. CI clones all three at pinned commits and fails if any
of those tests skips, because a permanent self-omission on a fresh clone is a
defect rather than a pass.
The incremental oracle
test/incremental.test.mjs builds a synthetic Spring, MyBatis and MySQL project
in a git repository, mutates a random subset of its files each round with a
seeded PRNG, and requires the incremental pack to equal a cold pack byte for
byte. The correctness claim about reuse is that test, not a promise in a
document.
node --test test/incremental.test.mjs
node --test test/overlay_integration.test.mjs   # the overlay omits nothing a full re-analysis finds
Layout of the repository
bin/cascade.mjs          the CLI: doctor | init | analyze | estimate | verify | golden |
                         catalog discover|fetch | pack | impact | mcp | view
src/core/                the pure engine: determinism, the grade lattice, the graph, the pack,
                         the response protocol, the working-tree overlay, the chain walk; plus
                         the project layer (discover, init, profile, lanes, estimate, registry,
                         resolve, paths) and the incremental core (changeset, invalidate,
                         facts_store, incremental, worker_versions)
src/mcp/                  the response contract, the query tools, the tool catalog, the stdio and
                         HTTP servers, and the multi-project host: lazy loading, an LRU under a
                         memory budget, and routing that refuses to guess which project a call means
src/adapters/            the lane-output to graph bridges: sql_bridge, java_bridge, jpa_bridge,
                         mp_bridge, mybatis_annotation, web_bridge, openapi_bridge, har_bridge
src/viewer/              the viewer's pure logic under test: the string catalogue and lookup, the
                         deterministic graph layout every picture is drawn from, and the source pane
adapters/sql/            Python workers: catalog_ddl, catalog_live, mybatis_extract, lineage
adapters/java/           the Java worker: JavaFacts, the parse-only javac Tree API pass
adapters/web/            the frontend worker (webfacts) and its declaration packs: one JSON file per
                         router convention and one for the HTTP client libraries
viewer/index.html        the self-contained viewer page, served by `cascade view`
viewer/i18n/             one JSON catalogue per non-English interface language
viewer/vendor/           the two vendored MIT browser bundles every graph picture renders with
scripts/                 generality-gate.mjs (the pinned corpus), the memory and pack cost
                         measurements, the java smoke check, the DCO check
test/                    the suite, including the goldens, the incremental oracle, the gates and
                         the documentation drift checks
docs/                    the docs site: concepts, cli, mcp, viewer, measured, setup/, and ko/
<project>/.cascade/      per-project state: manifest.json (repositories pinned to full commits),
                         profile.json (the reading convention), and pack/ and catalog/, both
                         gitignored because they carry your SQL text and column comments
~/.cascade/registry.json where the tool remembers which project lives where
$XDG_CACHE_HOME/cascade/  the regenerable fact shards, always outside your source tree. Delete it
                         and the next run is cold
Contributing, security, conduct
CONTRIBUTING.md: how a round works, the three suites, the
gates and what each one checks, the nine invariants with the test behind each
and the honest state of the two that are not fully closed, the contributions
this project does not accept, and the DCO sign-off (git commit -s).SECURITY.md: report privately through GitHub Security
Advisories, never a public issue. It also spells out what is not a
vulnerability here: a wrong reachability answer is an accuracy bug and belongs
in the open, with the fixture that shows it.CODE_OF_CONDUCT.md: Contributor Covenant 2.1.CHANGELOG.md: what each round added, and the two lists at
the end that separate what has been measured from what has not.- Docs site:
docs/index.md.
License
Apache-2.0 (LICENSE). The engine and its servers have no npm dependencies.
Three things are carried from somebody else and are credited in NOTICE:
- the viewer's browser bundles under
viewer/vendor/,force-graphand3d-force-graphwiththreeinside it, all MIT; - the web lane's parser under
adapters/web/vendor/,@babel/parser, MIT,
pinned to the sha256 its own README publishes; - the viewer's three Latin web-font subsets, IBM Plex Sans and IBM Plex Mono,
under OFL-1.1.
Optional native analysis lanes, such as a future JVM dataflow lane under an LGPL
solver, live in separate subprojects under their own licenses and are never
linked into the Apache-2.0 core. NOTICE carries that boundary in full.
Yorumlar (0)
Yorum birakmak icin giris yap.
Yorum birakSonuc bulunamadi