map-design
Health Pass
- License — License: MIT
- Description — Repository has a description
- Active repo — Last push 0 days ago
- Community trust — 10 GitHub stars
Code Pass
- Code scan — Scanned 12 files during light audit, no dangerous patterns found
Permissions Pass
- Permissions — No dangerous permissions requested
No AI report is available for this listing yet.
An agent skill for real maps: data maps and city posters as self-contained HTML, SVG and PNG. No API keys or runtime dependencies.
Map Design
Your coding agent cannot draw a coastline. With this skill it does not have to.
An agent skill that turns "poster of Lisbon in azulejo blue" or "map this CSV by state"
into a real, accurate map: one self-contained HTML page, an SVG and a print-ready PNG.
Real borders, coastlines and coordinates. No API keys. No runtime dependencies.




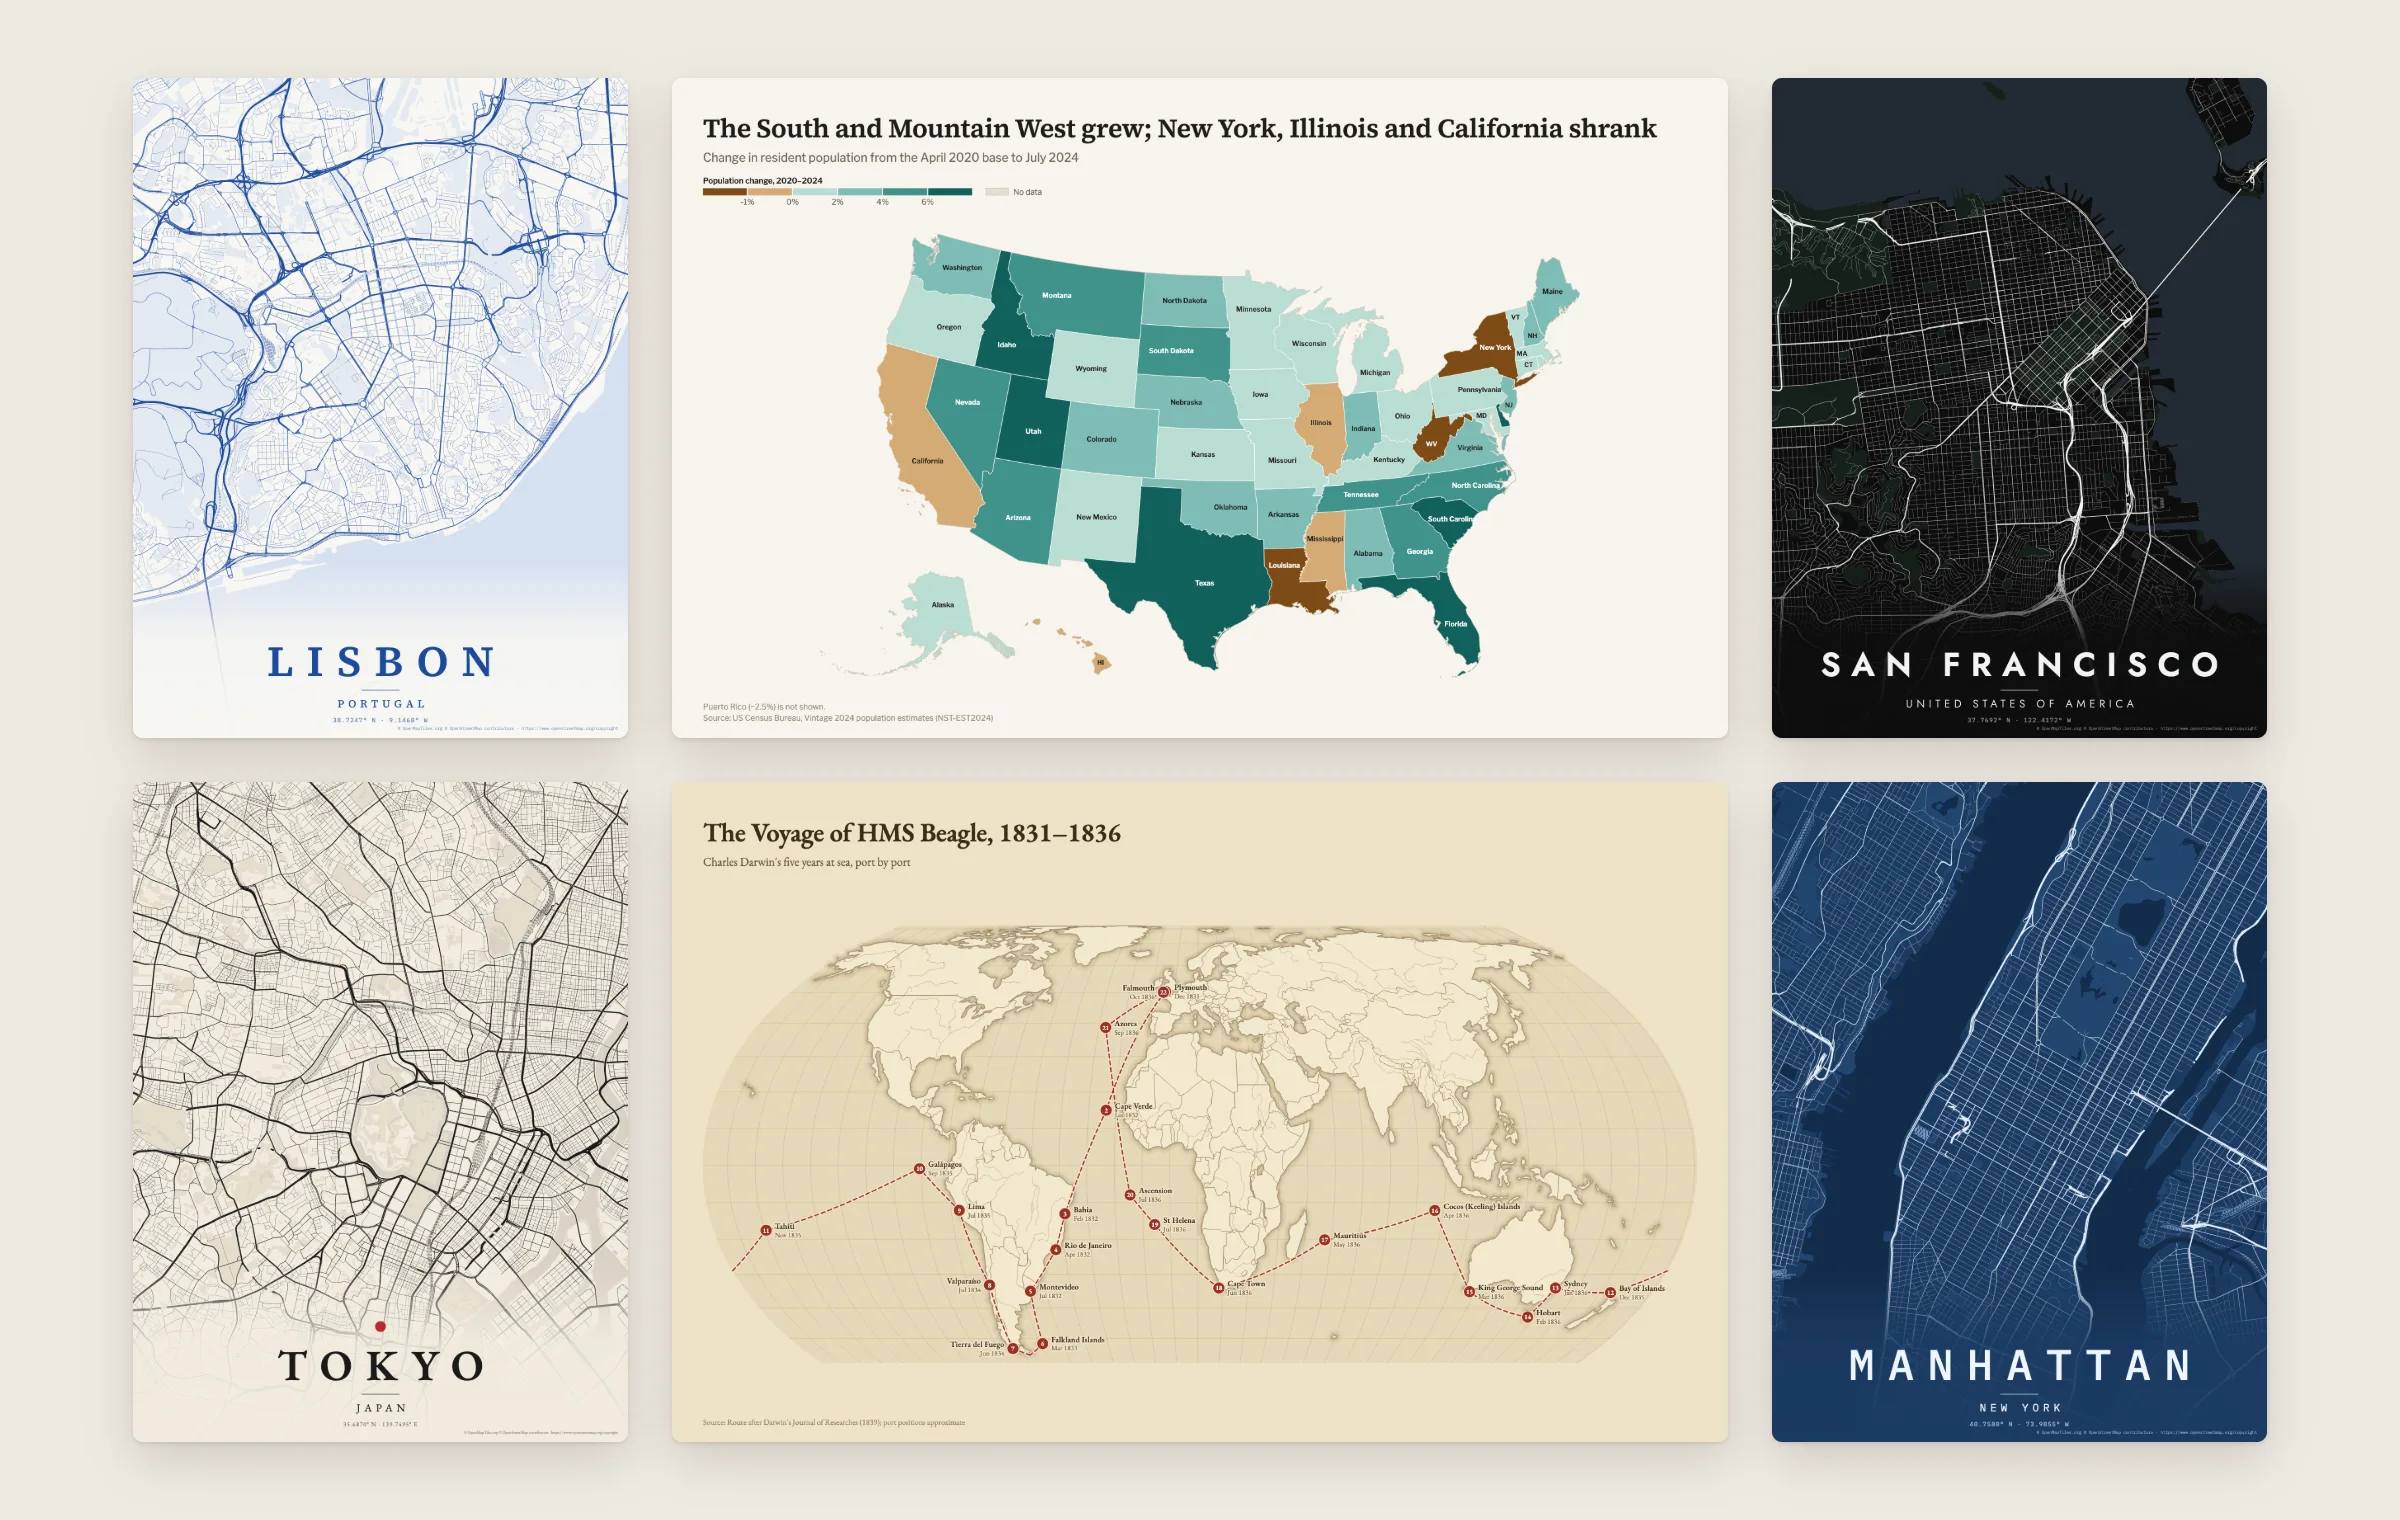
Street poster data: © OpenStreetMap contributors (ODbL).
npx skills add ashishkaloge/map-design
Ask for a map · Why a skill · Gallery · Install · What it makes · How it works · Limits
Ask for a map
Once installed, ask your agent the way you would ask a designer:
- "Make a poster of Lisbon in azulejo blue."
- "Map population change by US state from this Census CSV."
- "Where is Bhutan? Show it with a small globe."
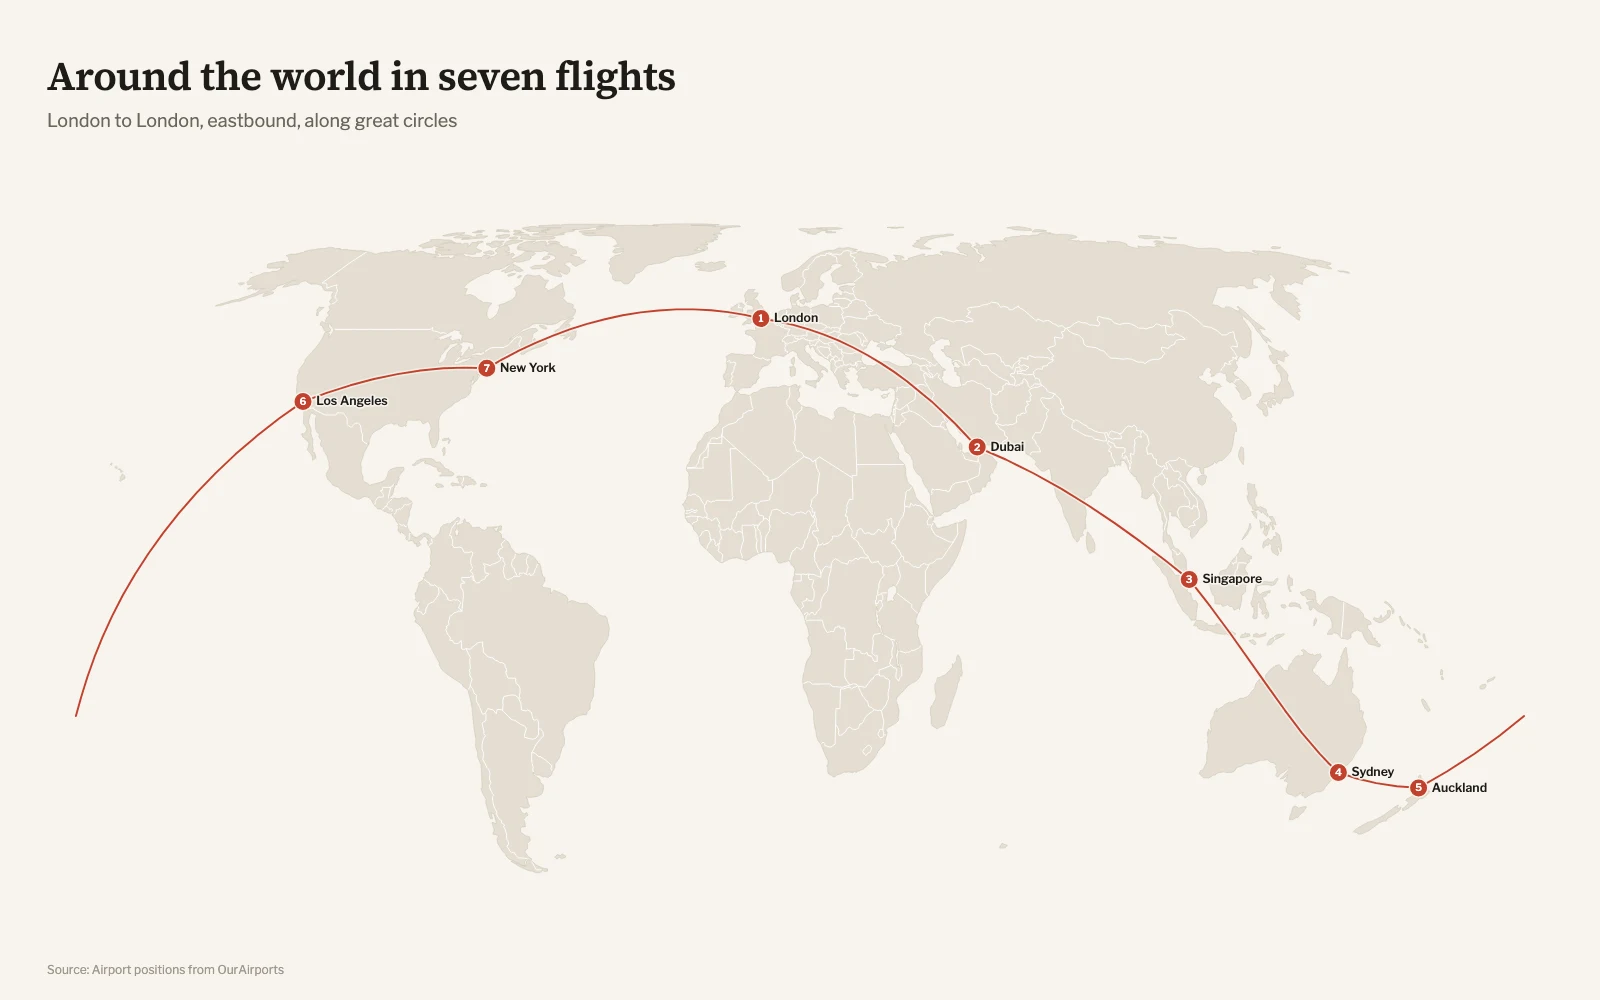
- "Plot my trip: London, Dubai, Singapore, Sydney, Auckland, LA, New York, back to London."
- "Bubble map of our stores by revenue. The data is in stores.csv."
- "Poster of the streets around Juhu Beach with a pin where we met."
- "Shade turnout by ward. Boundaries are in wards.geojson, results in turnout.csv."
- "Map my Sunday ride from ride.gpx."
The agent writes a short JSON spec, runs one command, looks at the PNG, fixes
what it sees, and hands you the files. Every place it resolved and every row it
could not match is listed, so nothing is silently guessed.
Why a skill
A language model knows Lisbon sits on the Tagus. It does not know the shape of
the river, or where thousands of streets run. Ask an agent for a map without help and
you get hand-drawn blobs, invented coordinates, or Leaflet boilerplate that
needs a tile server and an API key.
Map Design splits the work. The model decides what the map should say. The
renderer supplies real geography and cartography.
| Map | The agent writes | The renderer draws |
|---|---|---|
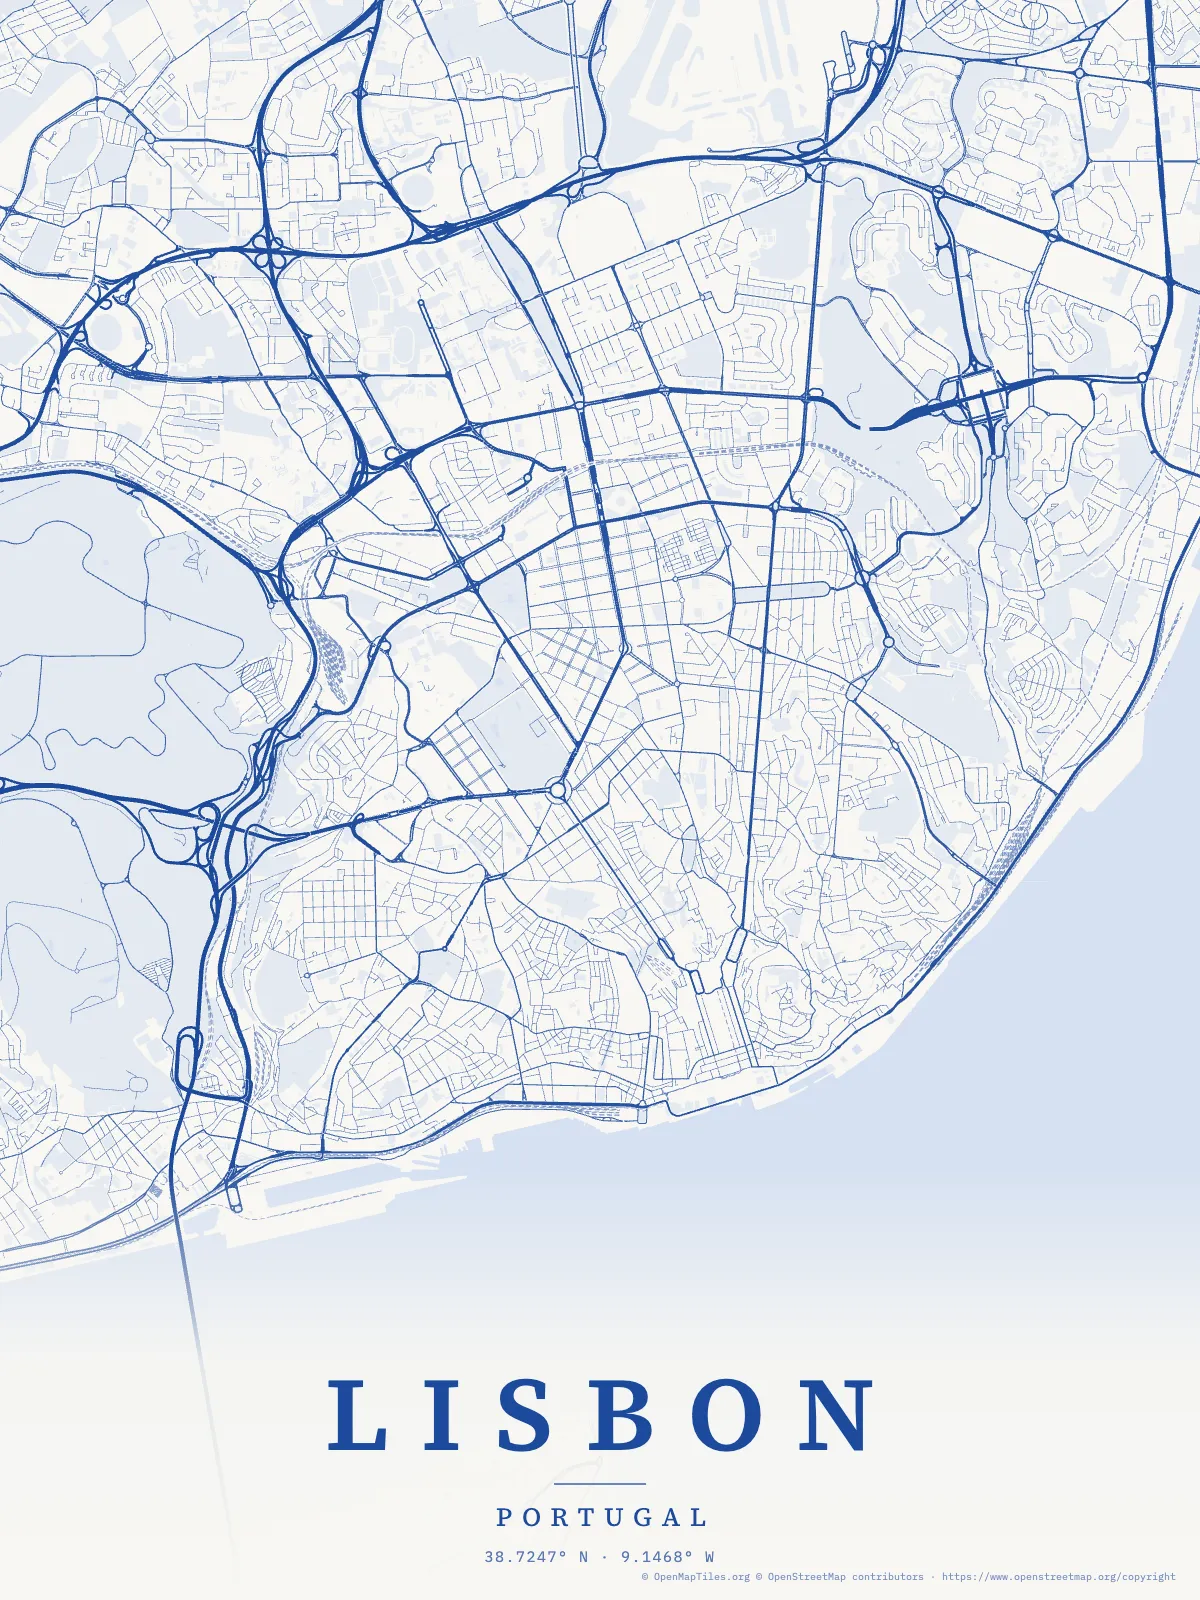
| Lisbon poster | a 93-byte spec | 1 MB of paths: streets in an 8 km frame, the Tagus and its parks, with named features on hover |
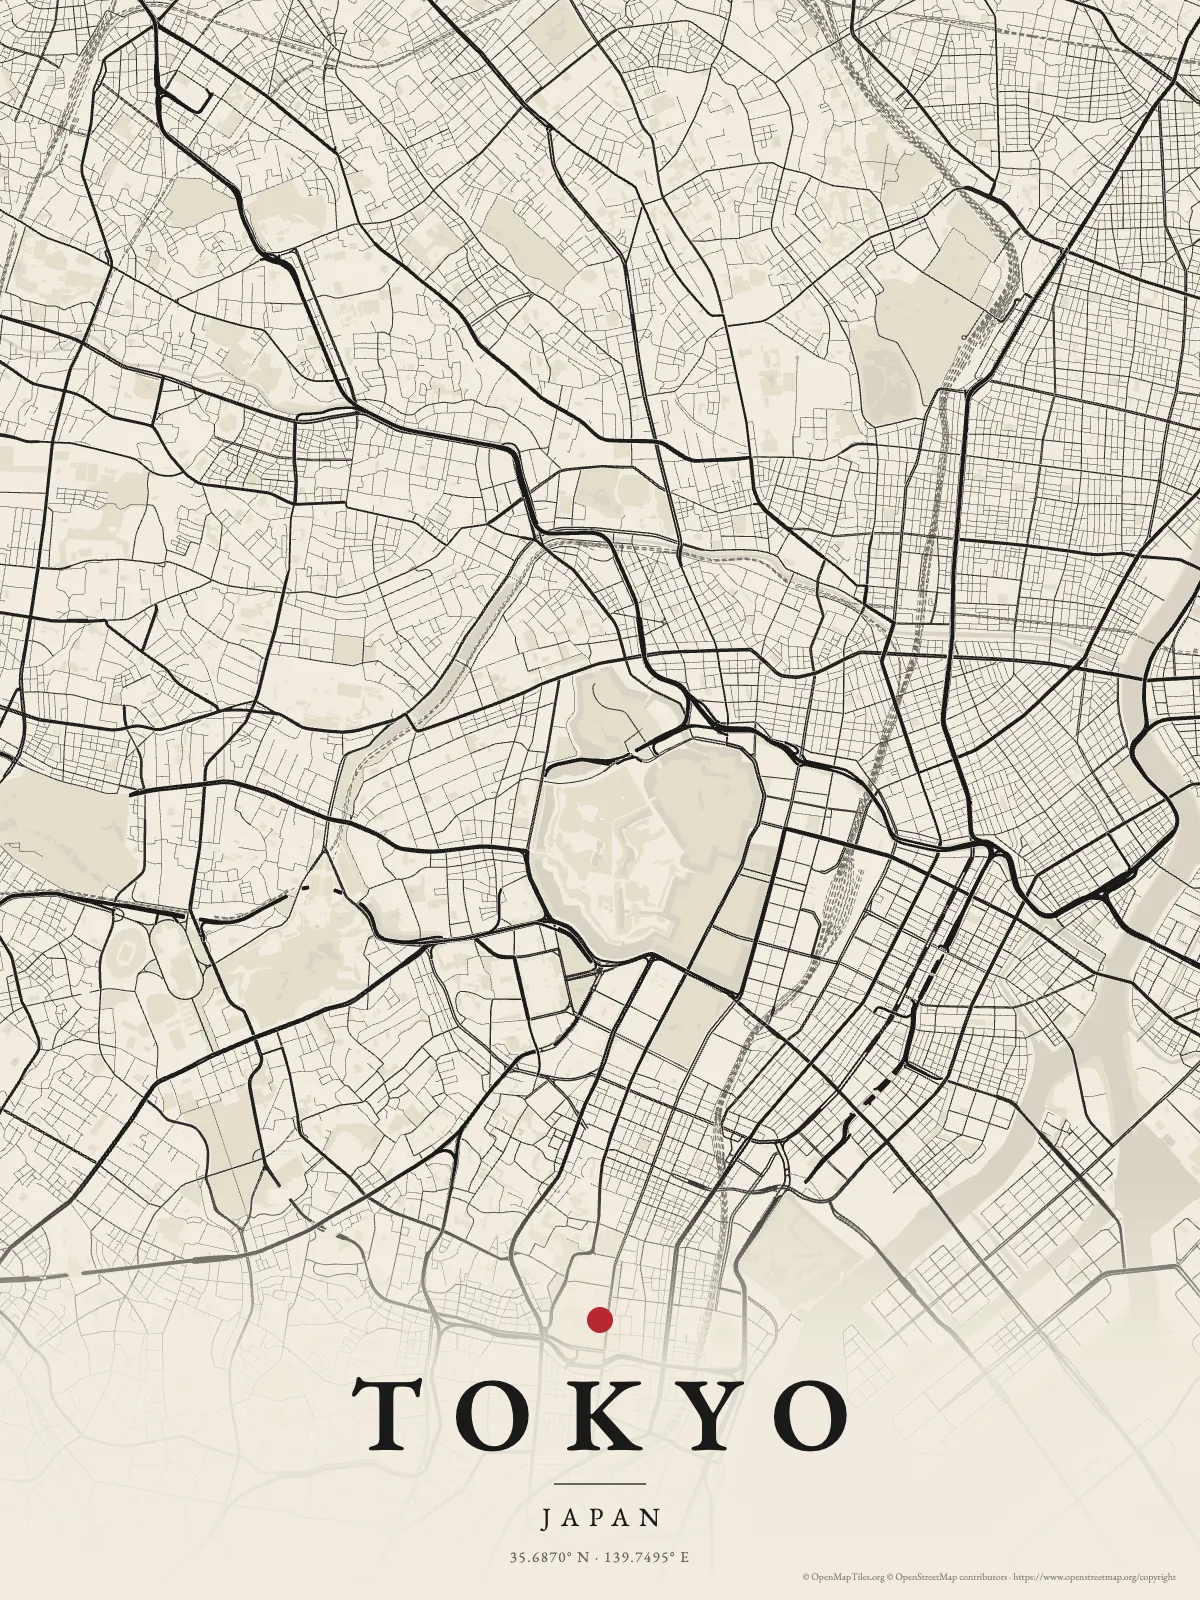
| Tokyo poster | 89 bytes | 1.2 MB: streets around the Imperial Palace, with names from the source data on hover |
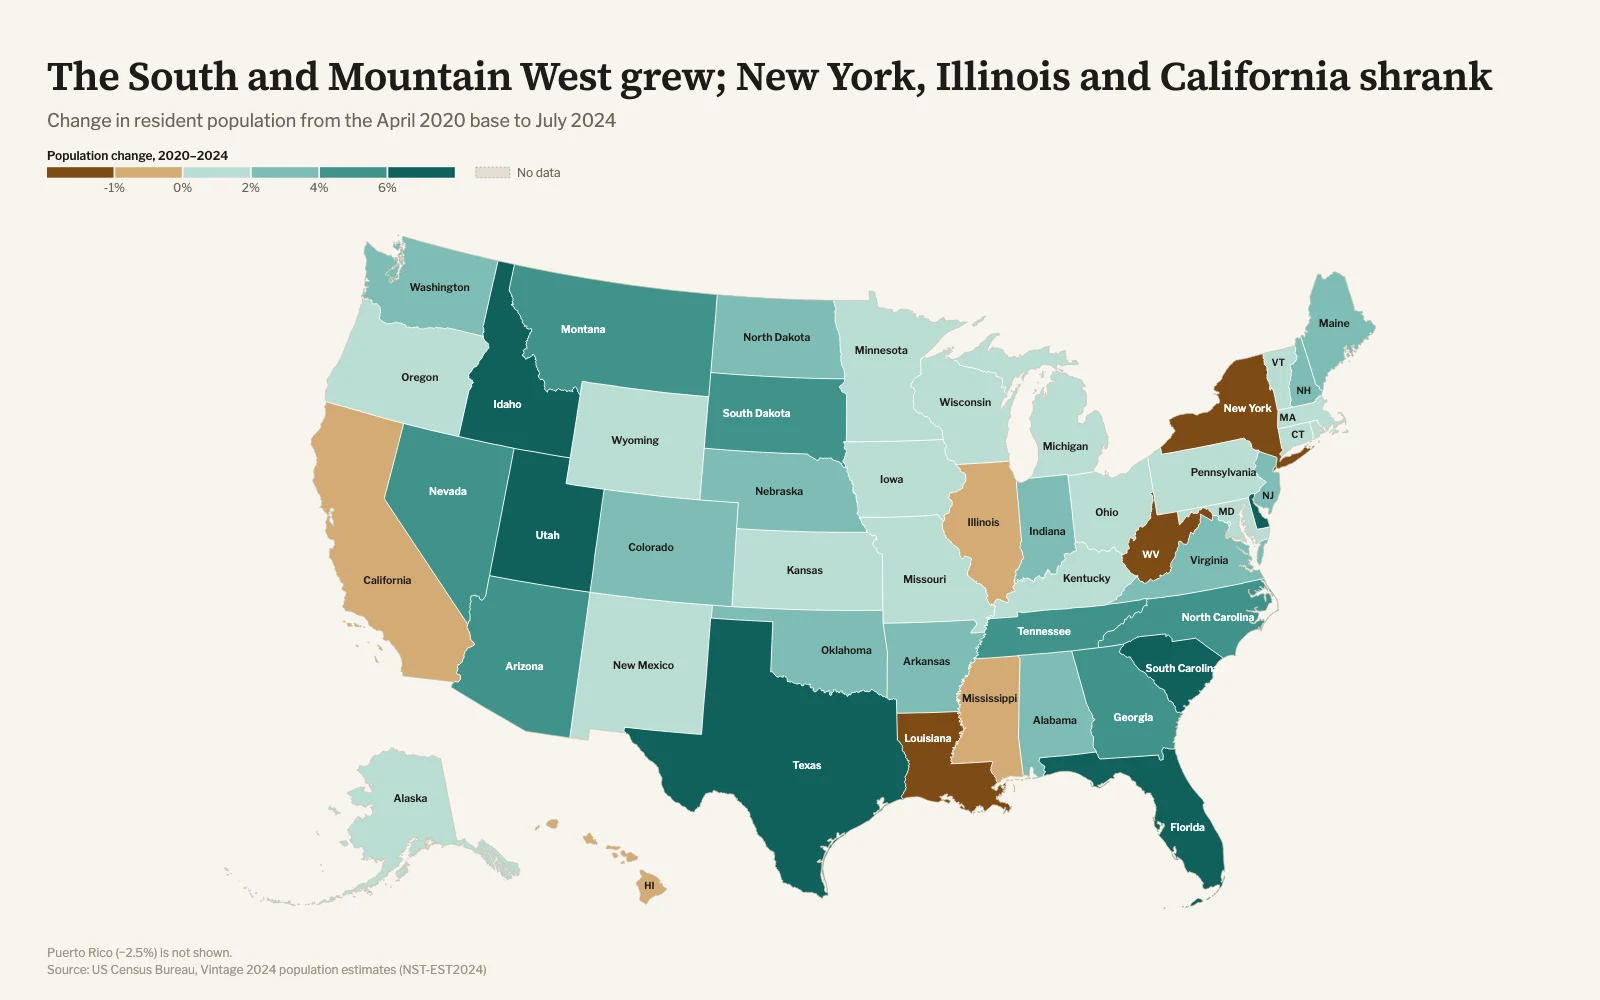
| US population change | 661 bytes and a Census CSV | 50 states and DC, classed, labeled, with legend and source |
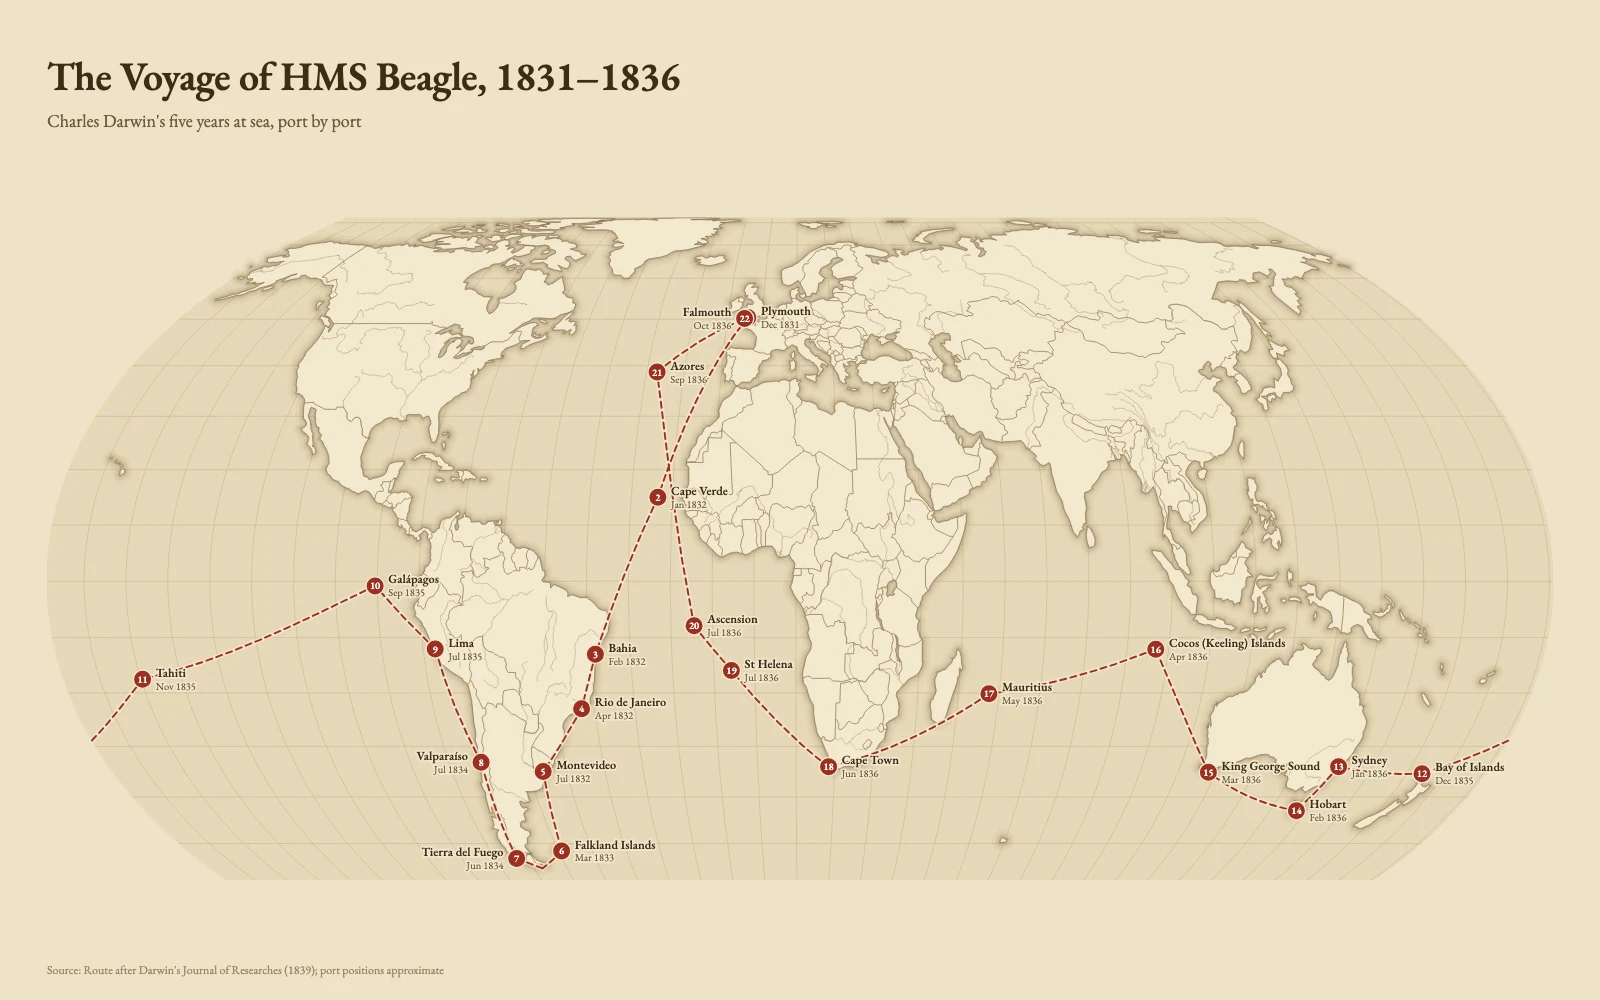
| Voyage of HMS Beagle | 22 stops | great-circle legs on an equal-area projection, numbered and dated |
Things a model gets wrong from memory and this skill gets right:
- Joins. "Korea, Rep.", "Côte d'Ivoire", "Türkiye", ISO codes, FIPS codes
and World Bank names all match. Rows that do not match are listed with the
closest names. Nothing is dropped quietly. - Ambiguous places. "Lima" is also in Ohio and "Sydney" is also in Nova
Scotia. The report says which one it used and how to be explicit. - Projections. Equal-area by default (Equal Earth, Albers USA with Alaska
and Hawaii, conic and azimuthal for regions). Antarctica is cropped from world
maps unless the data goes there. No Mercator world maps. - Honest encodings. Raw counts on a choropleth trigger a warning. Diverging
palettes need a meaningful midpoint. Every map carries its source. - Your own files. GeoJSON wound the "wrong" way, open rings, codes that lost
their leading zeros, a TopoJSON with several objects, a shapefile exported in
UTM metres, a GPS track logged every metre. Supported geometry is checked
before drawing; unsupported formats and coordinate systems get conversion
guidance.
Gallery
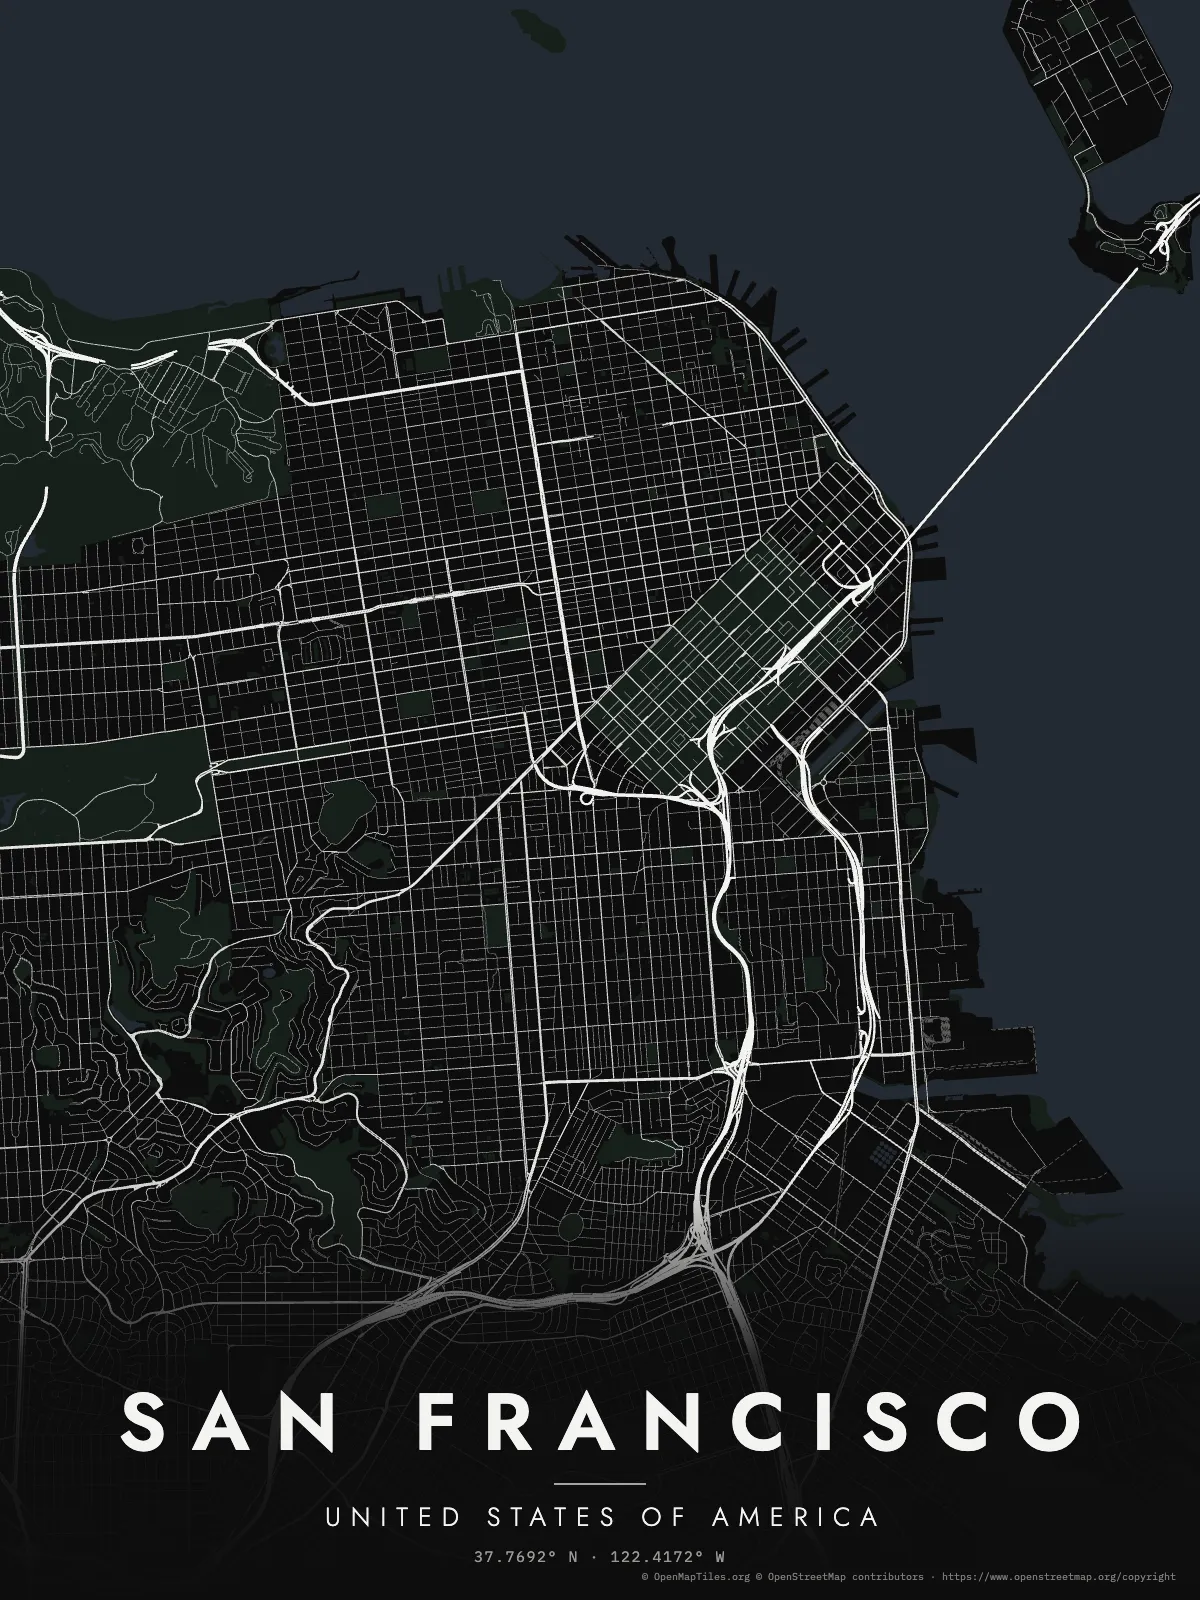
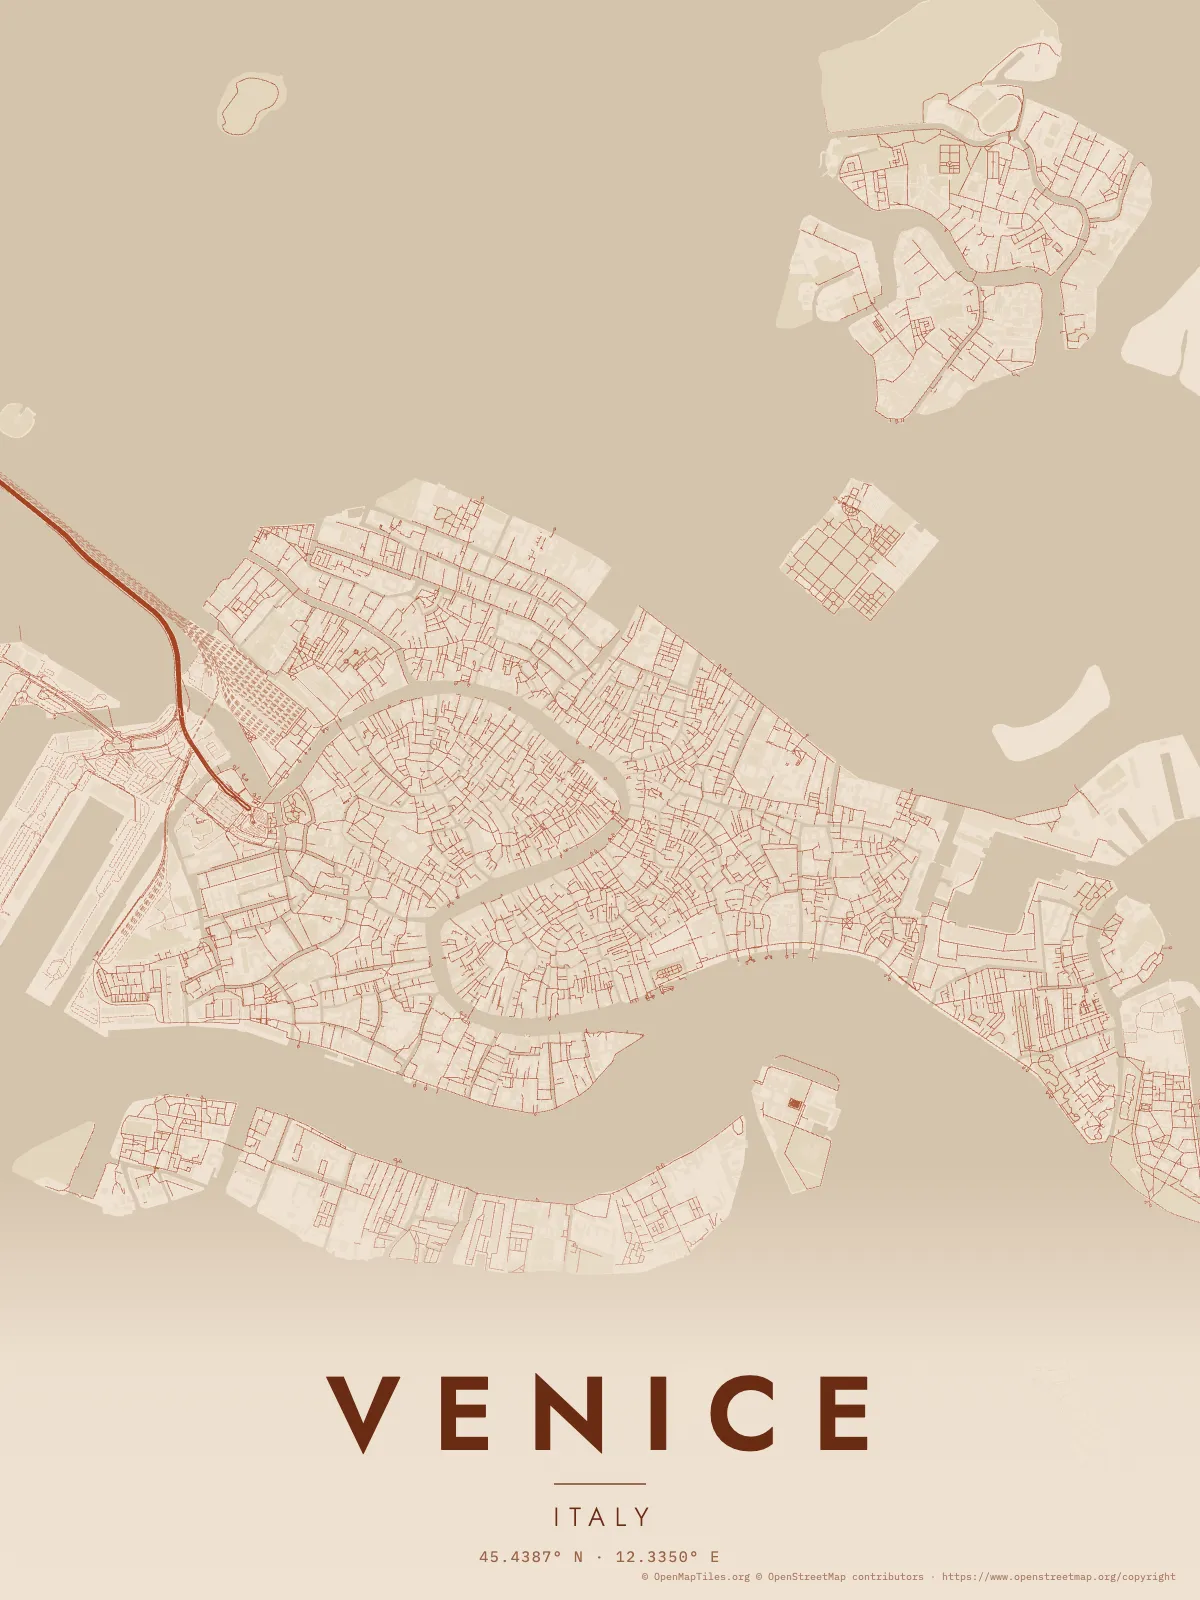
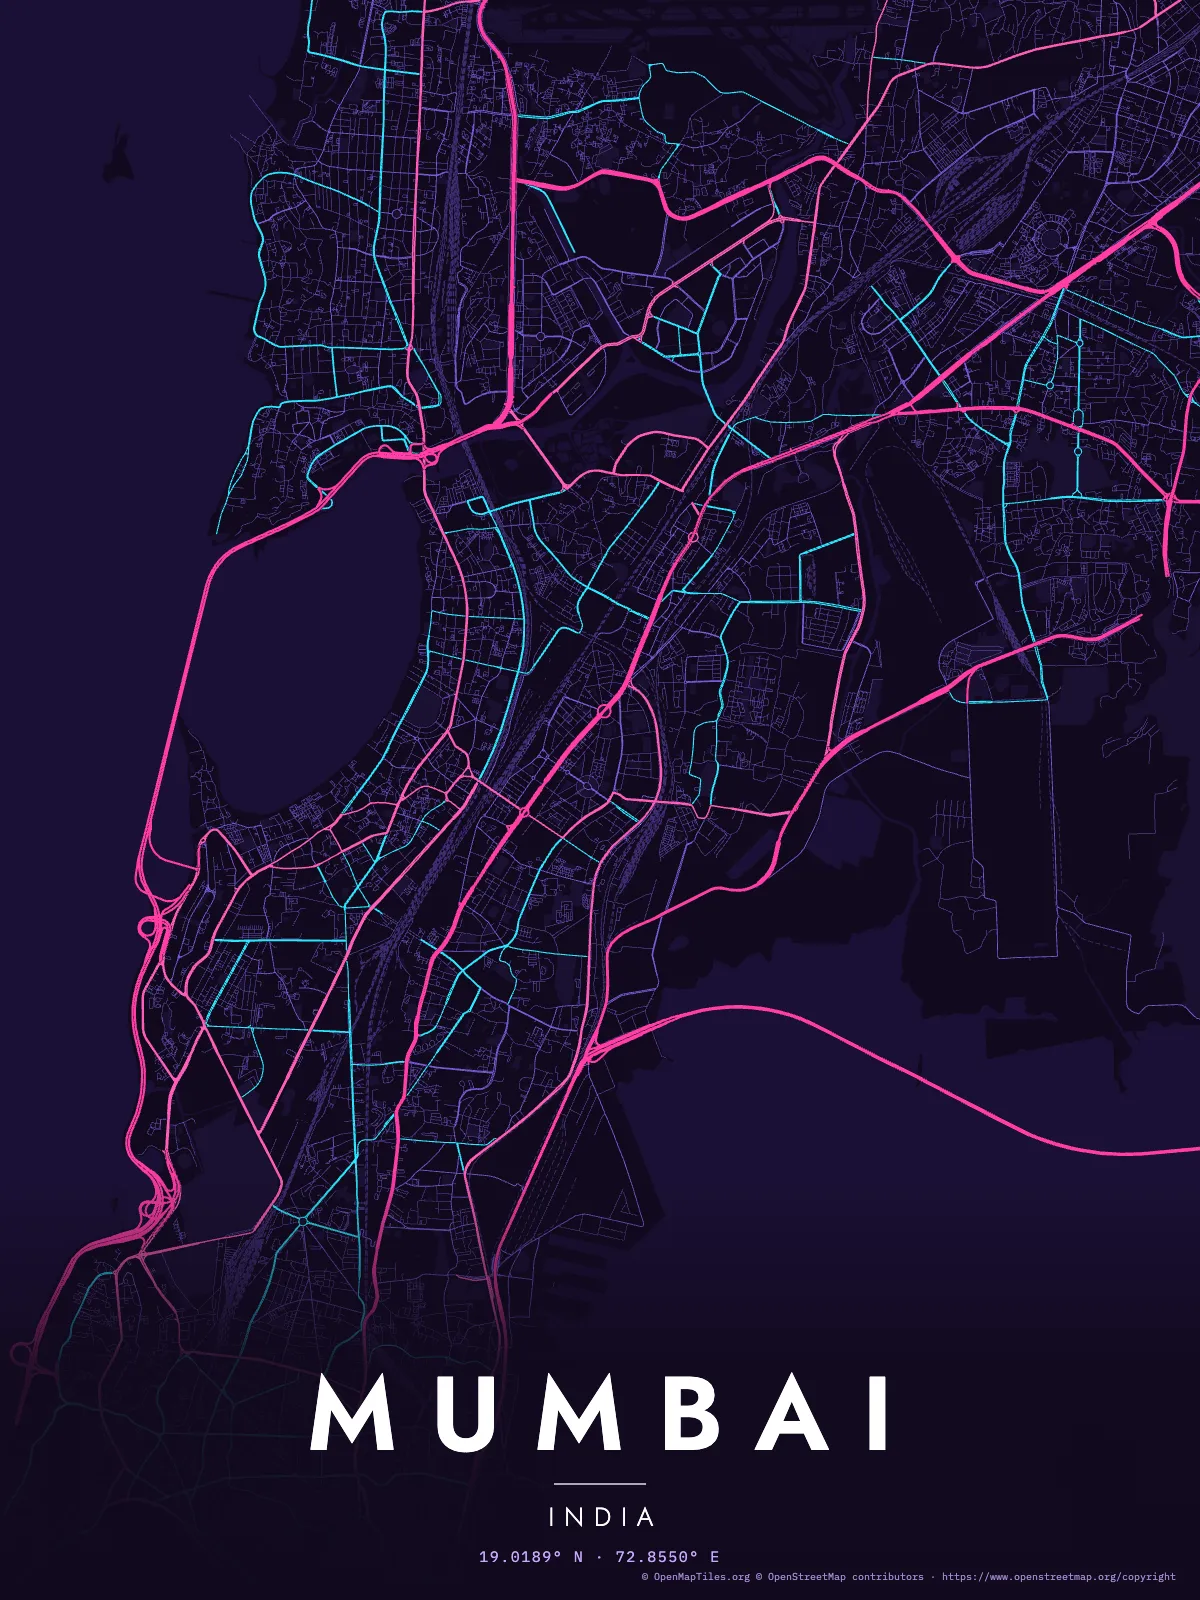
Every map below is real data, rendered by the skill from the spec it links to.
Street posters use © OpenStreetMap contributors data (ODbL).
 |
 |
 |
San Francisco · noir · spec |
Venice · terracotta. Few streets for cars, so it switched to footpaths · spec |
Mumbai · neon · spec |
 |
 |
 |
Tokyo · sumi · spec |
Lisbon · azulejo · spec |
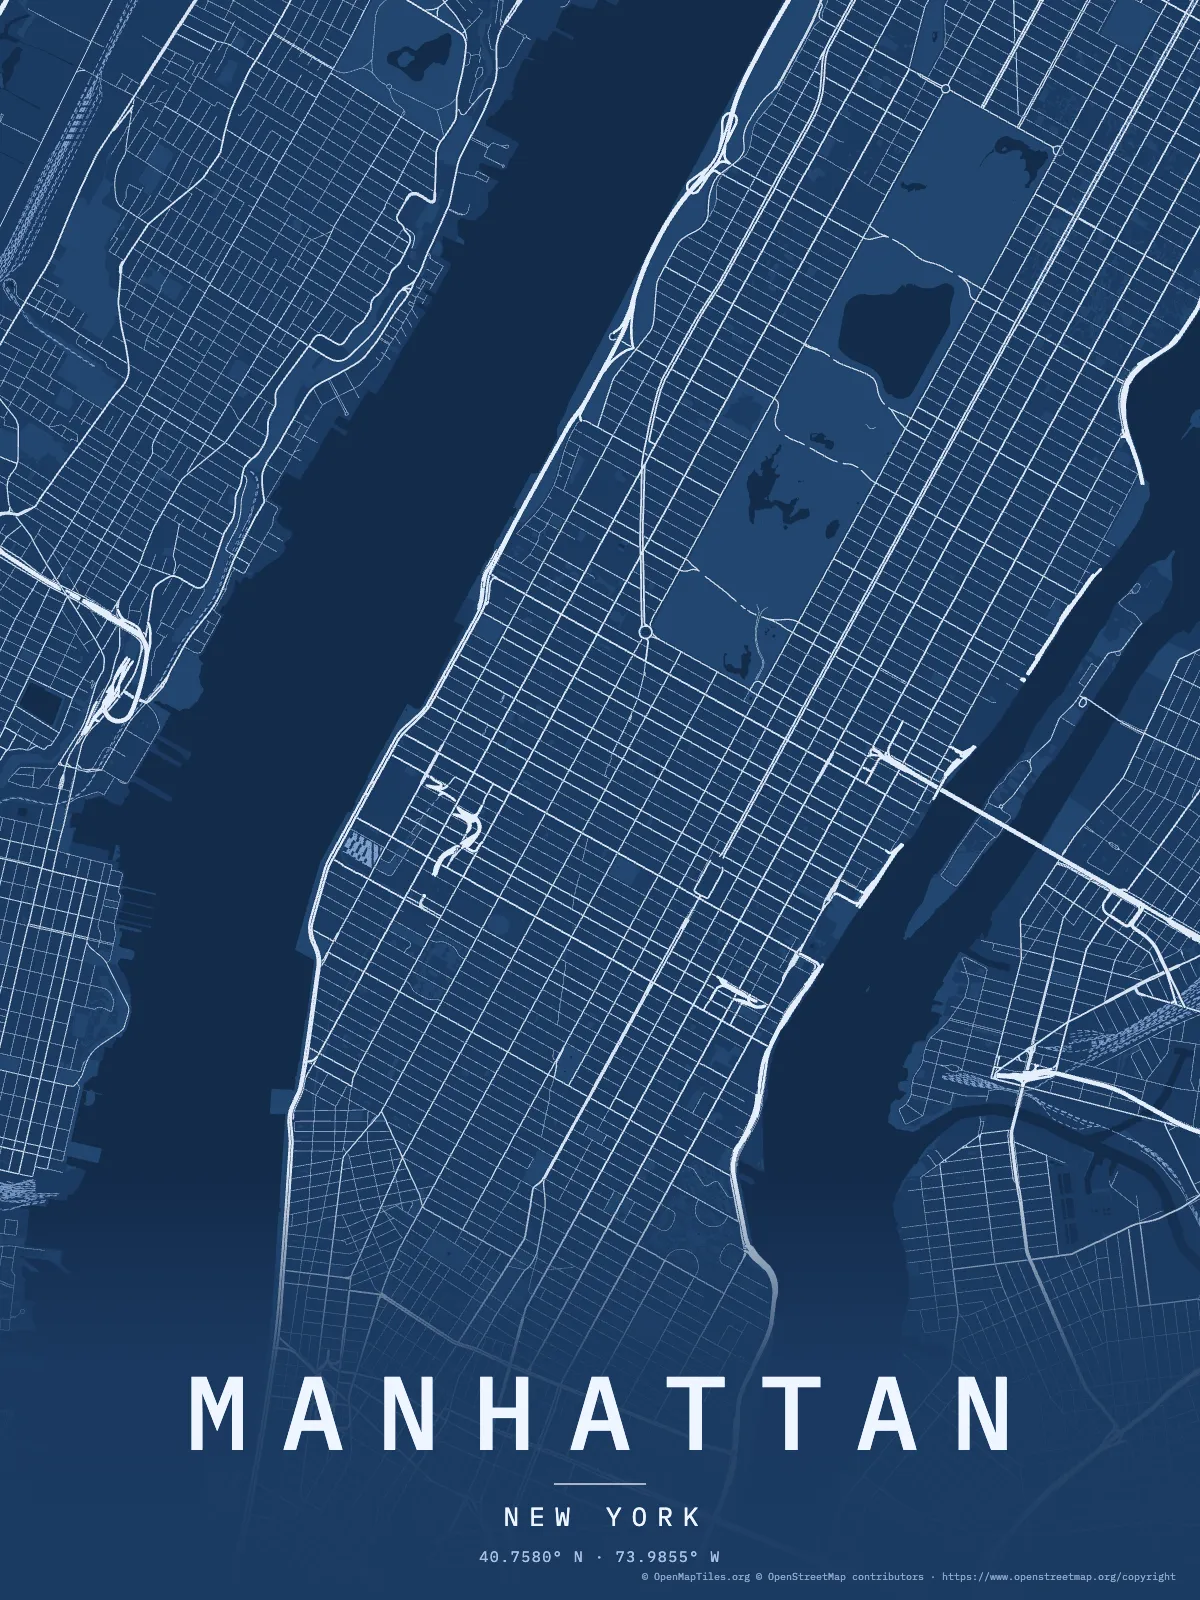
Manhattan · blueprint · spec |
 |
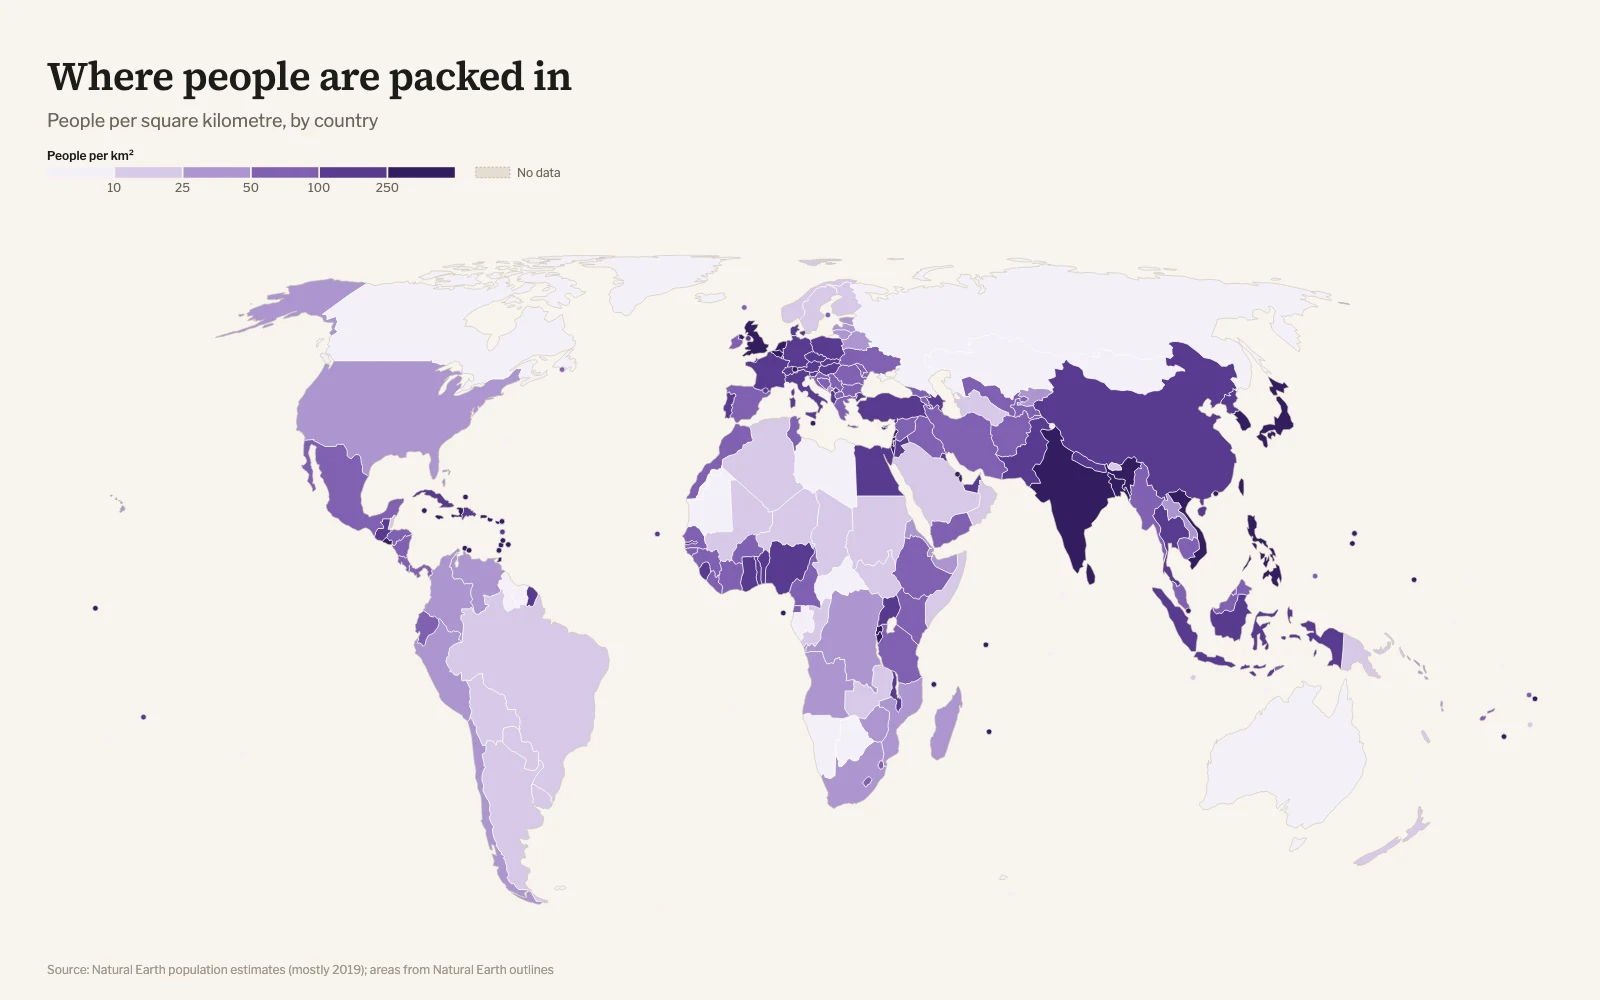 |
| Choropleth by US state, diverging around zero. US Census Bureau data · spec | Choropleth by country from the built-in table, no data file needed · spec |
 |
 |
Route · antique, numbered and dated stops · spec |
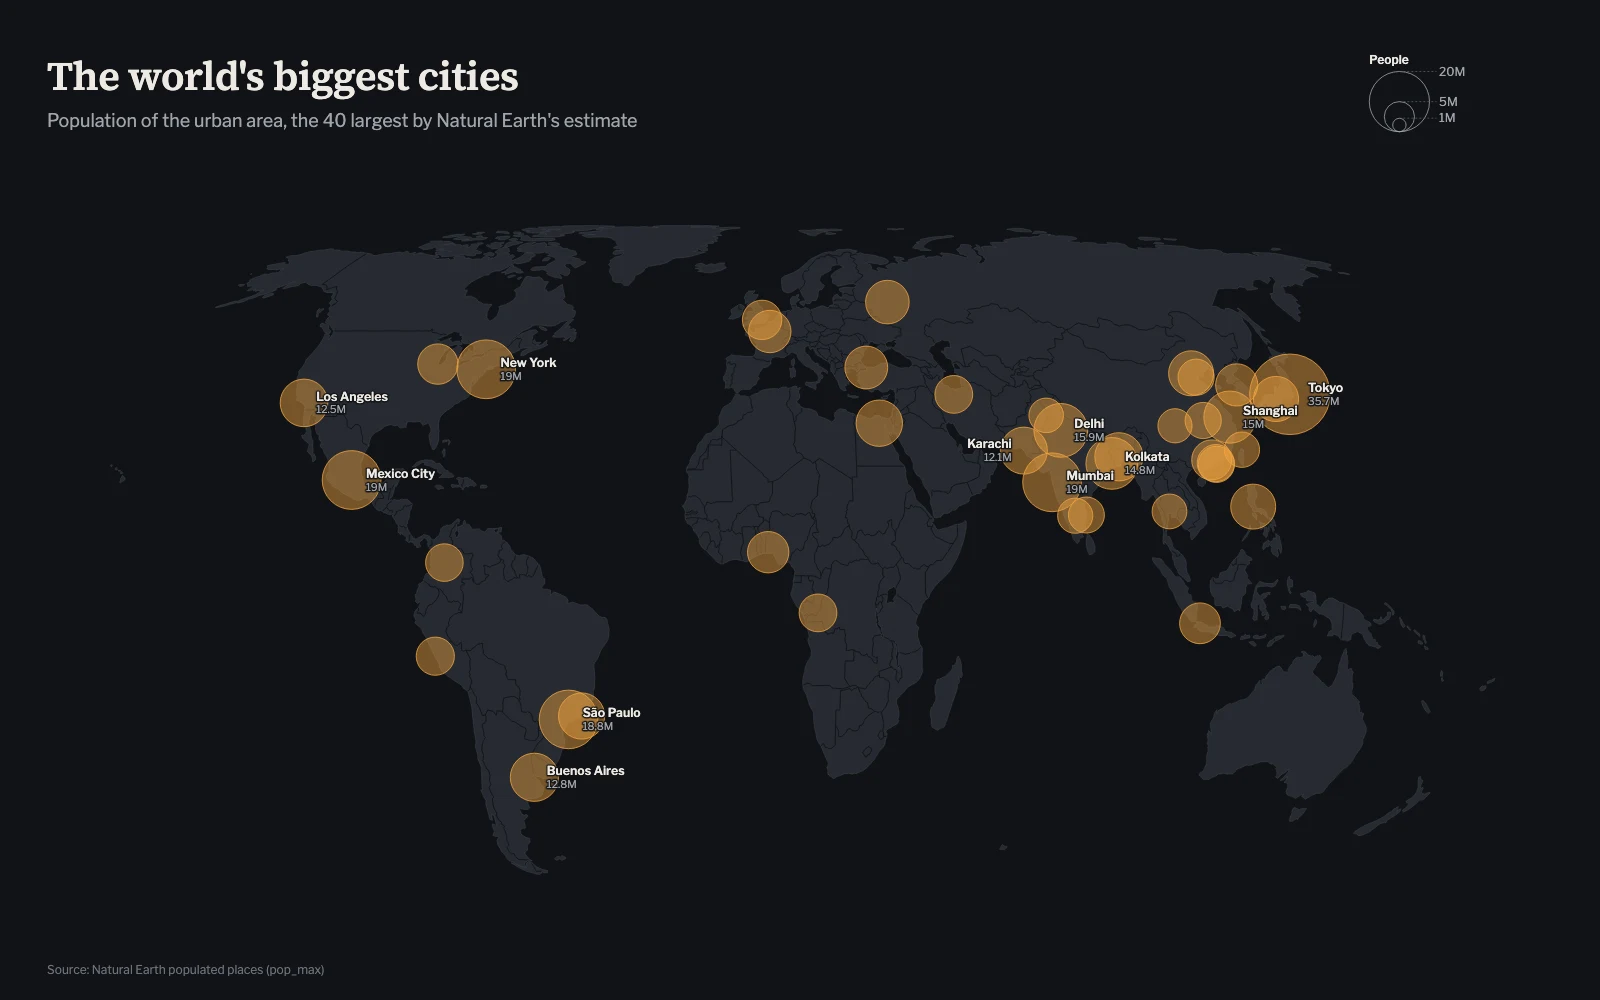
Bubbles · ink, area proportional to population · spec |
 |
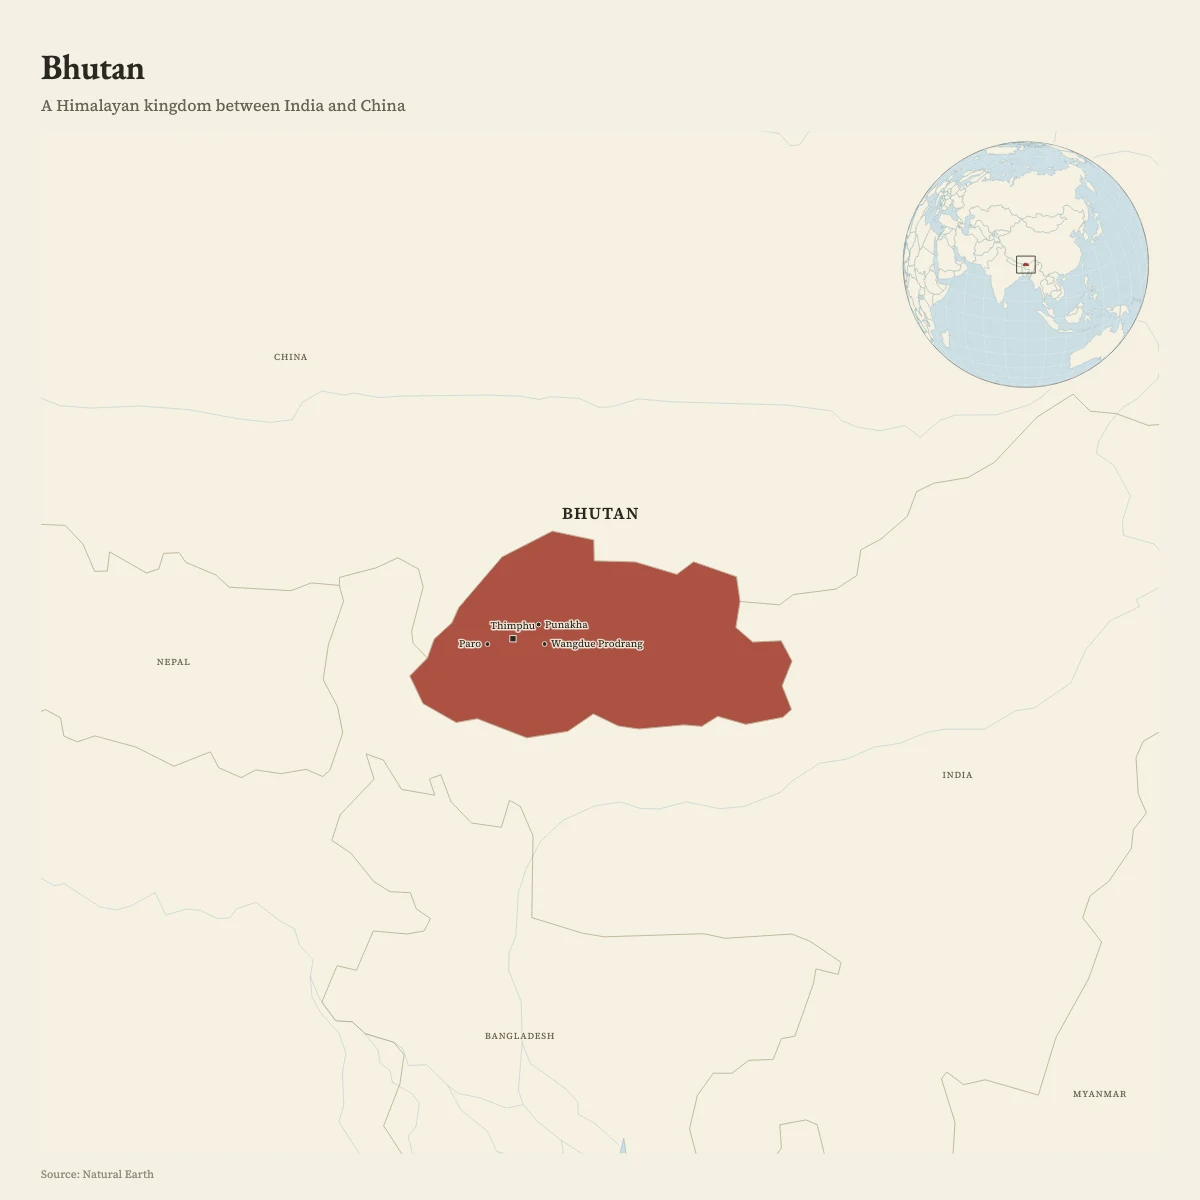 |
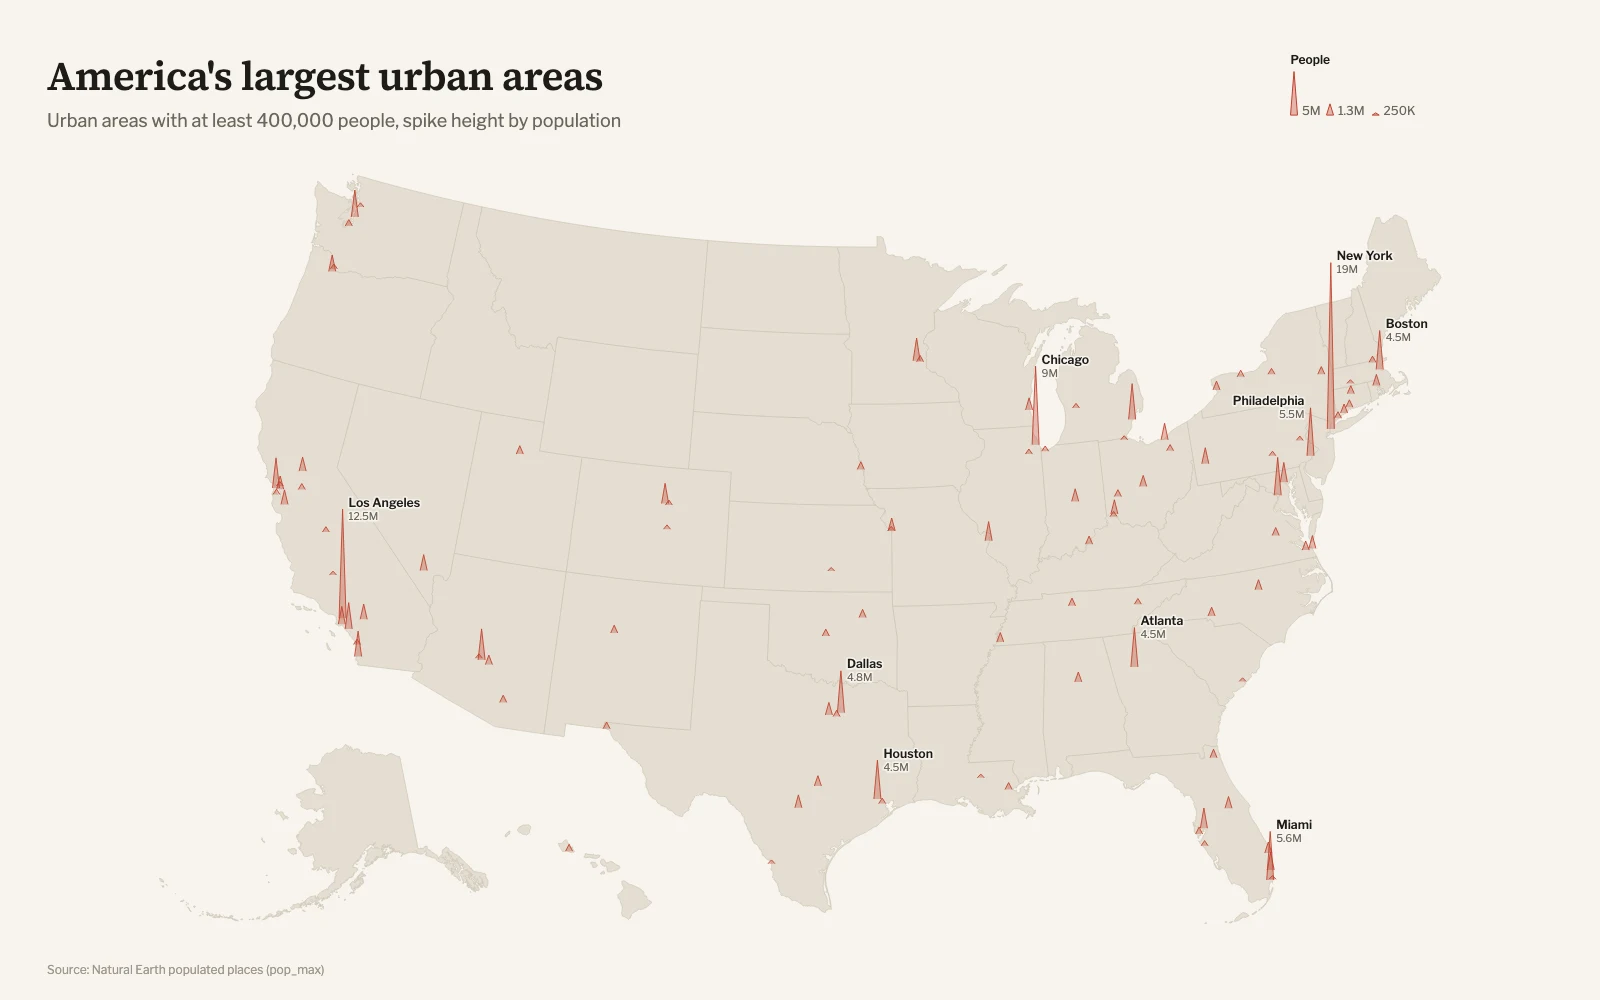
| Spikes on Albers USA · spec | Locator · atlas, with cities and an inset globe · spec |
 |
|
| Flights along great circles from airport codes · spec |
Install
Works with any agent that reads Agent Skills: Claude
Code, Codex, Cursor, Gemini CLI, GitHub Copilot, OpenCode and others.
npx skills add ashishkaloge/map-design
In Claude Code you can also install it as a plugin:
/plugin marketplace add ashishkaloge/map-design
/plugin install map-design@map-design
Or copy skills/map-design/ into your agent's skills folder, for example~/.claude/skills/map-design.
Requirements: Node.js 20 or newer. PNG export uses a Chrome, Edge, Brave or
Chromium you already have, including one installed by Playwright; without one
you still get HTML and SVG, and the HTML page has a PNG button. City posters
and the streets basemap need an
internet connection to fetch OpenStreetMap data as vector tiles. Optional raster
basemaps also download tiles; provider terms and caching differ. See
basemaps.
Use it without an agent
The CLI is the same one the agent runs. Run these from the repository folder
(after git clone https://github.com/ashishkaloge/map-design.git && cd map-design),
or use the full path to map.mjs from anywhere. render writes its files next
to the spec; poster writes them to the folder you run it in.
node skills/map-design/scripts/map.mjs render examples/world-density/spec.json
node skills/map-design/scripts/map.mjs poster --place "Kyoto" --country JPN --theme sumi --radius 3
node skills/map-design/scripts/map.mjs poster --lat 19.0990 --lon 72.8265 --title "Juhu" --theme neon --radius 3 --pin "Juhu Beach"
node skills/map-design/scripts/map.mjs find "Springfield"
node skills/map-design/scripts/map.mjs themes
What it makes
| Kind | For | Example spec |
|---|---|---|
choropleth |
Rates by country, by state or province (251 countries and territories), by US state or US county, or by any areas in your own GeoJSON, TopoJSON or KML: districts, ZIP codes, wards | US population change |
bubbles |
Totals at places, circle area ∝ value | Largest cities |
spikes |
Many values at points, height ∝ value | US urban areas |
points |
Locations, colored by category | spec reference |
route |
Trips, voyages, itineraries, flights by airport code, and GPS tracks from GPX, KML or GeoJSON | HMS Beagle |
flows |
Movement with volume: migration, trade, traffic | spec reference |
locator |
"Where is it?" with context and an inset globe, for a country, region, place or an area from your own file | Bhutan |
poster |
Any city's streets as print art, from OpenStreetMap, with optional labeled pins | Lisbon |
Themes for data maps: paper (default), atlas, ink, antique, swiss, blueprint.
Themes for posters: noir, paper, mono, blueprint, sumi, terracotta, azulejo, neon, forest.
Every map is one SVG with its fonts embedded, so it looks the same in a
browser, a slide or a print shop. The HTML adds hover details that outline the
feature under the cursor (a country and its value, or on posters and street
basemaps a street's name and class, a park's area, or a landmark's estimated
height where available), zoom and pan, and SVG and PNG download buttons.
It makes no network requests.
A spec is short:
{
  "kind": "choropleth",
  "region": "usa",
  "title": "The South and Mountain West grew; New York, Illinois and California shrank",
  "data": "states.csv",
  "join": "fips",
  "value": "change",
  "scale": { "type": "threshold", "breaks": [-1, 0, 2, 4, 6], "palette": "brown-teal", "center": 0 },
  "format": { "suffix": "%" },
  "source": "US Census Bureau, Vintage 2024 population estimates"
}
Full reference: spec.md.
Design guidance the agent follows: cartography.md.
How it works
- Resolve. Every location in the spec is looked up in bundled data:
7,342 cities and towns, 3,244 airports, 242 countries, first-level regions
for 251 countries and territories, and every US state and county. Your own
GeoJSON, TopoJSON, GPX and KML files supply their own geometry. Ambiguities and
misses go into the report. - Join and classify. Rows join to boundaries by code or name. Values are
classed by quantiles, natural breaks, thresholds or a continuous ramp, with
perceptually even palettes. - Project. The renderer picks an equal-area projection that suits the
region, or uses the one you name. - Draw. Base map, data, borders, symbols, labels placed without overlaps,
then the title, legend and source. Only the font faces and character sets
the map uses are embedded. - Export. HTML, SVG and PNG (2×, or 3× for posters: 3600×4800 px, 12×16 in
at 300 dpi).
Posters read streets, buildings, water, parks and rail from OpenStreetMap vector
tiles (the OpenMapTiles schema, served free by OpenFreeMap)
and cache them, so a re-render with the same cached tiles can work offline.
Roads fade by class, blocks fill with building footprints in frames up to about 6 km across, and
whole-city frames up to 60 km wide retain residential roads where the chosen
zoom and detail level include them. If the tile service is
unreachable, posters fall back to one query to the public Overpass API. Car-free
centers such as Venice automatically get footpaths.
The skill is about 9 MB: 8 MB of simplified open data, 0.8 MB of fonts and the
renderer. Bundled vector maps and spec checks work offline. Poster downloads and
requested basemap tiles require network access; generated files are self-contained.
Limits
- Borders follow Natural Earth's de facto view. Disputed areas are drawn the
way Natural Earth draws them, which does not match every government's official
position. See cartography.md. - Small places outside the gazetteer need
lon/lat. - Posters depend on OpenFreeMap's free tile service, which has no uptime
guarantee, with the public Overpass API as the fallback. Every download is
cached. Building footprints come from the tiles, and some sources merge
neighbouring buildings. - Labels are placed greedily. On dense maps some are left out; the report
lists them. - Basemaps are optional:
streetsdraws vector streets in any projection,
and raster presets embed static Mercator tiles. Provider access, attribution and
export requirements apply. No road routing or terrain shading yet. - Your own files must be in longitude/latitude. Shapefiles, GeoPackages and
projected files need converting first (the error prints the command); KMZ
needs unzipping. No boundaries are downloaded for you. - Statistics in
builtin:countriesare Natural Earth's 2019 estimates. For
current figures, give the agent a source to fetch.
Contributing
Bug reports with the spec and the PNG are the most useful thing you can send.
New themes, label placement improvements and gallery examples built on open,
cited data are welcome. See CONTRIBUTING.md.
License
MIT for the code. Bundled data is public domain (Natural Earth, US Census
Bureau, OurAirports). Fonts are under the SIL Open Font License. Posters
contain OpenStreetMap data, © OpenStreetMap contributors (ODbL). Details:
THIRD_PARTY_NOTICES.md.
Reviews (0)
Sign in to leave a review.
Leave a reviewNo results found