cc-calendar
Health Uyari
- License — License: MIT
- Description — Repository has a description
- Active repo — Last push 0 days ago
- Low visibility — Only 7 GitHub stars
Code Gecti
- Code scan — Scanned 12 files during light audit, no dangerous patterns found
Permissions Gecti
- Permissions — No dangerous permissions requested
Bu listing icin henuz AI raporu yok.
Google Calendar-style weekly view of your Claude Code sessions — local, live, read-only
cc-calendar
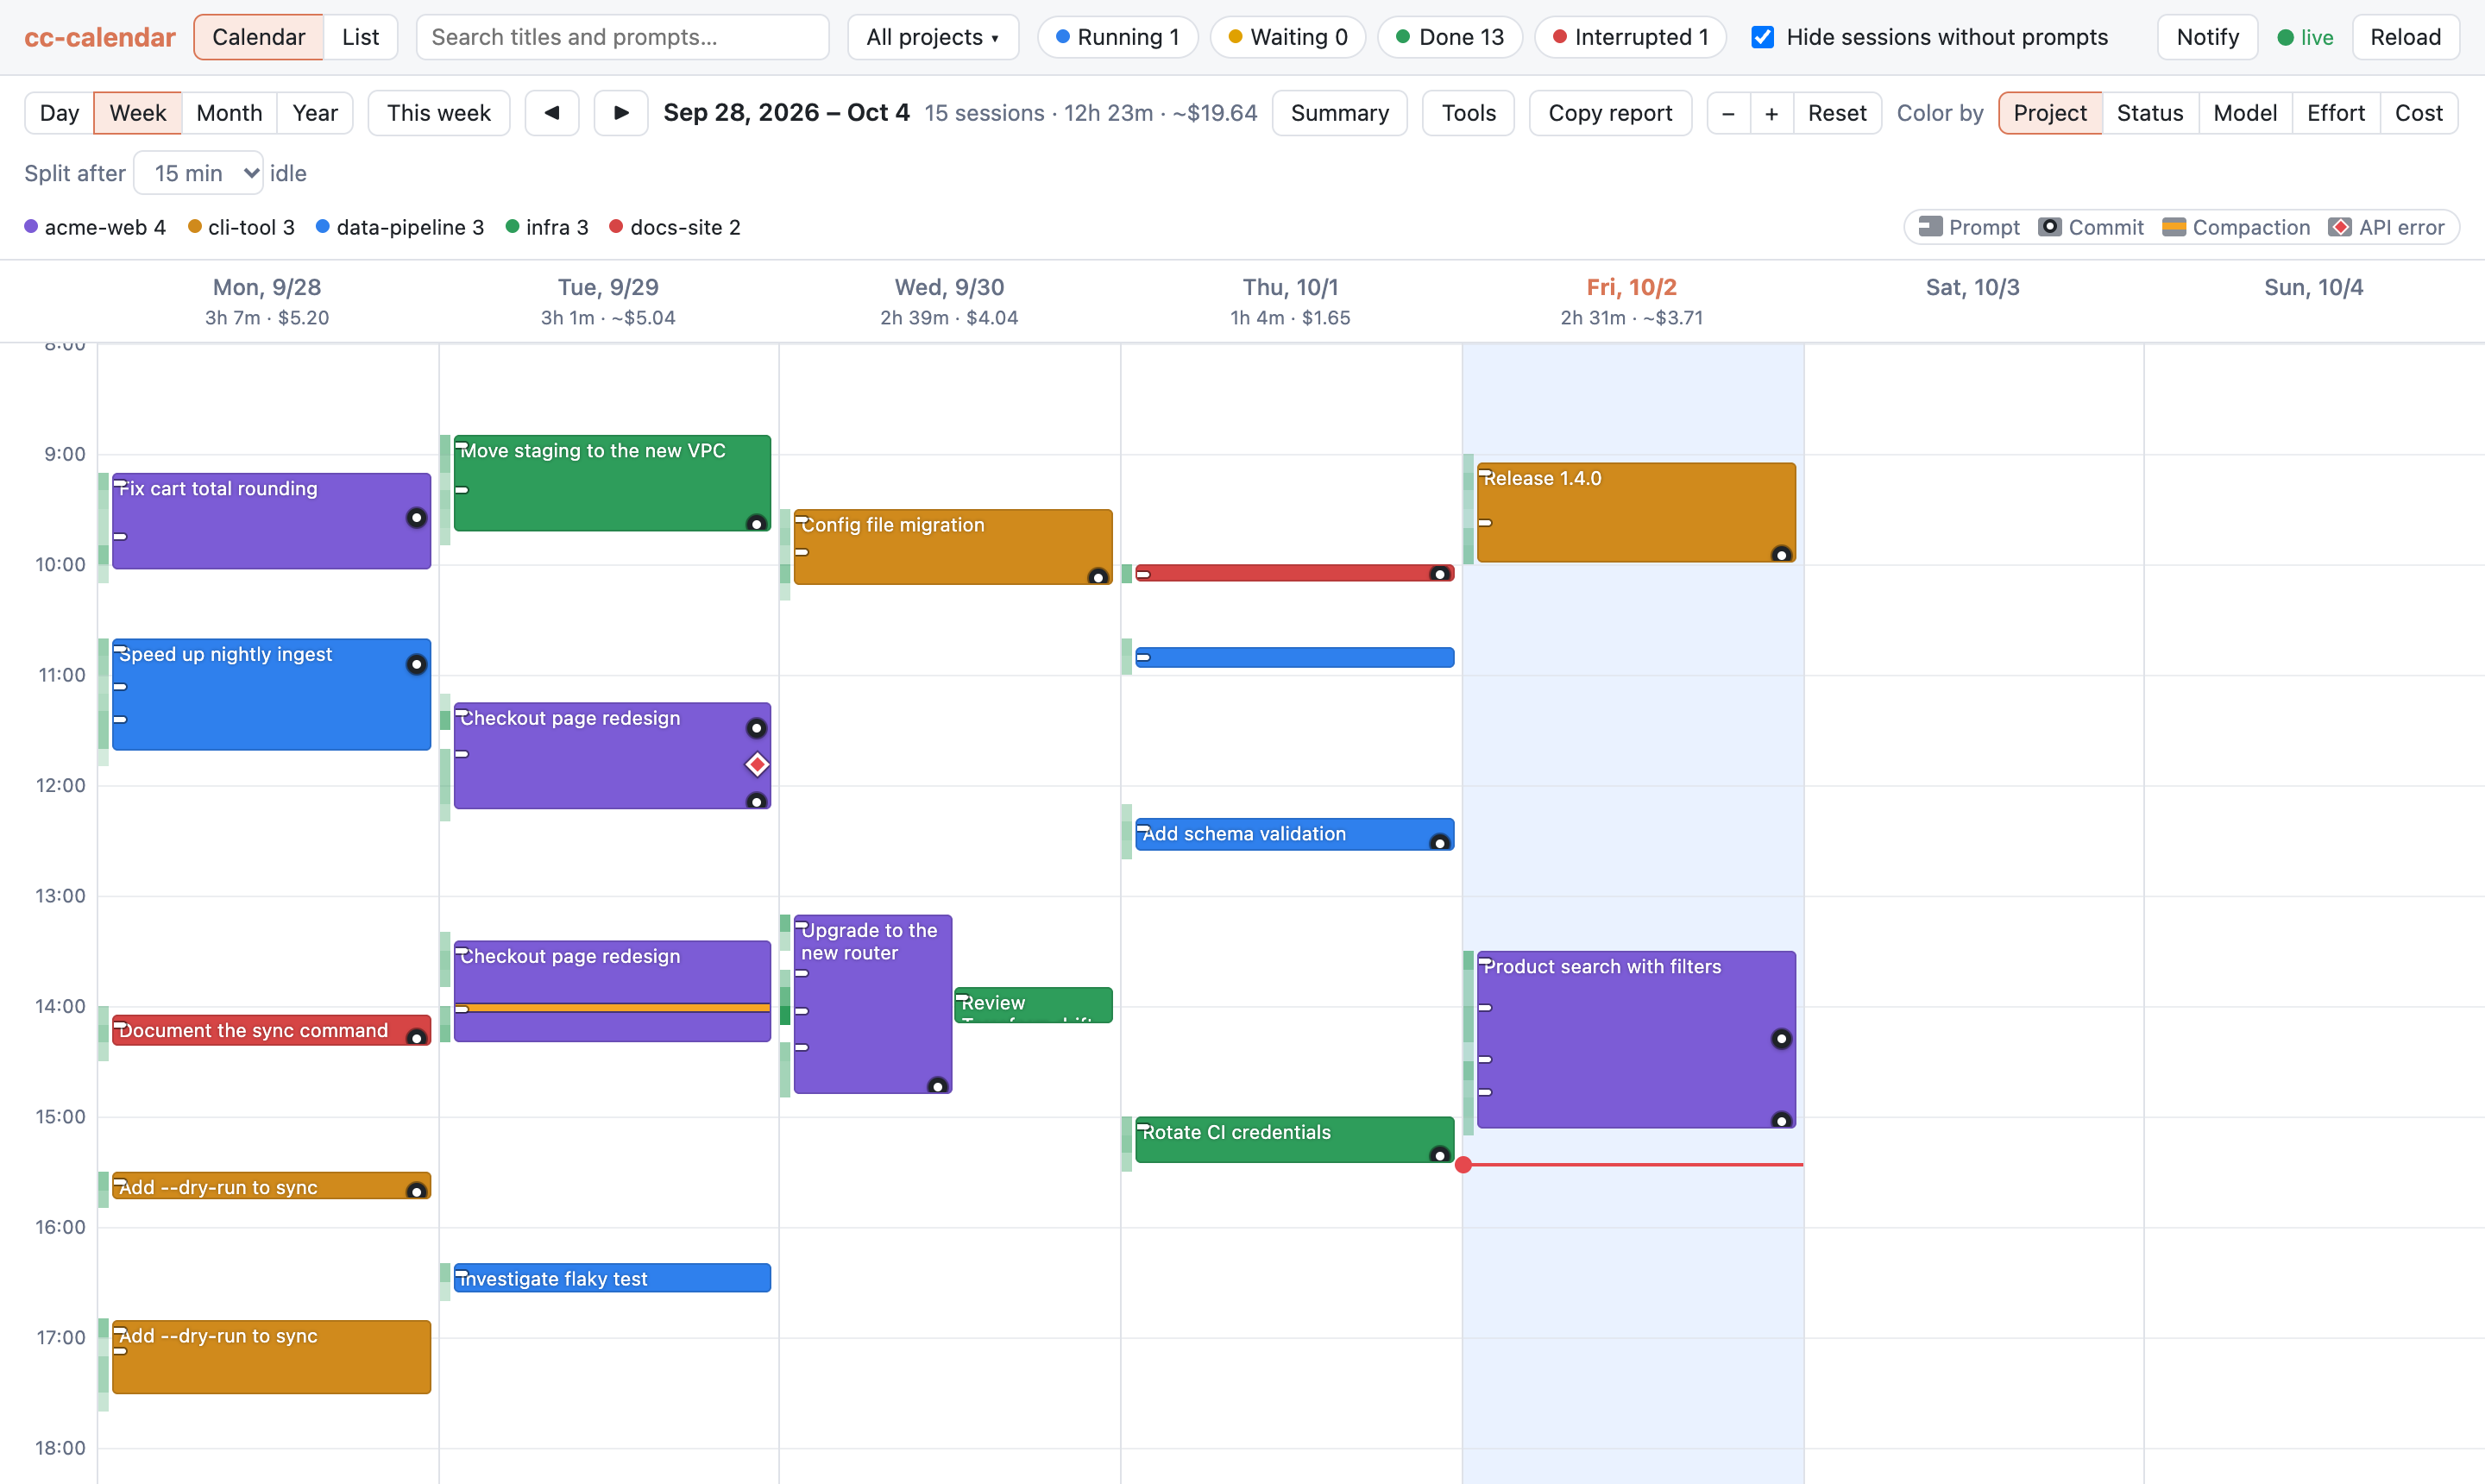
A Google Calendar-style weekly view of your Claude Code sessions.
cc-calendar reads the transcripts Claude Code already writes to ~/.claude/projects/ and shows
when you worked, on what, what it cost, and what came out of it — commits, changed files and pull
requests — in a local web UI that updates live while sessions run.
Project site: https://atinfinity.github.io/cc-calendar/
Install
Requires uv (Python 3.12+ is fetched automatically).
uv tool install git+https://github.com/atinfinity/[email protected]
cc-calendar
Or run it from a checkout:
uv run cc-calendar
The server binds to 127.0.0.1 on a free port and opens your browser.
| Option | Description |
|---|---|
--port N |
Listen on a specific port instead of a free one |
--no-browser |
Do not open a browser window |
--claude-dir PATH |
Read logs from another Claude Code config directory (default ~/.claude) |
Features
- Week and day calendar — each session is drawn as bars covering its active periods; a session is
split wherever it sat idle longer than the chosen threshold (15 minutes by default). Overlapping
sessions sit side by side. Click a date in the week view to open that day on its own. Zoom with
the − / + buttons or Ctrl + mouse wheel. - Month and year views — a month calendar and a GitHub-style yearly heatmap, one cell per day
shaded by active time or cost (switch with "Shade by"). Month cells list the day's busiest
projects; the year view adds per-month totals. Click a day to open it in the day view, or a
month total to open that month. - Time and cost totals — each date shows that day's active time and cost, and the Summary
table breaks the displayed range down by project. Active time is the drawn bars; a session's cost
is split across days by when its requests ran. Totals follow the current filters. - Markdown report — "Copy report" copies the displayed day, week, month or year as Markdown:
active time and cost per project, each session's title and the commits made in the range. Ready
to paste into a standup note or a daily report; it follows the current filters. Issue and PR
numbers such as#12become links to the repository'soriginremote. - Tool usage — the Tools pane aggregates tool calls in the displayed range: most used tools,
error counts and rates (10% or more is highlighted), calls made inside subagents, MCP servers,
and subagent runs by type with their tool calls, tokens and cost. It follows the current filters. - Cache efficiency — each session shows its cache hit rate (cache reads as a share of input
tokens) and roughly how much caching saved. Sort the list by Cache to find sessions with poor
reuse; rates below 90% are highlighted (Claude Code usually reuses well over 90%). - Event marks — marks on each bar show when prompts, commits, compactions and API errors
happened, and the tooltip counts them for that block. Click a mark (or a request or commit time
in the detail pane) to open the transcript at that point; the transcript has ‹ › buttons to step
through each kind of event. Click the key next to the legend to hide the marks. - Activity density — a heat strip behind each day shows prompts and responses per 10 minutes.
- Colors by project, status, model, effort (the level most requests ran at) or cost
(< $1 / $1–5 / $5–20 / $20–50 / ≥ $50). - Effort and compactions — the detail pane and transcript stats show the share of requests
per effort level, and each compaction shows its trigger and context size before → after
(e.g.auto · 168k → 32k tokens) in the mark tooltip, the transcript and the detail pane. - Status — Running and Waiting for live sessions, Done or Interrupted for finished ones, with
the underlying checks (turn ended, no background work left, clean exit, working tree clean). - Notifications — turn on "Notify" in the top bar to get a desktop notification when a live
session goes from Running to Waiting for your input, or ends Interrupted, while the tab is in the
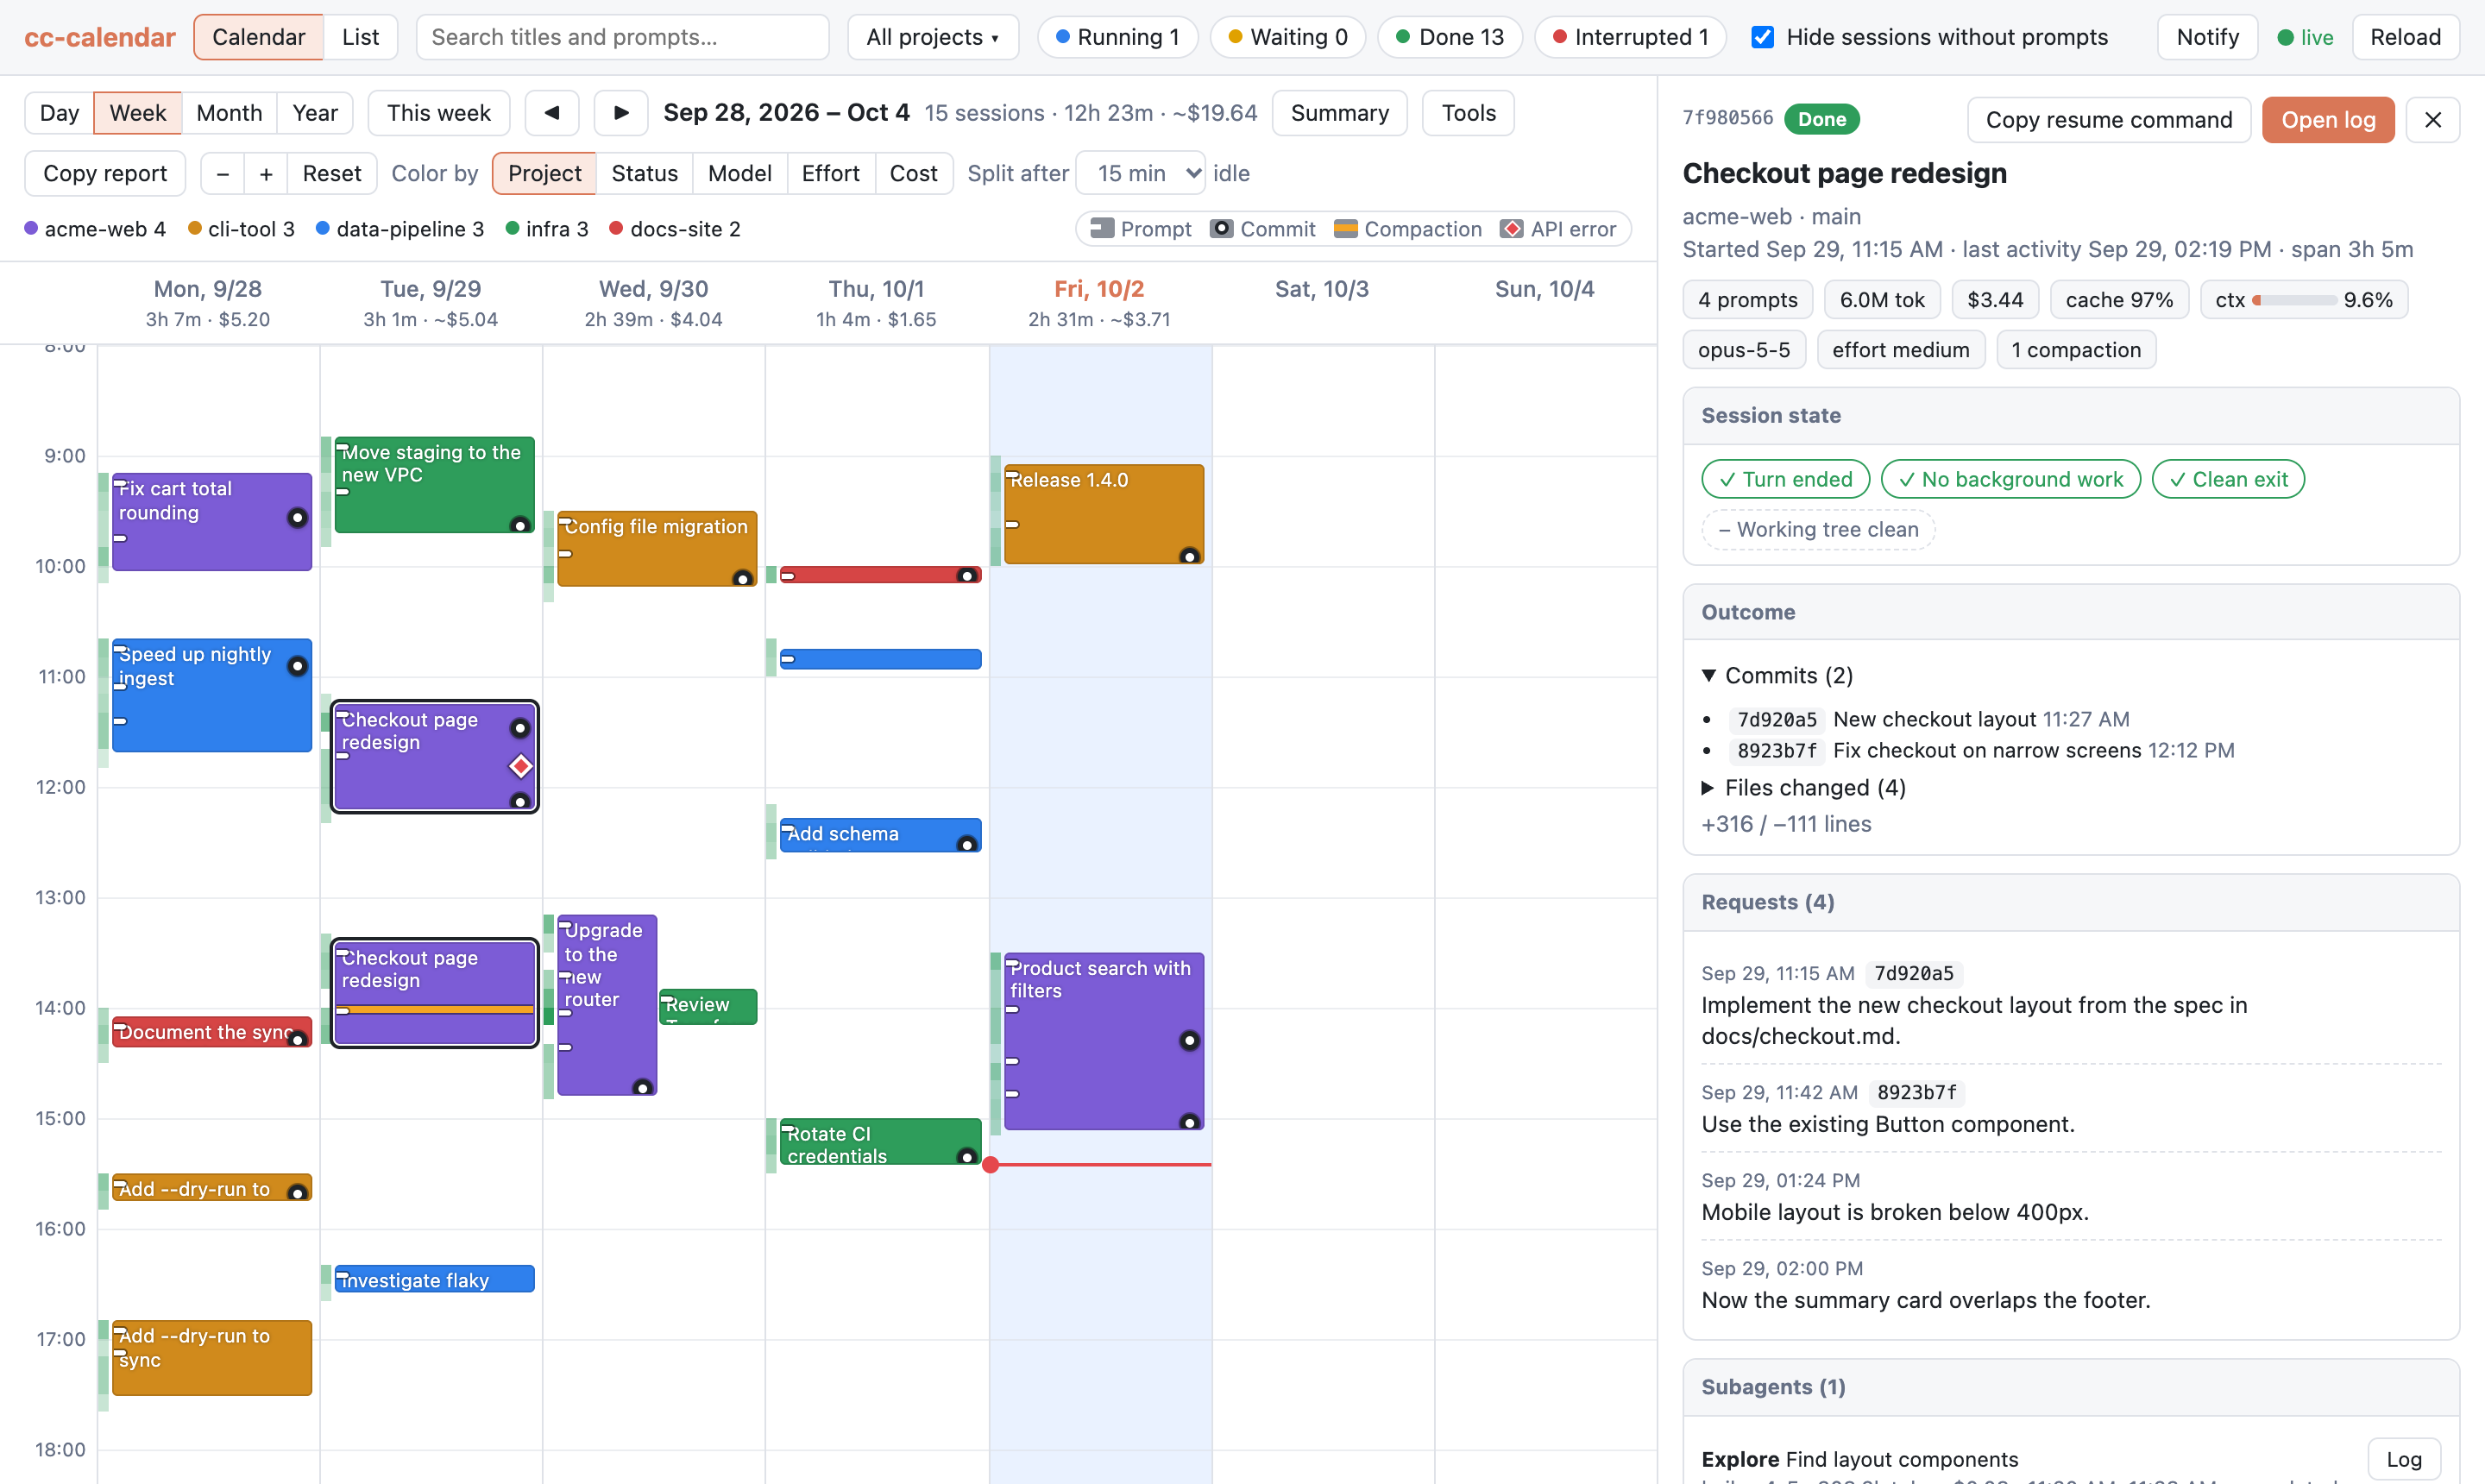
background. Off by default; clicking the notification opens the session. - Detail pane — tokens, cost, context usage, every request you made with the commits that
followed it, files changed, pull requests, subagents and background tasks, and links between
a session and the one it was continued in. - Resume — "Copy resume command" in the detail pane copies
cd <project dir> && claude --resume <session id>, so you can pick a session up again from a
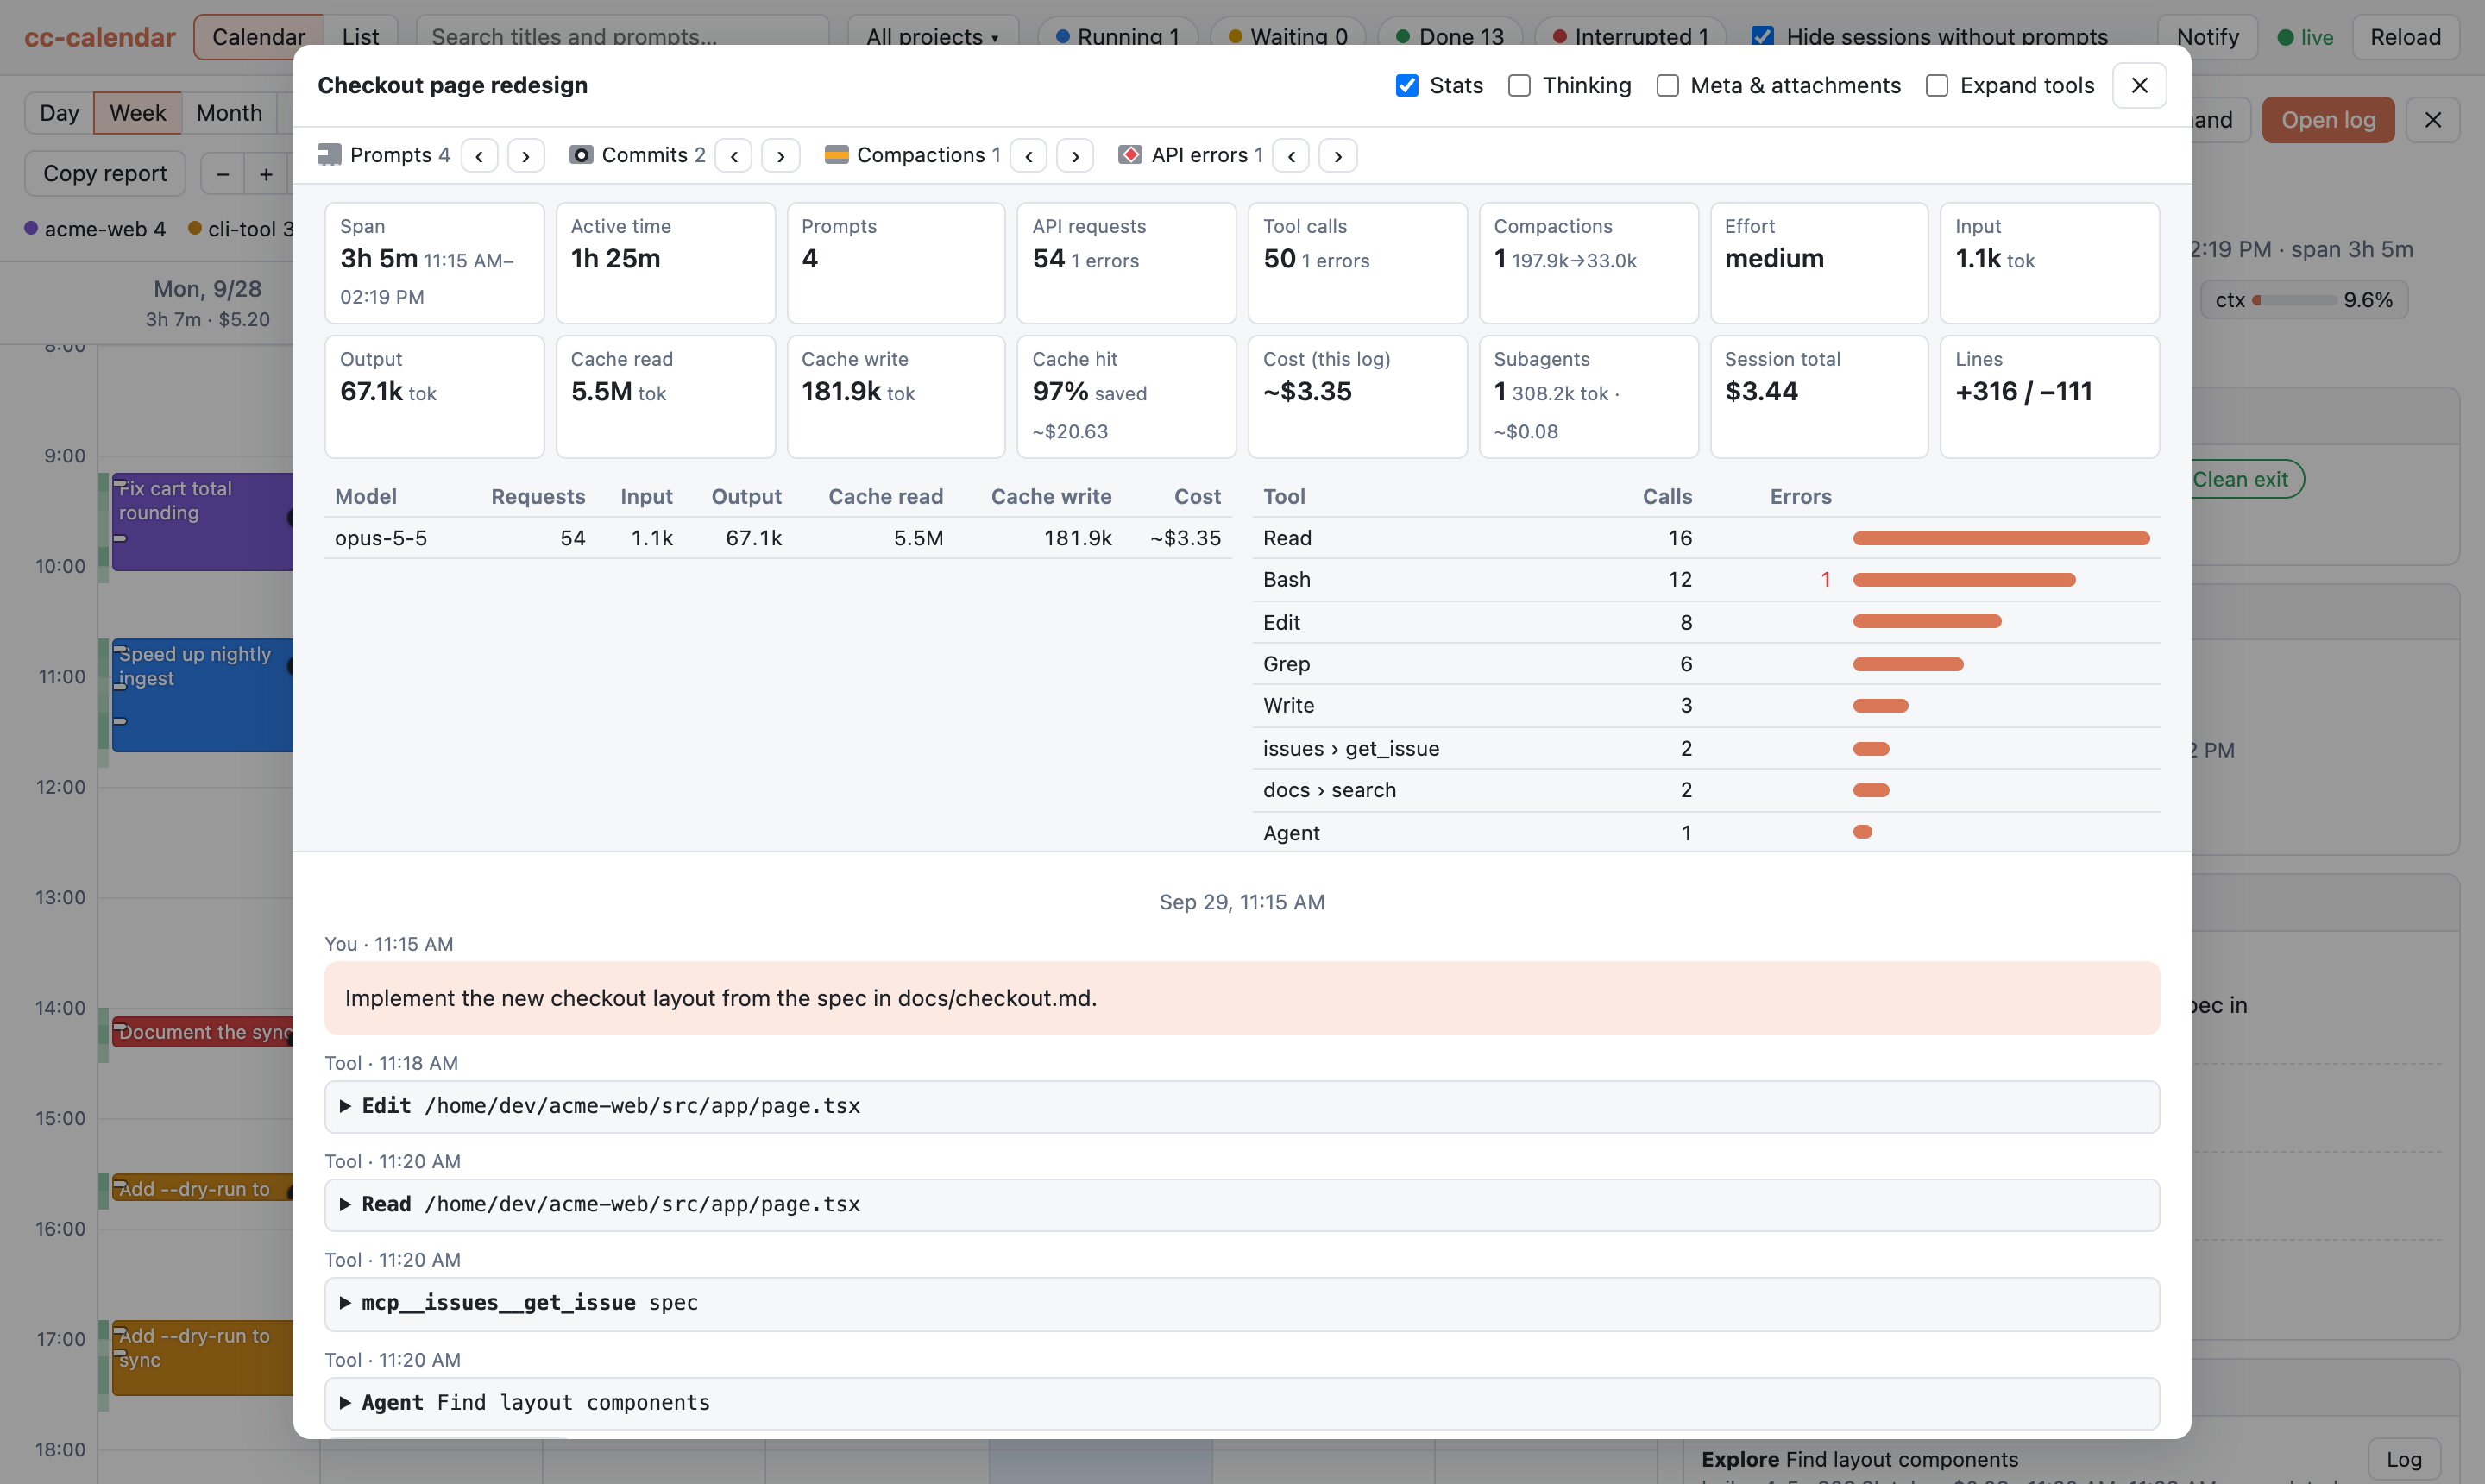
terminal. - Transcript viewer — Markdown rendering, collapsible tool calls, optional thinking and
metadata, drill-down into subagent transcripts, and a stats panel per transcript (active time,
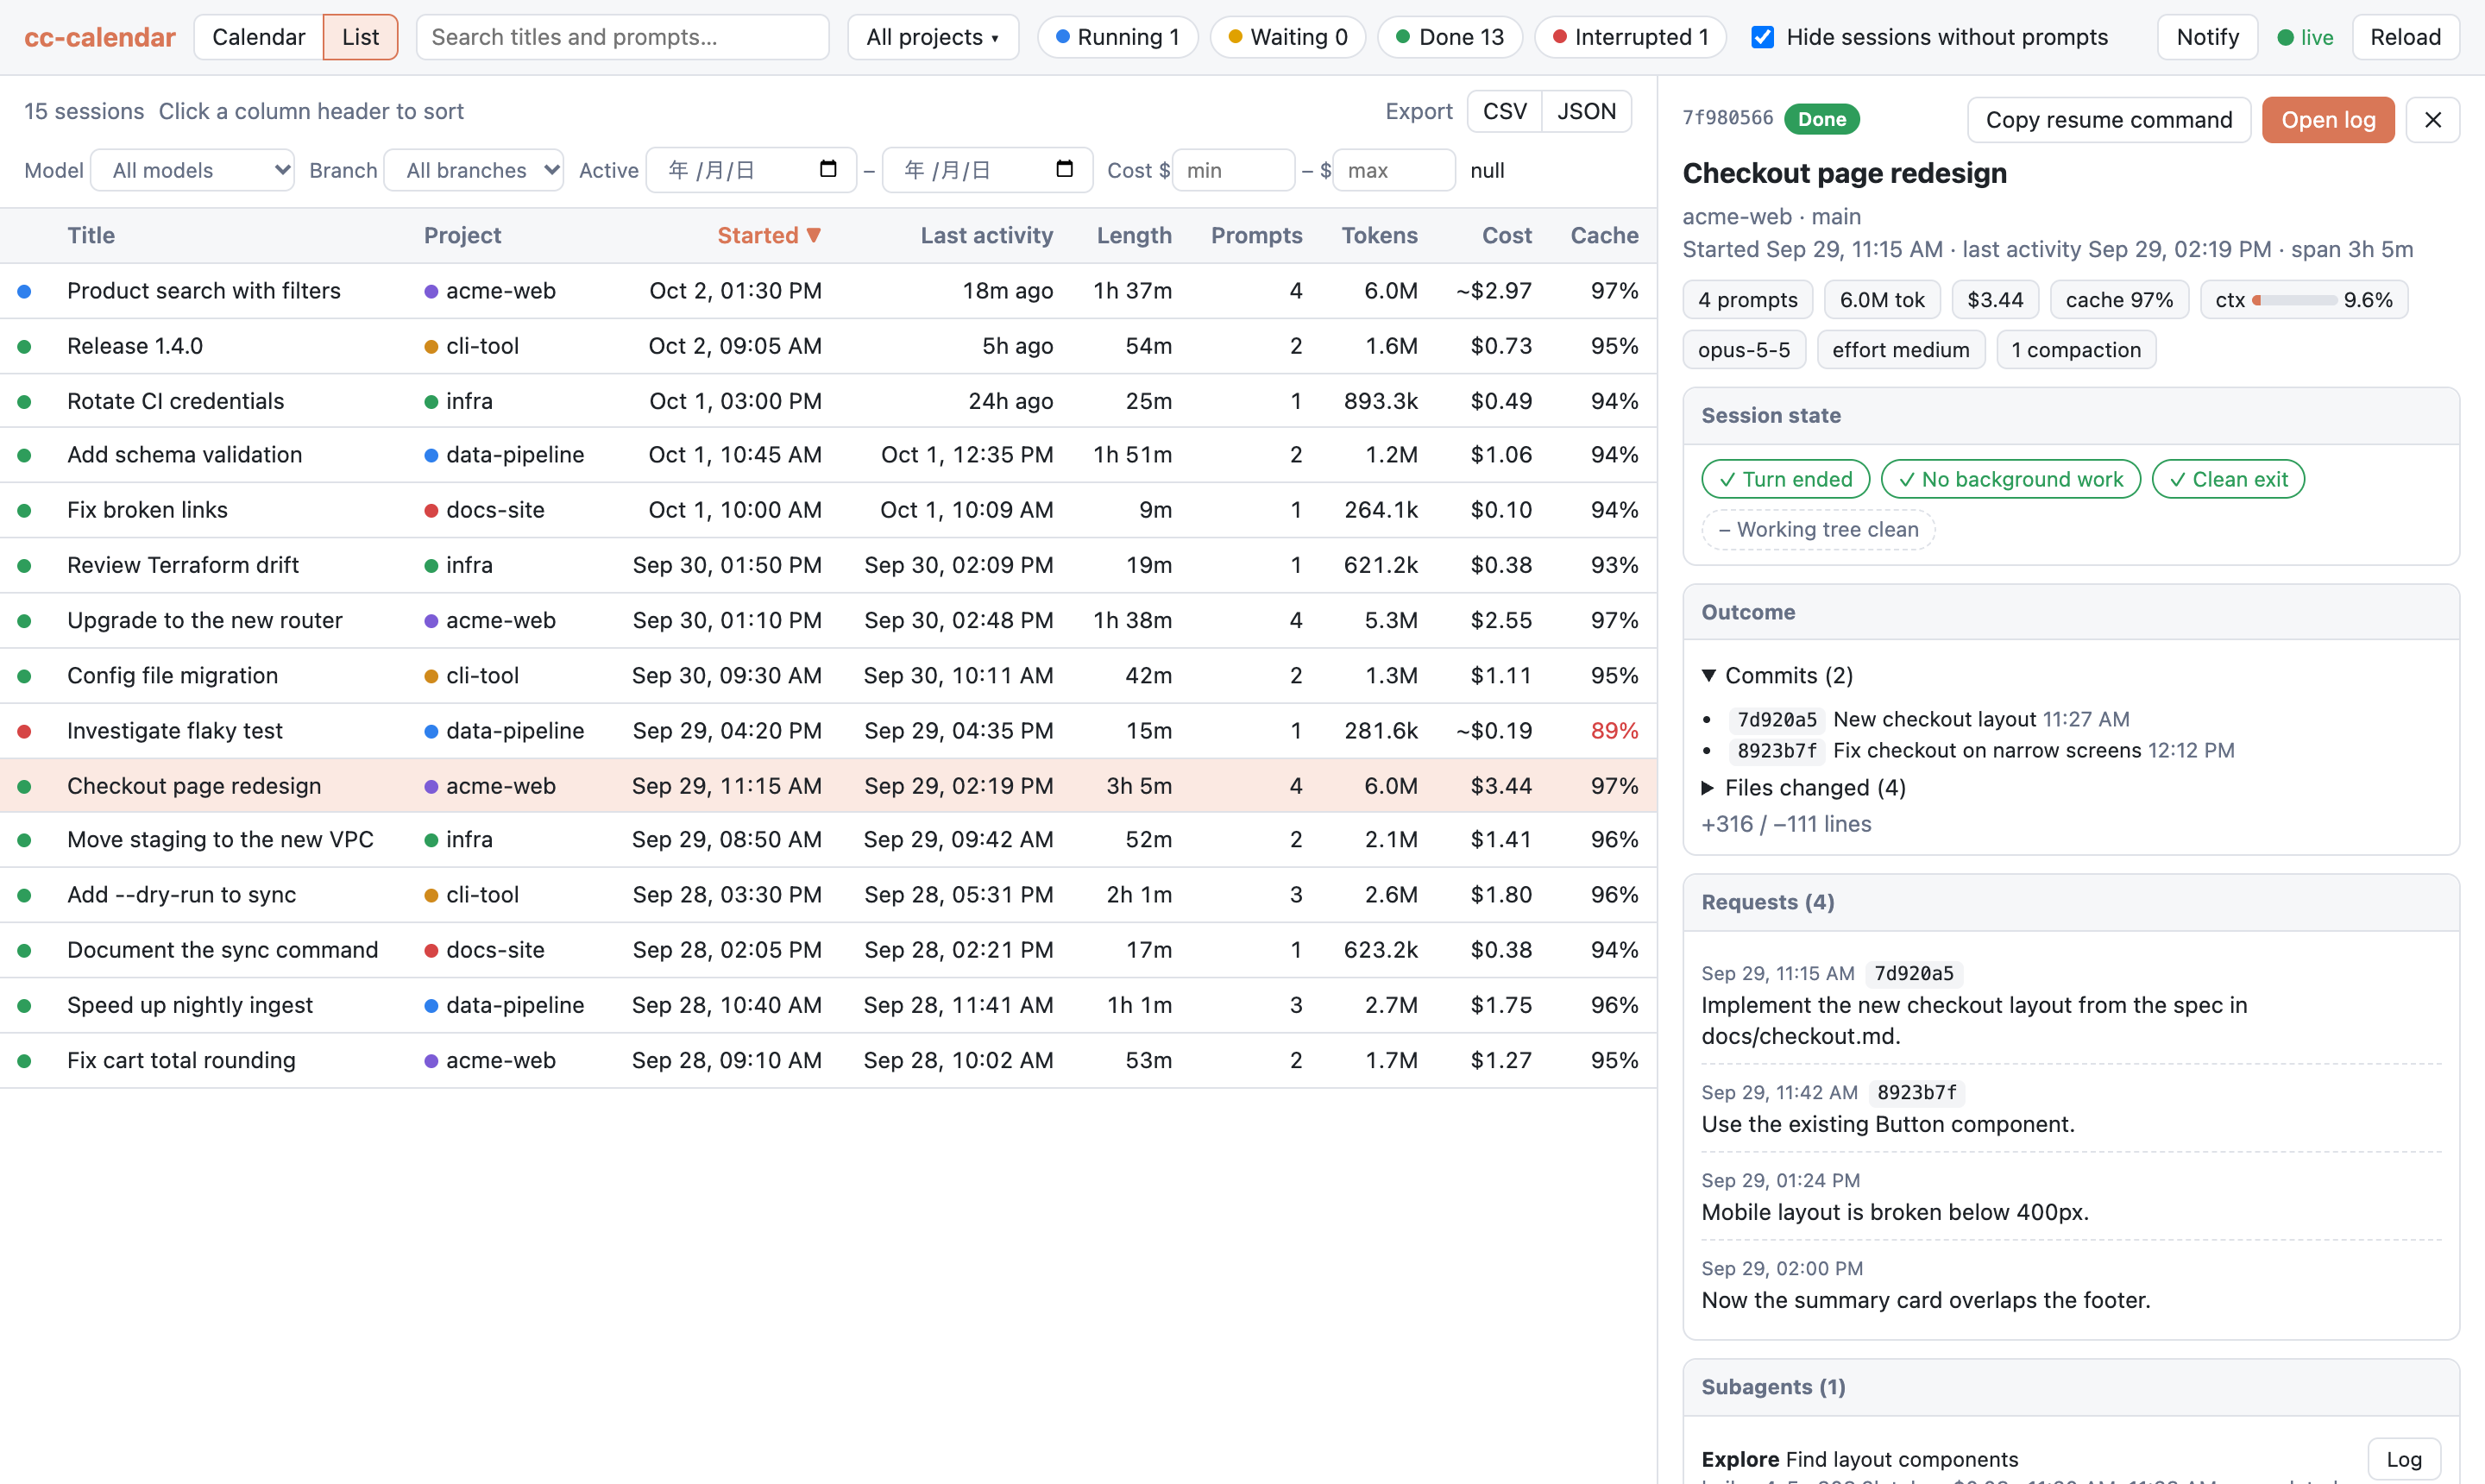
requests, tokens and cost by model, tool calls and errors by tool). - List view with search over titles and prompts (a match inside a prompt is shown under the title), project and status filters, and sorting by
any column (click a header; click again to reverse). List-only filters narrow it down further
by model, git branch, date range (sessions active on any day in the range) and cost range. - Project page — click a project name (in the list, the Summary table, the detail pane or the
project menu) to see the project over all time: total active time and cost, activity by month,
every session, and its commit history with links to the repository. - Export — download the sessions shown in the list view as CSV or JSON, in the current filter
and sort order: start, end, active time, project, branch, status, prompts, tokens, cost, cache hit
rate, model, effort, Claude Code version and commit count. Times are ISO 8601 with your UTC
offset. See the export format. - Live updates — new log lines are picked up within a second.
| Session detail | Transcript with stats |
|---|---|
 |
 |
| List view | Month view |
 |
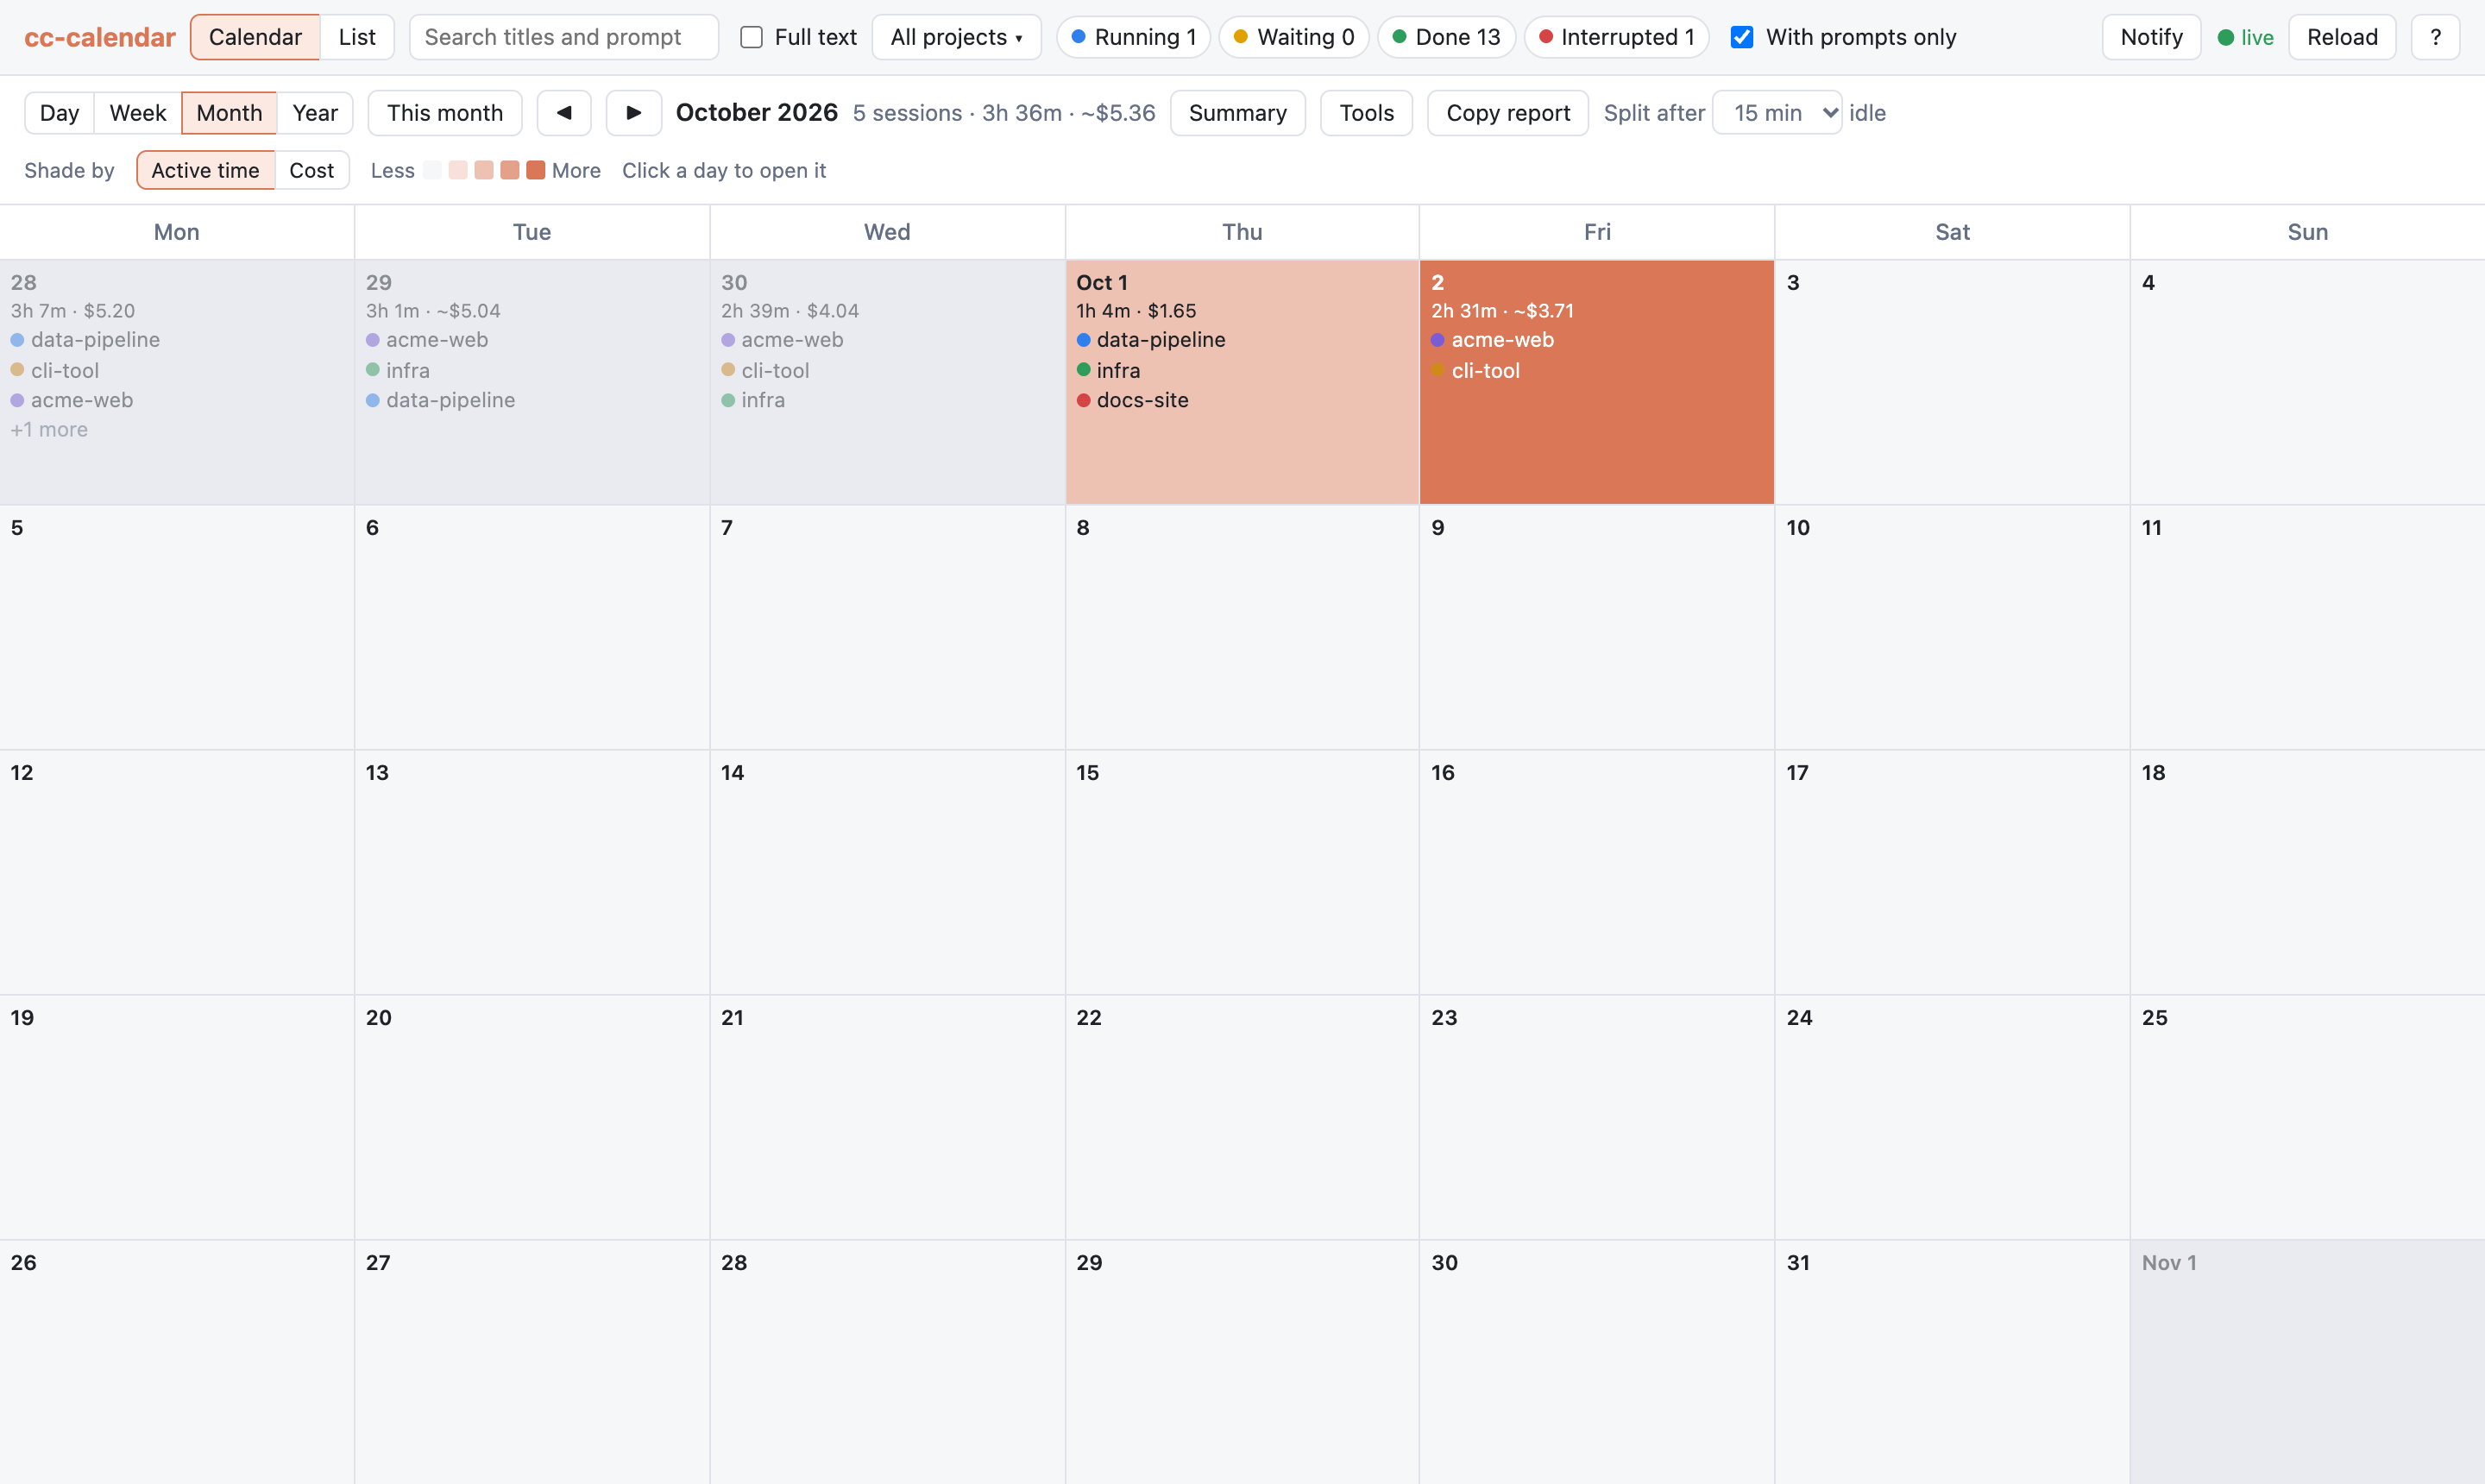 |
Screenshots show fictional demo data.
Cost comes from Claude Code's own cost record when the session wrote one. Otherwise it is estimated
from token usage and a built-in price table, and shown with a ~ prefix.
Treat all costs as rough figures, not billing data. The price table insrc/cc_calendar/pricing.py uses Anthropic API list prices as of when it was last updated. It does
not know about subscription plans, discounts or price changes. Models missing from the table count
as $0, so it needs updating when new models ship.
Privacy
Everything stays on your machine. The server listens only on localhost, reads your logs read-only,
keeps its index in memory, and makes no network requests. Commit hashes that do not appear in the
logs are looked up with git log in the session's working directory.
Development
uv sync
uv run pytest
uv run ruff check . && uv run ruff format --check .
The frontend is plain HTML, CSS and ES modules in src/cc_calendar/static/ — no build step.
Tests use synthetic logs only; never commit real transcripts.
The README screenshots are rendered from fictional data generated by scripts/demo_data.py, using
your installed Google Chrome:
uv run --with playwright python scripts/screenshots.py
The project site is built with Zensical from docs/ and zensical.toml,
and deployed to GitHub Pages on every push to main. Preview it locally:
uv run --group docs zensical serve
Acknowledgements
Inspired by the tool shown in this post by @tokkyo.
This is an independent reimplementation and is not affiliated with the original.
License
MIT. Bundles marked (MIT) and
DOMPurify (Apache-2.0 / MPL-2.0).
Yorumlar (0)
Yorum birakmak icin giris yap.
Yorum birakSonuc bulunamadi