AgentProvenance
Health Gecti
- License — License: Apache-2.0
- Description — Repository has a description
- Active repo — Last push 0 days ago
- Community trust — 12 GitHub stars
Code Basarisiz
- rm -rf — Recursive force deletion command in scripts/accept_batch_forensics.sh
- rm -rf — Recursive force deletion command in scripts/accept_daemon_evidence_api.sh
Permissions Gecti
- Permissions — No dangerous permissions requested
Bu listing icin henuz AI raporu yok.
Local-first provenance & security control plane for sandboxed agents: correlate agent context with system telemetry (own eBPF sensor + Falco/Tetragon) into a verifiable, signable causality graph — risk gating, diff/blame, replay, forensics. CLI · daemon · MCP · web dashboard.
AgentProvenance
Correlate application context with system telemetry into a verifiable, signable causality graph for sandboxed agents.
Correlate application-side agent context with system-side telemetry, then turn
runtime evidence, file diffs, artifacts, risk signals, and response decisions
into a queryable, replayable, and auditable causality graph. Evidence is stored
content-addressed and hash-verified (a model borrowed from Git) and can be
signed for tamper-evidence -- but this is an audit/provenance layer, not a
version-control system: there is no merge, checkout, or mutable working tree.
![]()
![]()
![]()
![]()


AgentProvenance is a local-first security and provenance control plane for
autonomous, tool-using agents, especially sandboxed coding agents. It captures
system telemetry from its own eBPF sensor (or ingests Falco/Tetragon),
correlates it with app-side agent context into a verifiable, signable causality
graph, and serves that graph over the CLI, a daemon API, AI tools (including an
MCP server), and a local web dashboard.
It is not a generic sandbox runtime, generic telemetry collector, Kubernetes/Ray
replacement, RL trainer, trace dashboard, or version-control system (it borrows
Git's content-addressing and verification model, not its branch/merge workflow).
It owns a narrower primitive:
Execution Context
  -> Evidence Ingest
  -> Runtime Causality Graph
  -> Provenance DAG
  -> State Diff / Blame / Artifact Lineage
  -> Security Analysis / Risk Decision
  -> Taint / Response Action
  -> Replay / Forensics / Audit Manifest
The goal is to answer questions ordinary traces do not answer well:
- Which snapshot did this execution start from?
- Which attempt produced this artifact?
- Which tool call started this process?
- Which child process caused this runtime event?
- Which process changed this file?
- Which behavior is anomalous for this agent or task profile?
- Which execution branch was tainted, quarantined, interrupted, or blocked by
a response gate? - Which evidence supports a risk decision?
- What response action should be triggered: audit, deny, kill, quarantine,
taint, export forensics, or notify a human through Feishu/DingTalk? - What exact behavior evidence, deviation signal, and risk context should an
external evaluator, RL pipeline, or human reviewer inspect? - Can this execution be diffed, blamed, verified, replayed, and audited later?

Contents
- Why
- Security Loop
- Core Model
- Relationship To Existing Systems
- Quickstart
- Deployment Modes
- Security Evidence Commands
- External Evaluator Protocol
- Compliance Evidence, Not Certification
- AI-Callable Evidence Tools
- Web Dashboard
- Graph Commands
- Current Capability
- Core Demo Acceptance
- Architecture
- Substrate Signals
- Boundaries
- Repository Layout
- Roadmap
- Development
Why
Modern agent execution is not one prompt and one tool call. Coding agents and
autonomous workflows fork attempts, edit files, run tests, create artifacts,
spawn subprocesses, touch external systems, and trigger runtime telemetry.
Logs, traces, metrics, and sandbox events each capture pieces of that story,
but they rarely produce a Git-like causal record of execution state.
AgentProvenance turns sandboxed execution into a security-oriented evidence
graph:
base snapshot
  -> attempt
  -> execution context
  -> tool_call
  -> process / child process
  -> runtime_event
  -> file_diff / artifact
  -> baseline feature / risk signal
  -> taint / response action
  -> replay / forensics / audit manifest
The primary path is recording and explaining sandboxed agent execution. The
branch-heavy coding-agent script is only a stress demo: it creates many
branches, artifacts, runtime events, and risk cases quickly enough to exercise
the graph. AgentProvenance does not choose the reward winner. It emits
structured trajectory evidence and expectation-deviation signals so an external
evaluator or training pipeline can turn them into reward, penalty, filtering,
or human-review decisions.
For RL pipelines, the useful primitive is not "best-of-one" or automatic winner
selection. The useful primitive is observability over each trajectory: what the
agent did, which subprocesses and files were touched, which network/runtime
events appeared, which behavior violated safety or task expectations, and which
risk/baseline signals should contribute to reward shaping or rejection.
Security Loop
The security model is intentionally simple and concrete:
application context
  run / session / attempt / tool_call / user / task / workspace

system telemetry
  process / file / network / resource / sandbox / eBPF event

correlation
  container_id / cgroup_id / pid / ppid / cwd / timestamp / file diff

security analysis
  behavior baseline / suspicious event / taint lineage / risk decision

response
  audit / deny / kill / quarantine / taint / forensics / Feishu or DingTalk notification
This makes AgentProvenance closer to an AI-era HIDS/control-plane layer than a
pure LLM trace dashboard. Traditional host monitoring asks "what did this
process do?" AgentProvenance adds the agent execution context needed to ask
"which agent/tool/task caused it, what state did it change, what evidence proves
it, and what response should happen?"
The project currently implements the evidence graph, runtime correlation,
diff/blame, telemetry batch manifests, policy decisions, normalized risk
signals, baseline deviation records, response action records, taint,
quarantine, and forensics/export foundations. Deeper eBPF receivers and
Feishu/DingTalk response adapters belong to the next security-control phases.
Core Model
AgentProvenance supports two context modes.
White-box mode
An agent harness, SDK, tool router, or framework explicitly provides context:
run_id / session_id / attempt_id / tool_call_id / tool_name / args_hash
This gives high precision and fits custom coding-agent systems, Agentix-style
harnesses, LangGraph-like workflows, and internal tool routers.
Zero-SDK mode
The user can run an agent command directly:
agentprov record -- <agent command>
The current MVP records a command in a working directory, snapshots the
pre-execution file state, runs the command, computes post-execution file
changes, and emits runtime file evidence into the DAG. The long-term zero-SDK
path adds deeper process-tree and kernel telemetry capture.
Zero-SDK inference uses runtime facts:
root process / process tree / cwd / timestamp / container_id / cgroup_id
  / file diff / artifact refs
Raw system-side telemetry should not be required to carry tool_call_id.
Kernel and runtime signals usually know PID, cgroup, namespace, container ID,
timestamp, and process tree. AgentProvenance correlates those substrate facts
back to execution context.
Today, the CLI exposes the underlying binding primitive:
agentprov telemetry bind --run <run_id> --session <session_id> \
  --attempt <attempt_id> --tool-call <tool_call_id> --process <process_id> \
  --container-id <container_id> --cgroup-id <cgroup_id> --pid <pid>
Then raw events can be ingested without tool_call_id:
agentprov telemetry ingest --raw-event raw-execve-1 --pid <pid> \
  --timestamp <event_time> --source tetragon_jsonl --type execve \
  --payload '{"argv":["./async_child.sh"]}'
agentprov telemetry ingest-jsonl --format tetragon --file tetragon-events.jsonl
agentprov telemetry ingest-jsonl --format native --file agentprov-sensor-events.jsonl
agentprov telemetry ingest-falco --file falco-events.jsonl
ingest-jsonl records a telemetry batch manifest with the input file hash,
mapped event IDs, event ID hash, receiver summary, and row-level mapping
results. By default it also evaluates runtime policy for ingested events, so
metadata-IP, private-CIDR, and secret-path rows become policy_decisions,risk_signals, response_actions, graph edges, and timeline rows. Use--no-policy when the receiver should only normalize and store telemetry. This
gives the DAG an audit handle for external Falco/Tetragon/LoongCollector
evidence without turning AgentProvenance into a long-term log store.
The native format is the receiver for AgentProvenance's own eBPF sensor
(cmd/agentprov-sensor, source="agentprov_ebpf"), and is auto-detected. This
closes the consume-only gap: the sensor's normalized kernel events (execve,
network connect classified into metadata_ip/private_cidr, file writes with
their real absolute host paths) flow through the identical correlation, policy,
risk, and unified-signal path as third-party telemetry. Raw file telemetry now
accepts absolute host paths (e.g. a write to /home/agent/.aws/credentials),
which the policy path rules still catch; only the workspace file-node graph keeps
its relative-path constraint. scripts/accept_native_sensor_risk.sh proves the
loop end to end (own kernel telemetry to a unified security signal).
ingest-falco is the Falco-compatible receiver path. It reads Falco JSON/stdout
from a file or stdin stream, maps recognized execve, open/openat, andconnect events into normalized runtime events, correlates them by
PID/container/cgroup/time evidence, and then evaluates policy by default.
Raw Falco rows do not need tool_call_id; ToolCallScope is recovered from the
binding table when possible.
Relationship To Existing Systems
AgentProvenance is designed to coexist with system-level observability projects,
LLM tracing systems, and sandbox runtimes.
| System category | What it owns | How AgentProvenance differs |
|---|---|---|
| system observability | low-intrusion system-side capture, eBPF/runtime event collection, cross-process visibility | AgentProvenance treats those events as evidence input, then builds a Git-like causality/provenance DAG, diff/blame, taint lineage, risk decision, forensics, and response-control surface |
| OpenTelemetry / LLM trace platforms | spans, logs, metrics, LLM/tool traces, dashboards, latency/cost views | AgentProvenance focuses on state provenance, artifact lineage, sandbox runtime effects, security decisions, replay, and audit manifests |
| HIDS / EDR / runtime security | host/process/file/network detection and enforcement | AgentProvenance adds agent context: run/session/attempt/tool_call, snapshot lineage, file diffs, artifact provenance, risk signals, baseline deviations, and response gates |
| Sandbox runtimes | isolation, process/container/VM execution, filesystem and network boundaries | AgentProvenance consumes sandbox identity and telemetry; it does not try to replace Docker, OpenSandbox, gVisor, Firecracker, Kata, or Kubernetes |
So the differentiation is not "another zero-SDK eBPF observer." The narrow
primitive is:
system-side telemetry + application-side agent context
  -> evidence DAG
  -> security analysis and risk judgment
  -> automated response and audit trail
Quickstart
Prerequisites:
- Go 1.23+
- Docker Desktop or a compatible Docker daemon
git clone https://github.com/ByteYellow/AgentProvenance
cd AgentProvenance

go build ./cmd/agentprov

mkdir -p /tmp/agentprov-record-demo
printf 'value = 1\n' > /tmp/agentprov-record-demo/app.py
./agentprov record --run run-record-demo --workdir /tmp/agentprov-record-demo -- \
  sh -lc 'printf "value = 2\n" > app.py && echo artifact > artifact.txt'
./agentprov observe summary --run run-record-demo
./agentprov graph explain --run run-record-demo --file app.py

./agentprov adapter list
./agentprov adapter inspect filtered-jsonl --json
./scripts/demo_telemetry_jsonl.sh
./agentprov telemetry batches --run run-telemetry-jsonl-demo
./agentprov timeline --run run-telemetry-jsonl-demo
./agentprov timeline --run run-telemetry-jsonl-demo --view causality
./agentprov timeline --run run-telemetry-jsonl-demo --json
./scripts/accept_phase1.sh
The quick path builds agentprov, records a command, explains the changed file,
ingests filtered substrate telemetry, and runs the Phase 1 acceptance gate.observe summary is the run-level observability entry point: it summarizes
application context, runtime telemetry coverage, risk, baseline, response, and
top evidence refs before you drill into timeline or graph queries.
demo_telemetry_jsonl.sh is the minimal substrate telemetry path. It binds a
ToolCallScope, ingests Tetragon/Falco/LoongCollector fixture JSONL fromexamples/telemetry/, lists normalized events, and explains how one substrate
event entered the DAG.
accept_phase1.sh is the machine-checkable gate for the current MVP.
timeline is the execution timeline surface. It merges
application context, runtime telemetry, evidence, policy decisions, risk
signals, baseline deviations, response actions, and external effects into one
time-ordered view. --view causality groups rows into agent context, runtime
process, runtime telemetry, evidence, risk/policy, and external-effect lanes,
with correlation status and drill-down commands. The JSON output is designed to
feed a future UI.
Deployment Modes
AgentProvenance is intentionally usable in three deployment shapes. RL,
benchmark, and evaluator users should start with the first shape; enterprise
security and audit users can move toward the later shapes when they need shared
ingest, retention, and query services.

| Mode | Shape | Best for | Tradeoff |
|---|---|---|---|
| Library / CLI-only recorder | one agentprov binary, optional Python helper, local SQLite/object store |
RL rollout, evaluator jobs, benchmarks, CI, local red-team harnesses | easiest to adopt; weaker shared query and long-running ingest |
| Sidecar / local daemon | agentprov daemon serve beside one worker or sandbox host; CLI/SDK acts as client |
sandbox worker, CI runner, local security harness, medium-volume telemetry ingest | adds a local service boundary, spool, backpressure, and stable query API |
| Central evidence service | shared ingest/query service with object storage, retention, auth, and UI/API | enterprise security, audit, SRE, compliance, incident review | highest operational cost; not the default RL entry point |
For RL and evaluator pipelines, the default contract is lightweight and
offline-first:
- Install: one Go binary plus an optional thin Python package.
- Call: wrap an existing command first; SDK/framework integration is optional.
- Batch: every trajectory gets stable
run_id/ evidence manifest / signal
context output, and query surfaces are paged. - Overhead: default capture focuses on process/file/diff/artifact/exit/resource
evidence; heavier Falco/eBPF-style telemetry is an opt-in substrate. - Ownership: AgentProvenance emits evidence, deviation, risk, and trajectory
signals. The RL system owns reward, ranking, dataset policy, and winner
selection. - Policy: RL mode does not require online deny/kill/quarantine. Those actions
are opt-in security controls; offline scoring can run later over captured
EvalContext JSONL.
Python usage stays thin and CLI-backed. For Deploy 1, the intended RL/evaluator
entry point is one function that runs the local offline loop end to end:
from agentprov import Registry, Signal, run_batch_pipeline

registry = Registry(name="rl-reward-signals")

@registry.rule("file_change_reward")
def file_change_reward(ctx):
    return Signal.reward_feature(
        "file_change_reward",
        float(len(ctx.file_changes())),
        "reward feature from file state changes",
    )

@registry.rule("metadata_penalty")
def metadata_penalty(ctx):
    if ctx.has_event_type("metadata_ip"):
        return Signal.penalty("metadata_ip", -1.0, "metadata service access")
    return None

result = run_batch_pipeline(
    [
        {"run_id": "traj-0001", "workdir": "/tmp/job1", "command": ["pytest", "-q"]},
        {"run_id": "traj-0002", "workdir": "/tmp/job2", "command": ["pytest", "-q"]},
    ],
    registry,
    binary="./agentprov",
    data_dir=".agentprov-rl",
    engine="rl-reward-signals",
    import_signals=True,
    include_forensics=True,
)

print(result.batch_id, result.signal_count)
For RL users, custom "rules" are ordinary Python evaluator functions. They run
offline over evidence; Go keeps ownership of capture, correlation, manifests,
and query integrity. The same workflow can be split into lower-level calls when
the pipeline already owns scheduling or sharding:
from agentprov import Client, evaluate_batch

client = Client(binary="./agentprov", data_dir=".agentprov-batch")
batch = client.record_batch(
    [
        {"run_id": "traj-0001", "workdir": "/tmp/job1", "command": ["pytest", "-q"]},
        {"run_id": "traj-0002", "workdir": "/tmp/job2", "command": ["pytest", "-q"]},
    ],
)
contexts = client.batch_eval_contexts(batch_id=batch["batch_id"])
reports = evaluate_batch(contexts, registry=registry)
client.import_signal_reports(reports, engine=registry.name)
Later, the same local store can be queried by batch, shard, job, or run:
./agentprov evidence batch-summary --latest --json
./agentprov evidence batch-summary --shard shard-0 --json
./agentprov evidence batch-summary --run traj-0001 --json
./agentprov signal batch-context --shard shard-0 --latest > eval-contexts.jsonl
./agentprov forensics export-batch --latest --json
Falco-compatible Receiver
The dedicated Falco receiver is useful when Falco is already filtering kernel
or runtime events on the host:
./agentprov telemetry bind --run run-falco-demo --session session-falco-demo \
  --attempt attempt-falco-demo --tool-call tool-falco-demo \
  --process process-falco-demo --container-id container-falco-demo --pid 4242 \
  --started-at 2026-01-01T00:00:00Z

./agentprov telemetry ingest-falco \
  --file examples/telemetry/falco-risk-events.jsonl --json

./agentprov telemetry list --run run-falco-demo
./agentprov telemetry list --run run-falco-demo --limit 100 --json
./agentprov telemetry list --run run-falco-demo --limit 100 --cursor <next_cursor> --json
./agentprov timeline --run run-falco-demo
./agentprov security risks --run run-falco-demo --json
./agentprov security responses --run run-falco-demo --json
For a live stream, pipe Falco JSON output directly:
sudo falco -o json_output=true -o json_include_output_property=true | \
  ./agentprov telemetry ingest-falco --file -
The receiver maps Falco process, file, and network rows into normalized runtime
events. Metadata IP, private CIDR, and secret-path rows are promoted into
security evidence: RiskSignal, ResponseAction, policy graph edges, and
timeline entries. graph explain --risk <policy_decision_id> --json links the
risk back to the raw runtime event and forward to the response action. Falco
remains the substrate collector; AgentProvenance owns correlation, causality,
provenance, and risk/audit linkage.
The main smoke path is telemetry correlation and graph explanation:
./scripts/demo_telemetry_jsonl.sh
It binds a ToolCallScope, ingests raw Falco/Tetragon/LoongCollector-style
runtime events that do not carry tool_call_id, normalizes them into the event
store, correlates them back to application context, and explains the resulting
causal graph.
Security Evidence Commands
./agentprov observe summary --run <run_id>
./agentprov observe summary --run <run_id> --json
./agentprov observe coverage --run <run_id>
./agentprov observe coverage --run <run_id> --json
./agentprov observe scopes --run <run_id>
./agentprov observe scopes --run <run_id> --json
./agentprov observe event --run <run_id> --event <event_id>
./agentprov observe event --run <run_id> --event <event_id> --json
./agentprov observe process --run <run_id> --process <process_id>
./agentprov observe process --run <run_id> --process <process_id> --json
./agentprov observe flow --run <run_id>
./agentprov observe flow --run <run_id> --json
./agentprov evidence manifest --run <run_id>
./agentprov evidence manifest --run <run_id> --json
./agentprov evidence manifest --run <run_id> --materialize --json
./agentprov telemetry correlations --run <run_id>
./agentprov telemetry correlations --run <run_id> --json
./agentprov telemetry correlations --event <event_id> --json
./agentprov timeline --run <run_id>
./agentprov timeline --run <run_id> --view causality
./agentprov timeline --run <run_id> --limit 100 --cursor <next_cursor> --json
./agentprov timeline --run <run_id> --tool-call <tool_call_id> --json
./agentprov timeline --run <run_id> --process <process_id> --json
./agentprov timeline --run <run_id> --type risk_signal --json
./agentprov security risks --run <run_id>
./agentprov security risks --run <run_id> --json
./agentprov security deviations --run <run_id>
./agentprov security deviations --run <run_id> --json
./agentprov security responses --run <run_id>
./agentprov security responses --run <run_id> --json
./agentprov baseline learn --template <template_name> --run <run_id>
./agentprov baseline check --template <template_name> --run <run_id>
./agentprov signal context --run <run_id>
./agentprov signal batch-context --batch <batch_id>
./agentprov signal batch-context --shard <shard_id>
./agentprov signal batch-context --runs runs.jsonl
./agentprov signal run --run <run_id>
./agentprov signal run --run <run_id> --json
./agentprov signal run --run <run_id> \
  --external "PYTHONPATH=python python3 examples/evaluators/python_signal_eval.py" --json
./agentprov signal import --run <run_id> --file external-signals.json --json
./agentprov signal import-batch --file signal-reports.jsonl --engine python-sdk --json
./agentprov compliance frameworks
./agentprov compliance map --framework owasp-asi --run <run_id>
./agentprov compliance explain --framework owasp-asi --run <run_id> --item ASI05
./agentprov compliance gaps --framework owasp-asi --run <run_id>
./agentprov compliance report --framework nist-rfi-2026-00206 --run <run_id>
./agentprov ai tools --provider openai
./agentprov ai tools --provider anthropic
./agentprov ai call evaluate_action --input '{"event_type":"network_connect","dst_ip":"169.254.169.254"}'
./agentprov policy test examples/events/metadata-egress.jsonl
./agentprov policy decisions --run <run_id>
./agentprov forensics export <run_id>
./agentprov forensics export-batch --batch <batch_id>
./agentprov forensics export-batch --latest --include-eval-contexts --json
These commands are now part of the mainline security evidence surface:
| Command | Purpose |
|---|---|
observe summary |
Show run-level observability coverage across application context, runtime telemetry, risks, baselines, responses, and evidence refs |
observe coverage |
Show runtime telemetry correlation quality and list events missing session/tool_call/process identity |
observe scopes |
Show per-tool-call observability: processes, runtime events, risks, policy decisions, responses, and drill-down links |
observe event |
Explain one runtime event with correlated agent context, related risk/policy/response evidence, and drill-down links |
observe process |
Explain one process with its tool_call context, runtime events, risk/policy/response evidence, and drill-down links |
observe flow |
Show the compact causality flow from runtime events to risk signals, policy decisions, and response actions |
evidence manifest |
Emit a run-level evidence index that binds observability summary, timeline hash, content-addressed object refs, risk/response report hashes, and recommended drill-down queries; --materialize writes it as an evidence_manifest provenance object |
telemetry correlations |
Explain why runtime telemetry events were attached to a ToolCallScope, including raw identity, matched binding, matched keys, confidence, time window, and drill-down refs |
timeline |
Show a time-ordered execution view across application context, runtime telemetry, evidence, risk, baseline, response, and external effects |
security risks |
List normalized RiskSignal records derived from policy/runtime evidence; --json emits schema/hash metadata and drill-down refs to event/process/timeline/explain views |
security deviations |
List BaselineDeviation records from behavior feature checks; --json emits schema/hash metadata and drill-down refs to timeline and summary views |
security responses |
List recorded ResponseAction records such as audit, deny, kill, quarantine, taint, export, or notification hooks; --json emits schema/hash metadata and drill-down refs back to risk/process/explain views |
baseline learn/check |
Learn process/file/network/risk/runtime feature vectors and emit deviation records plus baseline-derived risk signals |
signal context/batch-context/run/import/import-batch |
Export one EvalContext or JSONL EvalContext streams for a batch/shard/run list, run built-in or external evaluators, and validate imported EvalSignal records or JSONL EvalReport batches for reward shaping, dataset filtering, quality scoring, or external benchmark consumers. AgentProvenance owns the evidence protocol, not the reward policy |
compliance frameworks/map/explain/gaps/report |
Map run evidence to OWASP Agentic Security and NIST AI agent security assessment profiles as item-level self-assessment evidence and gap lists |
ai tools/call |
Expose the read-only evidence query surface and inline policy pre-flight gate as provider tool schemas plus a local dispatcher. This is not an LLM gateway: models can query evidence and ask for a trusted policy verdict, but they cannot fabricate runtime telemetry, signatures, or provenance objects |
policy test/decisions |
Evaluate events, persist policy decisions, and feed the risk/response graph |
forensics export |
Export auditable evidence for a run; --json emits agentprovenance.forensics_export/v1 with bundle path, sha256, size, and status |
forensics export-batch |
Export a batch-level audit bundle for record batches; --json emits agentprovenance.batch_forensics_export/v1 with batch summary, per-run forensics refs, optional EvalContext records, result/page hashes, and a sha256-verified bundle path |
External Evaluator Protocol
AgentProvenance exposes evidence to external scoring systems without owning
their reward, ranking, or dataset policy.
./agentprov signal context --run <run_id> > eval-context.json

./agentprov signal run --run <run_id> \
  --external "PYTHONPATH=python python3 examples/evaluators/python_signal_eval.py" \
  --json

./agentprov signal import --run <run_id> --file external-signals.json --json
The protocol is intentionally small:
EvalContextcontains trajectories, file changes, runtime events, risk
signals, and response actions.- External evaluators read
EvalContextfrom stdin and return{ "signals": [...] }. EvalSignalcan represent reward features, penalties, dataset labels, or
quality signals.python/agentprov_evaland theagentprovimport alias provide a thin
helper SDK withRegistry,@rule,evaluate_batch,reports_jsonl, and CLI-backed
capture/query helpers. They do not encode a reward function.signal import-batchaccepts JSONL EvalReport records so RL pipelines can
import many offline signal reports without one command per run.
This lets a benchmark harness, RL pipeline, red-team harness, or data filtering
job decide how evidence becomes score, rejection, or review.
In daemon mode, the same protocol is available through the local API:
GET  /v1/signal/context?run=<run_id>
POST /v1/signal/run
POST /v1/signal/import
The daemon does not expose an HTTP endpoint that runs arbitrary external shell
commands. A client can fetch EvalContext, execute its evaluator in its own
process boundary, and import the resulting signals back into the daemon for
validation. The CLI follows that shape when --daemon-url is set.
Compliance Evidence, Not Certification
AgentProvenance can map run evidence to security framework profiles such as
OWASP Agentic Security and NIST AI agent security assessment questions:
./agentprov compliance frameworks
./agentprov compliance frameworks --ruleset examples/compliance/custom-ruleset.yaml
./agentprov compliance validate --ruleset examples/compliance/custom-ruleset.yaml
./agentprov compliance map --framework owasp-asi --run <run_id>
./agentprov compliance map --framework owasp-asi --run <run_id> --only ASI05,ASI10,TRACE
./agentprov compliance explain --framework owasp-asi --run <run_id> --item ASI05
./agentprov compliance gaps --framework owasp-asi --run <run_id>
./agentprov compliance gaps --framework owasp-asi --run <run_id> --missing-only --json
./agentprov compliance map --framework enterprise-agent-review --ruleset examples/compliance/custom-ruleset.yaml --run <run_id>
./agentprov compliance report --framework nist-rfi-2026-00206 --run <run_id> --json
The output is an evidence-backed self-assessment. It does not certify
compliance, provide legal advice, or replace qualified third-party audit. Each
check item is derived from evidence already present in the run: timeline events,
runtime telemetry, ToolCallScope bindings, policy decisions, risk signals,
baseline deviations, response actions, forensics bundles, content-addressed
provenance objects, and graph edges.
Each item reports:
covered | partial | missing | not_applicable
with concrete evidence_refs, a gap when evidence is incomplete, and a
recommended next step. This makes agent execution evidence usable for security
reviews without turning AgentProvenance into a GRC platform.compliance gaps turns that same mapping into an actionable backlog of missing
or partial evidence items for a run.
Custom rulesets can add local frameworks and rules without replacing built-ins.
The YAML model separates rules, frameworks, and mappings; mappings can
also select built-in items such as ASI05, ASI10, or TRACE and reuse them
inside an enterprise-specific review profile. JSON keeps control_id for
compatibility and also emits item_id for the current terminology.
AI-Callable Evidence Tools
AgentProvenance can expose its evidence query surface as AI-callable tools for
agent harnesses, evaluators, or review assistants:
./agentprov ai tools --provider generic
./agentprov ai tools --provider openai
./agentprov ai tools --provider anthropic

./agentprov ai call verify_run --input '{"run":"run-demo-bugfix"}'
./agentprov ai call list_events --input '{"run":"run-demo-bugfix","type":"execve","limit":10}'
./agentprov ai call get_timeline --input '{"run":"run-demo-bugfix","view":"causality"}'
./agentprov ai call evaluate_action --input '{"event_type":"execve","args":["python","-m","pytest","-q"]}'
./agentprov ai call evaluate_action --input '{"event_type":"network_connect","dst_ip":"169.254.169.254"}'

./agentprov ai mcp   # serve the same catalog over stdio MCP (JSON-RPC 2.0)
The same catalog is rendered for the generic, OpenAI, and Anthropic providers,
dispatched locally by ai call, and served over the Model Context Protocol byai mcp (a stdio JSON-RPC 2.0 server, spec 2025-06-18, so MCP clients see the
identical tool set with no separate contract to drift). The catalog:
| Tool | Purpose |
|---|---|
verify_run |
Verify object hashes, parent links, and policy/risk/response/signal integrity for a run |
get_signals |
Return the unified behavior/cost/quality/security signal set for a run |
list_risks |
Return security risk signals and recommended actions |
list_events |
Return paged runtime telemetry events, optionally filtered by type |
get_timeline |
Return the merged application-context and runtime-telemetry timeline |
evaluate_action |
Run a proposed command, file action, or network action through the trusted policy engine without executing it (inline gate, no side effects) |
bind_scope |
Register a ToolCallScope binding (app-asserted, forced binding_source=ai_asserted) so independent system telemetry can correlate to this tool call |
record_tool_call |
Anchor an app-asserted tool call (status=asserted); does not execute anything |
The read tools and evaluate_action are advertised read-only; bind_scope andrecord_tool_call are the context-write surface (readOnlyHint=false over MCP).
This is not a model gateway, prompt router, or tool-execution sandbox. The model
receives schemas and can query the evidence store, pre-flight an action through
the trusted policy engine, and assert its own app-side context (bind_scope /record_tool_call). It can never write raw system telemetry, fabricate
signatures, or forge provenance graph facts: context-write rows are recorded asai_asserted and execute nothing, and verdicts are computed by the trusted
engine, not the model.
Web Dashboard
./agentprov dashboard serve            # http://127.0.0.1:7396
./agentprov dashboard serve --data-dir <dir> --addr 127.0.0.1:7396
A local, read-only, single-page dashboard over the verifiable graph. Its JSON
endpoints reuse the same internal functions as the CLI and AI tools, so the UI
never drifts from the contract; the HTML/JS is embedded in the binary and loads
no external assets (local-first). Panels:
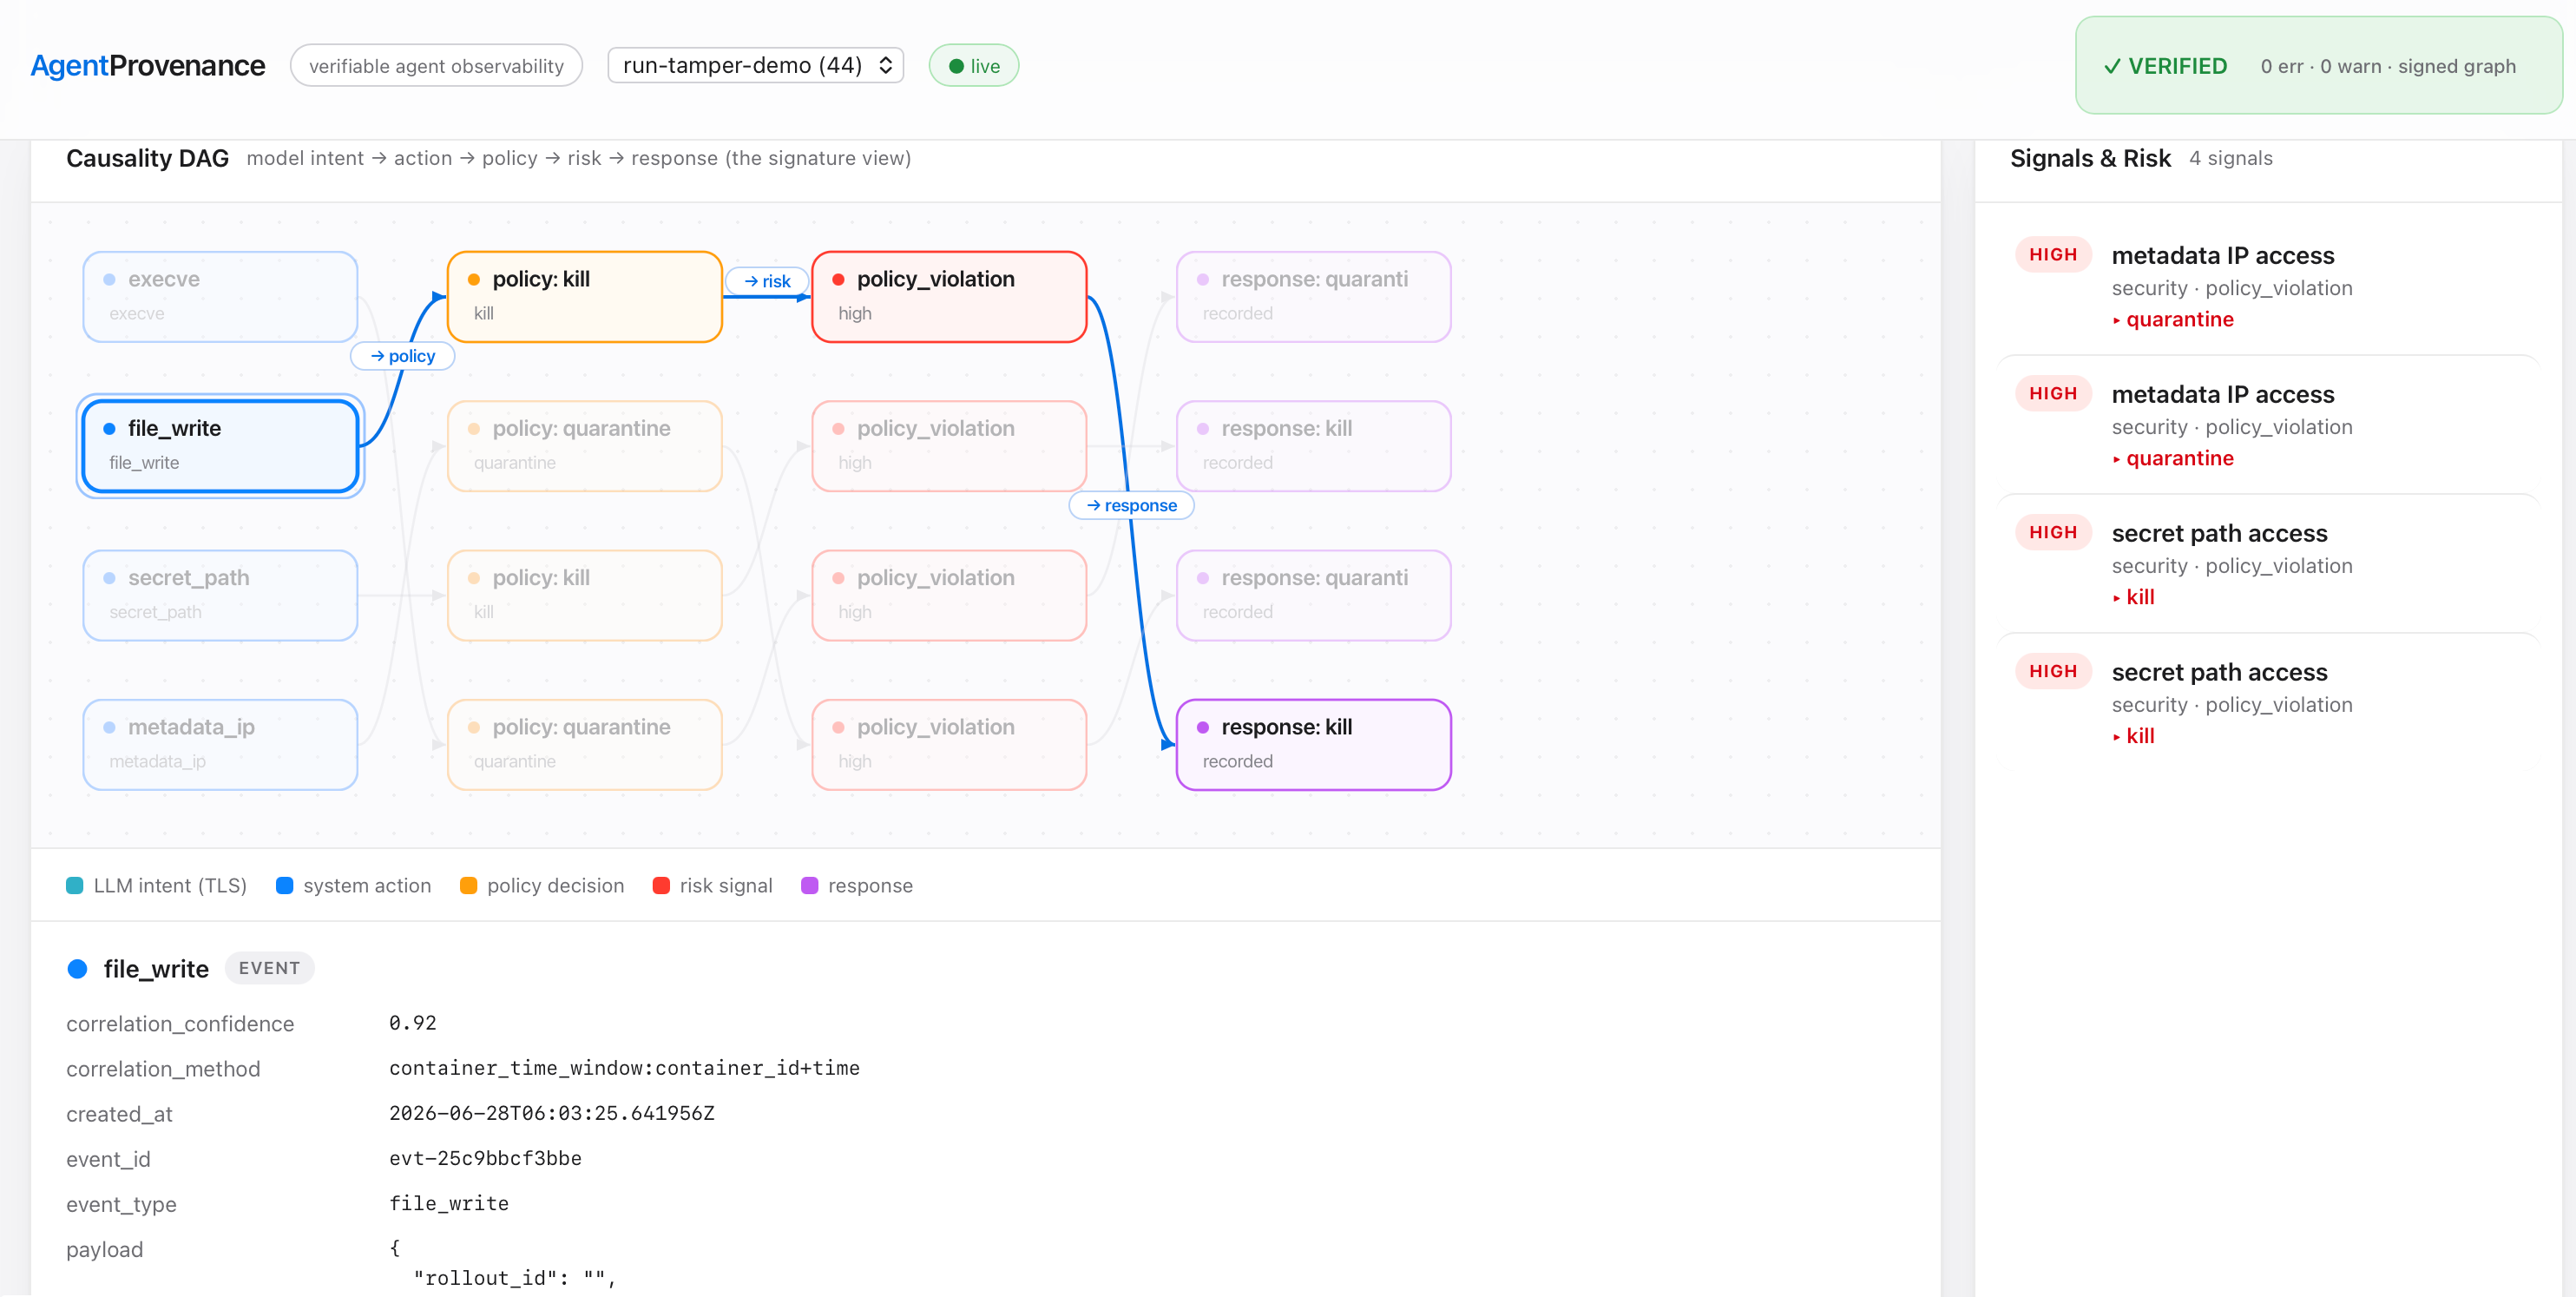
- Causality DAG (the signature view): model intent -> action -> policy ->
risk -> response, rendered from the samellm_intent_caused/llm_call/
policy->risk->response edges; click a node to highlight its causal lineage and
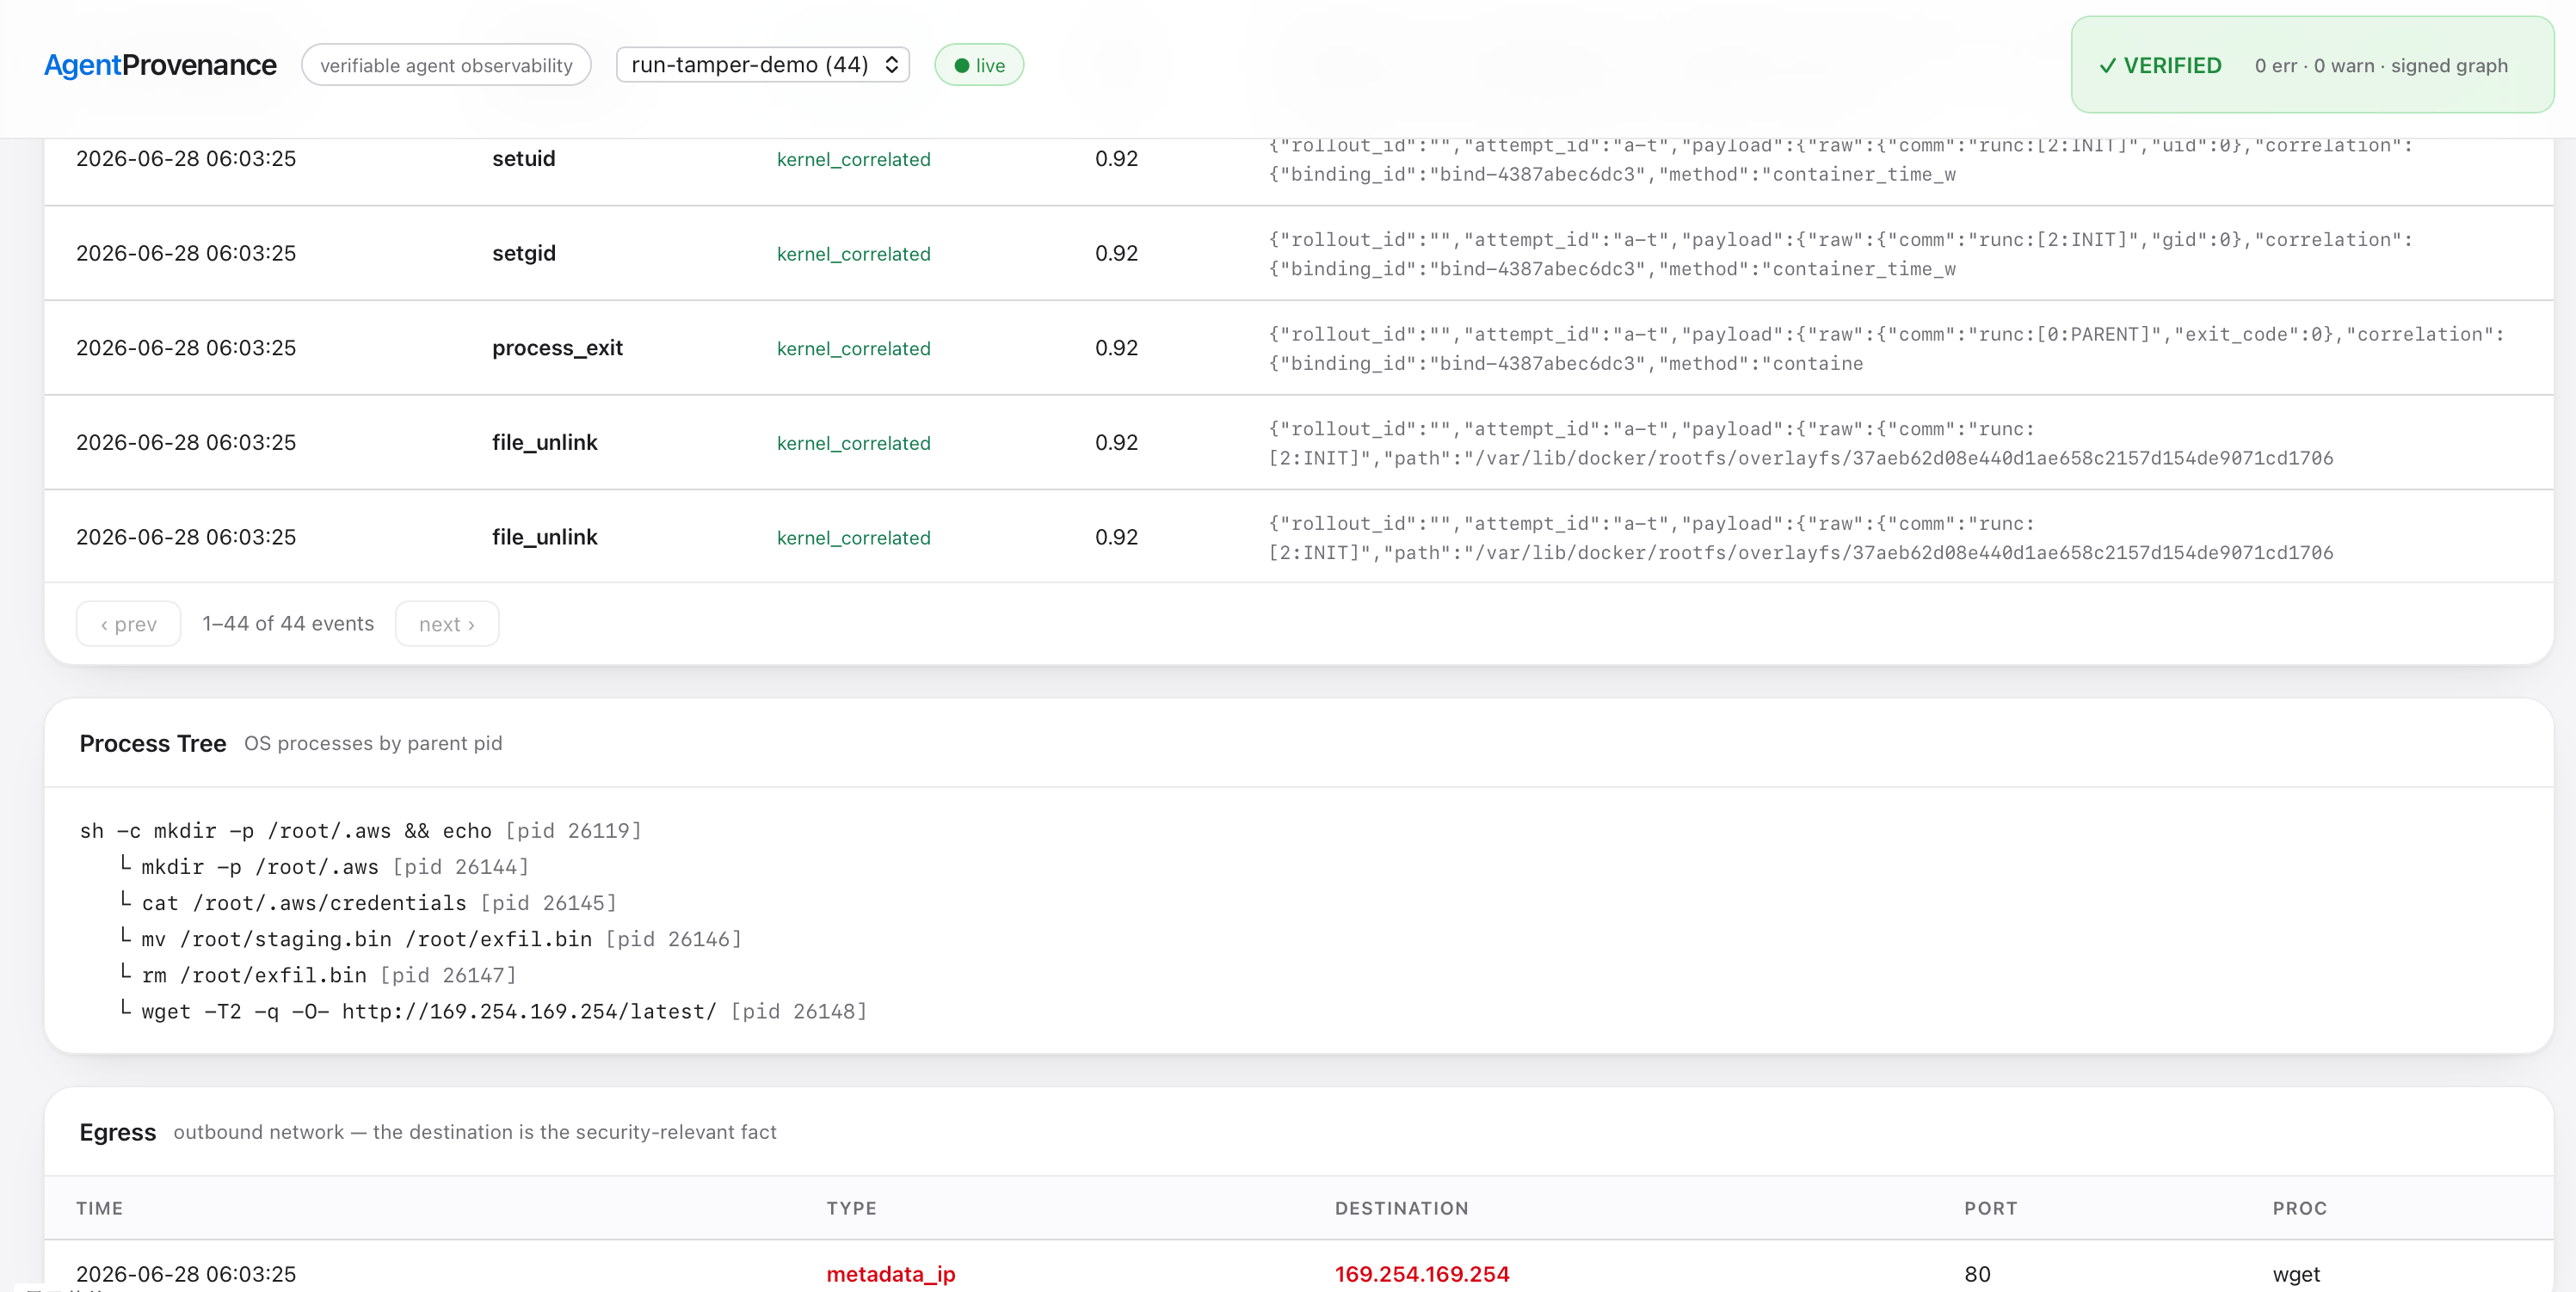
inspect its full record. - Verify + signature status, signals / risk with recommended actions, a
paged timeline (with correlation class per event), the process tree,
and egress (destination IP and -- when captured -- resolved DNS hostname). - Live auto-refresh; flat event streams plus the verifiable signed DAG that a
pure event viewer cannot show.
Graph Commands
./agentprov graph trace --run run-demo-bugfix
./agentprov graph refs --run run-demo-bugfix
./agentprov graph log --run run-demo-bugfix
./agentprov graph materialize --run run-demo-bugfix
./agentprov graph objects --run run-demo-bugfix
./agentprov graph objects --run run-demo-bugfix --limit 50 --json
./agentprov graph objects --run run-demo-bugfix --limit 50 --cursor <next_cursor> --json
./agentprov graph verify --run run-demo-bugfix
./agentprov graph verify --run run-demo-bugfix --json
./agentprov graph replay --run run-demo-bugfix
./agentprov graph replay --run run-demo-bugfix --json
./agentprov graph trajectories --run run-demo-bugfix --json
./agentprov graph diff --run run-demo-bugfix --file calculator.py
./agentprov graph diff --run run-demo-bugfix --file calculator.py --json
./agentprov graph blame --run run-demo-bugfix --file calculator.py
./agentprov graph blame --run run-demo-bugfix --file calculator.py --json
./agentprov graph explain --run run-demo-bugfix --file calculator.py
./agentprov graph explain --run run-demo-bugfix --file calculator.py --json
./agentprov graph explain --run run-demo-bugfix --file calculator.py --depth 4 --limit 200 --json
./agentprov graph explain --run run-demo-bugfix --file calculator.py --depth 4 --limit 200 --cursor <next_cursor> --json
./agentprov graph explain --tool-call <tool_call_id>
./agentprov graph explain --risk <policy_decision_id> --json
What these mean:
| Command | Purpose |
|---|---|
trace |
Show execution context, runtime causality, provenance edges, risk, and response-gate evidence |
refs |
Emit stable Git-like references for attempts, snapshots, artifacts, and decisions |
log |
Show chronological execution history |
materialize |
Write content-addressed provenance objects |
objects |
List content-addressed object refs, hashes, parent hashes, source IDs, paths, and sizes; supports --limit and --cursor |
verify |
Check graph integrity, risk/response evidence chains, taint/response barriers, object hashes, replay generation, drain watermarks, telemetry batch hashes, and orphan lifecycle evidence for outlived zero-SDK child processes |
replay |
Emit a plan-only reconstruction of the run |
trajectories --json |
Emit per-attempt behavior evidence, risk/deviation context, cost, artifacts, and runtime events for external evaluators or RL reward/penalty pipelines |
diff |
Compare file state between base and attempts |
blame |
Attribute file state to attempt, tool call, process, strategy, command, and local candidate status |
explain |
Explain a target by combining trace, runtime causality, diff/blame, telemetry receiver details, telemetry batch manifests, process observations, policy, object refs, risk signals, baseline deviations, and response evidence; --json emits agentprovenance.explain/v1 with upstream, downstream, bounded causality_path, query, evidence, objects, risks, telemetry_batches, process_observations, and replay_refs; runtime events include receiver/source format, normalized event type, identity keys, schema status, and correlation status; use --depth, --limit, and --cursor to bound and page DAG traversal |
Current Capability
Capture & ingest
| Capability | What it does |
|---|---|
| Zero-SDK record | record -- <cmd> snapshots the workdir, samples the process tree, captures file diffs + runtime evidence, no SDK |
| Batch recorder | record batch records many jobs in parallel for RL/benchmark pipelines |
| Native eBPF sensor | agentprov-sensor (Linux/arm64): exec+argv, connect, file write + sensitive read → secret_path, process_exit, privesc (setuid/setgid/ptrace), tamper (rename/unlink), TLS plaintext (hash + metadata), DNS — in-kernel noise filtering, validated live |
| Evidence ingest | Falco / Tetragon / LoongCollector JSONL + native sensor → normalized events; schema-validated, app-context rejected in raw payloads, paged with integrity hashes |
Correlate & verify
| Capability | What it does |
|---|---|
| Execution context | explicit ToolCallScope binding across run / session / attempt / tool_call / process / container / cgroup / pid |
| Runtime causality | native runtime_* graph edges (tool call, process tree, snapshot, event, file) |
| Provenance DAG | graph trace / refs / log / materialize / objects / verify / replay over content-addressed objects |
| Graph verify | checks object hashes, parent links, and the policy → risk → response → signal chain (white-box and external-telemetry runs) |
| Correlation explain | telemetry correlations — raw identity, resolved context, matched binding, confidence, and time window per event |
Query & observe
| Capability | What it does |
|---|---|
| Timeline | timeline [--view causality] [--json] — merged app-context + system telemetry, paged with integrity metadata |
| Observability | observe summary / coverage / scopes / event / process / flow — correlation coverage, gaps, per-scope and event→response views |
| Evidence query | graph explain over file / artifact / process / event / tool_call / attempt / risk with bounded, paged causality paths |
| Diff / blame | file-level diff and blame, joined to runtime events and content-addressed objects |
| Evidence manifest | evidence manifest — a run-level, hash-indexed evidence index (--materialize to an object) |
| Web dashboard | dashboard serve — local read-only UI: causality DAG, verify status, signals, timeline, process tree, egress |
Security & signals
| Capability | What it does |
|---|---|
| Policy / risk / taint | policy decisions, risk signals, quarantine, taint + descendant checks, response-gate eligibility |
| Behavior baseline | baseline learn / check — process/file/network/resource features; deviations become risk signals |
| Unified signals | one graph-attached signals table (behavior / cost / quality / security); security + quality are live producers |
| Compliance | compliance maps evidence to OWASP Agentic + NIST AI profiles with coverage and gap reports |
| Signed attestation | in-toto/DSSE ed25519 signing of evidence (forensics export --sign-key), detecting post-signing tamper |
| Forensics bundle | forensics export[-batch] — a hashed audit bundle of the full evidence set |
Surfaces & integration
| Capability | What it does |
|---|---|
| CLI / JSON | every command has a stable --json contract with result/page integrity hashes |
| Daemon API | daemon serve — binding, ingest, query, verify, record, forensics, signals over HTTP; optional bearer-token auth |
| AI tools + MCP | the read surface, the evaluate_action gate, and context-write (bind_scope / record_tool_call) via ai call and stdio MCP (ai mcp) |
| Evaluator / RL | signal context / import, trajectory manifests, and a Python SDK (offline batch + in-loop scoring) — emits evidence, not reward policy |
| Substrate | Docker runtime (gVisor/Firecracker stubs); snapshot fork/resume/taint; telemetry spool, windows, retention, 100k-pressure tested |
Core Demo Acceptance
The main demo must prove:
- Multiple attempts fork from the same clean snapshot.
- Raw telemetry does not need
tool_call_id. - Paged
graph objectsandgraph explainresponses expose stableresult_set_idand per-pagepage_hashintegrity metadata. - PID, cgroup, container, and time-window bindings can resolve execution
context. - Native runtime causality records
tool_call -> process -> runtime_event. - PID/PPID/TGID telemetry creates process-tree causality edges.
- Runtime-observed
file_writecan appear in the same trajectory that produced
a file diff. - Runtime-observed file events create
workspace_file/<path>graph nodes and
can be explained together with diff/blame. - Zero-SDK process observations expose outlived child processes and verify that
orphan lifecycle evidence and policy decisions exist. - Timeline JSON shows zero-SDK
process_observedevents with pid, ppid,
command, first/last seen timestamps,outlived_root, and scope boundary
metadata. - Risk events can create taint and response records, but Phase 1 does not make
final reward or winner decisions. graph diffemits unified diff and JSON.graph blameemits created/modified/deleted/unchanged state attribution.graph trajectories --jsonemits a structured evidence package for external
evaluators.
Run:
./scripts/demo_telemetry_jsonl.sh
./scripts/demo_provenance_trace.sh
Architecture

flowchart TD
    Agent["Agent / Harness / Benchmark / Red-team / RL Pipeline"] --> CLI["agentprov CLI"]
    Agent --> SDK["Optional SDK / Tool Router"]
    Agent --> Recorder["Zero-SDK Recorder\nagentprov record -- <cmd>"]

    CLI --> Boundary
    SDK --> Boundary
    Recorder --> Boundary
    RuntimeTelemetry["Runtime Telemetry\nFalco / Tetragon / auditd / future eBPF"] --> Boundary
    SandboxIdentity["Sandbox Identity\ncontainer / cgroup / pid / cwd / time"] --> Boundary
    AppContext["Application Context\nrun / session / attempt / tool_call"] --> Boundary
    ExternalSignals["External Evaluator Signals\nreward_feature / penalty / label / quality"] --> Boundary

    subgraph Boundary["API / Ingest Boundary"]
        Daemon["Daemon API\ncontrol + query"]
        Validation["Validation / Normalization\nschema / identity / redaction"]
        Spool["Spool / Backpressure / Retention"]
    end

    Daemon --> Validation
    Validation --> Spool
    Spool --> Core

    subgraph Core["Observability + Provenance Core"]
        Correlation["ToolCallScope Correlation\npid / cgroup / container / time window"]
        Timeline["Execution Timeline\napplication context + runtime events"]
        Causality["Runtime Causality Graph\nprocess / file / network / event"]
        Provenance["Git-like Provenance DAG\nrefs / objects / diff / blame"]
        Evidence["Evidence Manifest\ncontent-addressed refs / hashes"]
    end

    Core --> Correlation
    Correlation --> Timeline
    Timeline --> Causality
    Causality --> Provenance
    Provenance --> Evidence
    Evidence --> Query["Evidence Query Surface\nobserve / timeline / explain / verify / audit"]
    Evidence --> Security["Security Analysis\nbaseline / policy / risk / response / forensics"]
Capability gating is a hard design rule. Upper layers must query the runtime,
snapshot, telemetry, and isolation capabilities before assuming fast fork,
memory snapshot, restore, identity, or enforcement semantics. Docker-only
execution degrades to directory/filesystem provenance instead of pretending to
provide VM-level resume.
All producers enter through the API/Ingest Boundary. Zero-SDK recorders,
SDK/tool routers, telemetry receivers, sandbox adapters, and external evaluator
signals are producer inputs; they should not bypass validation, normalization,
identity binding, redaction, spool/backpressure, or retention controls to write
directly into the core evidence graph.
Substrate Signals
Substrate integrations are downstream of the provenance model:
- Docker is the active local runtime.
- OpenSandbox, gVisor, Firecracker, and Kata are future runtime substrates.
- Kubernetes, Ray, Batch, and cloud systems are orchestration substrates.
- Falco, Tetragon, LoongCollector, auditd, and eBPF are telemetry substrates.
The current MVP consumes already-filtered Tetragon/Falco/LoongCollector JSONL
throughagentprov telemetry ingest-jsonl, adds a dedicatedagentprov telemetry ingest-falcoreceiver for Falco JSON/stdout streams,
records a hashable batch manifest, and does not run kernel probes. - A future
agentprov-sensorshould be capability-gated: prefer modern eBPF
where the kernel and permissions support it, fall back to a legacy eBPF path
where appropriate, and only use a kmod-style collector when an operator
explicitly accepts that deployment model. The control plane must treat sensor
capability as data, not as a hidden assumption.
The project value is not collecting more logs. The value is correlating
substrate signals with execution context and making them affect diff, blame,
taint, replay, and auditability.
Boundaries
These boundaries are intentional:
- AgentProvenance does not implement a general sandbox runtime.
- It does not replace Kubernetes, Ray, OpenSandbox, Firecracker, gVisor, Kata,
Falco, Tetragon, LoongCollector, or eBPF. - It is not a LangSmith clone, LLM gateway, or general observability dashboard.
- It does not promise memory snapshot or VM-level instant clone in Phase 1.
- It does not perform arbitrary branch auto-merge.
- It does not roll back real external side effects. External actions are
recorded, gated, and optionally linked to compensation hooks. - It does not make final reward, penalty, or winner decisions for RL pipelines;
it emits the behavior evidence and deviation signals those systems can score.
See docs/product.md for the product direction and
docs/deployment-modes.md for deployment shapes.
docs/comparisons.md covers adjacent-system boundaries.
Repository Layout
cmd/agentprov/        CLI entrypoint
cmd/agentprov-sensor/ native eBPF sensor (Linux)
internal/cli/         command parsing and output

internal/record/      zero-SDK command recorder
internal/sensor/      native eBPF sensor (exec/connect/file/privesc/tamper/TLS/DNS); Linux-only, arm64
internal/telemetry/   normalized runtime event schema, JSONL ingest, TLS HTTP metadata, correlation inputs
internal/correlation/ ToolCallScope and runtime identity binding
internal/provenance/  timeline, graph trace, refs, objects, diff, blame, verify, replay
internal/evidence/    compact evidence records and external effects
internal/security/    policy decisions, risk signals, baseline deviations, response actions
internal/signals/     unified graph-attached signal model (behavior/cost/quality/security)
internal/baseline/    behavior baseline learning and deviation records
internal/attest/      in-toto/DSSE ed25519 evidence signing (tamper-evidence)
internal/forensics/   evidence bundle export (optional signed attestation)
internal/aitools/     AI-callable tool catalog (read surface + inline gate + context-write)
internal/mcpserver/   stdio MCP (JSON-RPC 2.0) server over the aitools catalog
internal/dashboard/   local read-only web dashboard (embedded UI)

internal/substrate/   Docker/runtime/snapshot adapters used as execution substrates
internal/control/     local lease/session control for substrate-backed demos
internal/computerapi/ file/tool API over local sandbox sessions
internal/ports/       local preview proxy support

internal/stressdemo/  branch-heavy fanout demos that exercise provenance under load
internal/experimental/ resource windows, scheduler, node metadata, warm-pool experiments
internal/store/       SQLite schema and repositories
examples/             tasks, events, policies
scripts/              runnable demos
docs/                 product direction, MVP details, comparisons
The main product path lives in record, telemetry, correlation,provenance, evidence, security, signals, baseline, attest, andforensics. substrate contains runtime facts AgentProvenance can consume.stressdemo and experimental are intentionally separated so branch fanout and
old resource experiments do not define the project identity.
Roadmap
| Phase | Goal | Main deliverables |
|---|---|---|
| Phase 1 | Provenance Correlation MVP | ToolCallScope, raw telemetry correlation, runtime causality DAG, diff/blame, risk/deviation records, response-gate evidence, replay and trajectory manifests |
| Phase 2 | Evidence / Causality Hardening | execution timeline JSON, stable explain JSON, content-addressed objects, object parent hashes, graph verification, bounded traversal, pagination, integrity metadata |
| Phase 3 | Zero-SDK Recorder Hardening | process-tree capture, delayed child process handling, cwd/time/file-diff inference, orphan lifecycle evidence, low-intrusion record mode |
| Phase 4 | Real Telemetry Integration | Falco/Tetragon/LoongCollector/auditd/eBPF receivers, cgroup/container/pid correlation, kernel-side filtering assumptions |
| Phase 5 | Risk / Policy / Control | configurable risk signals, behavior baselines, compliance evidence mapping, response adapters, taint propagation, quarantine, response blocking, forensics export, Feishu/DingTalk/webhook hooks, isolation escalation hooks |
| Phase 6 | Scale / UI / Productization | async evidence writer, retention, content-addressed storage, snapshot GC, resource windows, high-concurrency ingest/query tests, evaluator SDK hardening, central evidence service, usable UI/API |
Recently landed (cross-cutting, ahead of full Phase 5/6):
- Unified signal model (
internal/signals,agentprovenance.signals/v1) -
one graph-attached row type for behavior/cost/quality/security, replacing the
per-dimension silos; security and quality are live producers, with idempotent
backfill from legacy tables. - Signed evidence attestation (
internal/attest) - in-toto/DSSE ed25519
signing of evidence digests, wired intoforensics export, giving
post-compromise tamper-evidence rather than integrity-only hash recompute. - Concurrency correctness - SQLite pragmas (incl.
busy_timeout) applied via
DSN to every pooled connection, fixing silentSQLITE_BUSYunder concurrent
writers; correlation bindings bound stale-open over-matching. - Native eBPF sensor expansion (
internal/sensor, validated live on an arm64
VM) - sensitive file reads (->secret_path), privilege changes
(setuid/setgid/ptrace), file tamper (rename/unlink), TLS plaintext -> privacy-
safe HTTP metadata +llm_callpairing,process_exitclosing correlation
windows, and DNS (getaddrinfo). In-kernel noise filtering before ring-buffer
reserve removed a containerd-teardown firehose. Privilege-escalation policy
rules (ptrace, setuid-to-root -> quarantine). - AI surface - MCP server (
ai mcp, stdio JSON-RPC 2.0) and context-write
tools (bind_scope,record_tool_call) over the sameinternal/aitools
catalog, app-asserted within the trust boundary. - Web dashboard (
internal/dashboard,dashboard serve) - local read-only
view with the causality DAG as the signature panel, plus timeline, process
tree, egress, signals, and verify/signature status.
Near-term hardening:
- Deeper graph integrity checks for process-tree and file-event causality.
- Realistic zero-SDK acceptance for file modification, file creation, file
deletion, child process observation, delayed runtime-event correlation,
diff/blame, timeline, evidence manifest, replay, and graph verification. - Realistic Falco risk acceptance for raw
execve, metadata-IP, private-CIDR,
and secret-path rows becoming correlated telemetry, risk signals, response
actions, graph explanations, evidence manifests, and verified DAG state. - Forensics bundle acceptance for risky runtime streams, including bundle
sha256 verification and embedded evidence/risk/response/graph-edge checks. - Daemon evidence API acceptance for the same risk path through HTTP endpoints,
proving the first control/query boundary without making the CLI own every
lifecycle.
Development
go test ./...
./scripts/accept_phase1.sh
./scripts/accept_zero_sdk_realistic.sh
./scripts/accept_falco_risk_realistic.sh
./scripts/accept_forensics_bundle.sh
./scripts/accept_batch_forensics.sh
./scripts/accept_evidence_query_pagination.sh
./scripts/accept_daemon_evidence_api.sh
./scripts/accept_telemetry_spool_backpressure.sh
./scripts/accept_telemetry_100k_pressure.sh
./scripts/accept_telemetry_event_windows.sh
./scripts/accept_signal_engine.sh
./scripts/accept_python_helper.sh
./scripts/accept_deploy1_batch_pipeline.sh
go test ./..., go vet ./..., and gofmt -l are the per-package gates. The
acceptance scripts are the end-to-end ones: each drives a single path —
zero-SDK record, Falco/native-sensor risk, forensics bundle, daemon evidence
API, telemetry spool/pressure/windows, the signal engine, the Python helper, the
Deploy 1 batch pipeline, and query pagination — and asserts correlated evidence,
risk/response records, graph edges, and a clean graph verify. The eBPF sensor
is validated on a Linux host (go generate ./internal/sensor, then runagentprov-sensor).
Yorumlar (0)
Yorum birakmak icin giris yap.
Yorum birakSonuc bulunamadi