local-token-monitor
Health Uyari
- License — License: MIT
- Description — Repository has a description
- Active repo — Last push 0 days ago
- Low visibility — Only 7 GitHub stars
Code Uyari
- network request — Outbound network request in monitor.py
Permissions Gecti
- Permissions — No dangerous permissions requested
Bu listing icin henuz AI raporu yok.
Live local dashboard for AI coding token usage and cost, per task and per day. Reads session logs already on your disk - single Python file, no dependencies, no proxy, no API key. Works with Claude Code today; adapt it to your tool.
🇧🇷 Leia a documentação completa em português
Local Token Monitor
A live dashboard for your Claude Code token usage and cost — per task, per day, as you work. One Python file, no dependencies, nothing leaves your machine.
Run it locally · Docker · How it works · Roadmap · Changelog




Scope. This is a local, read-only viewer. There is no hosted demo, and there
will not be one: the dashboard reads the session history on your machine, so a
public instance would have no data — and would contradict the one promise the
project makes. Run it locally in about ten seconds.
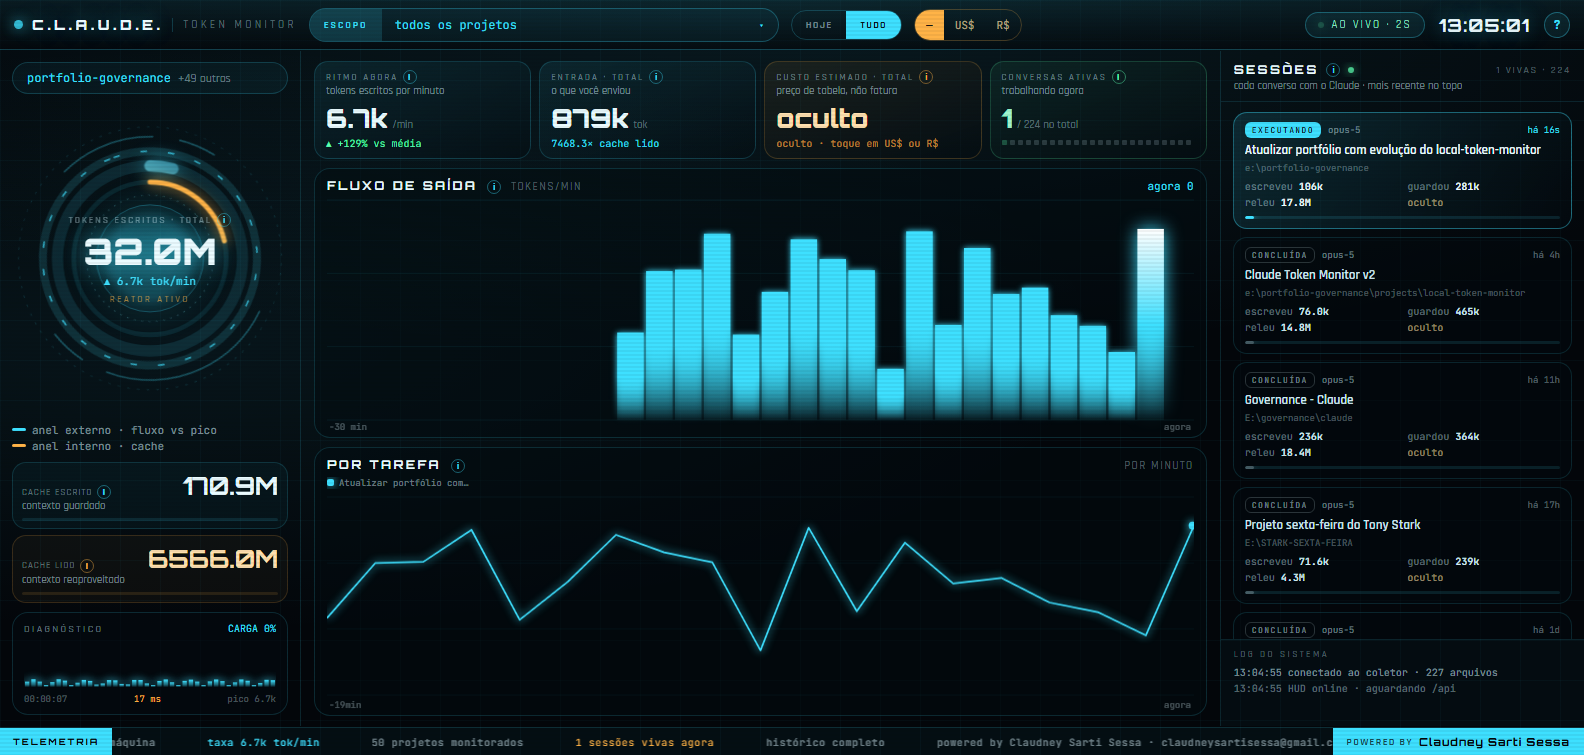
Real capture of the HUD running against live data, Tudo scope — 224 sessions,
227 files, money off, AO VIVO · 2S in the top right.
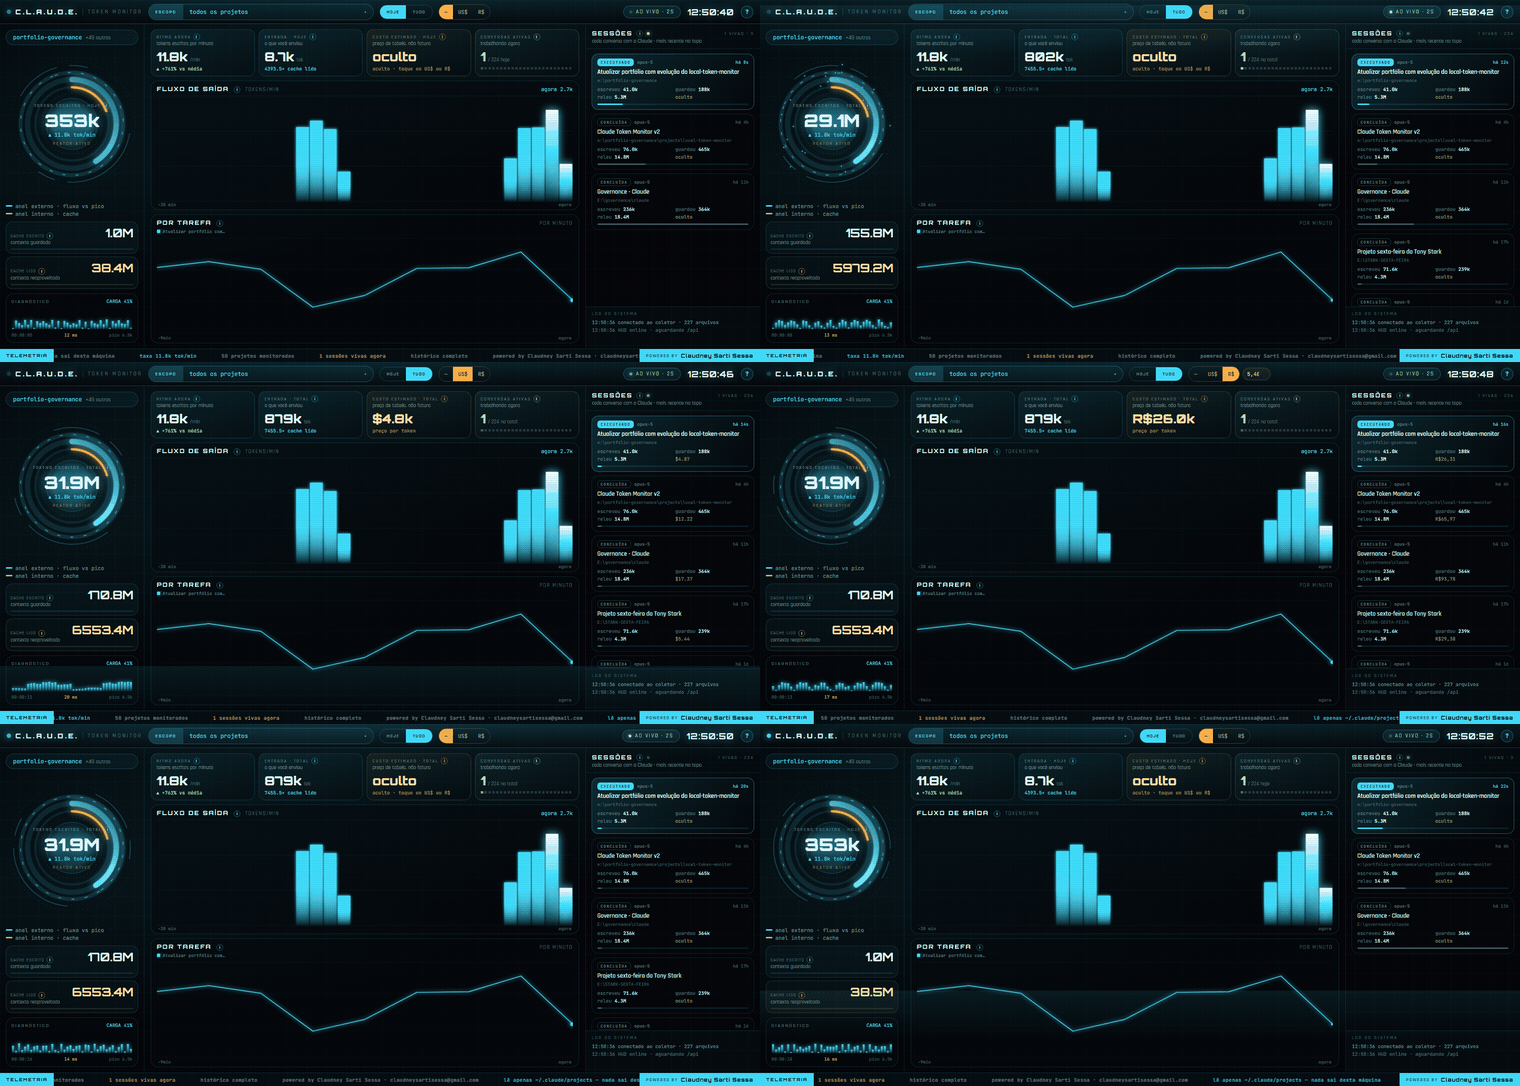
The same HUD being driven: scope, then currency. Nothing is staged — every number
comes from /api reading this machine's own history.
Why this exists
Claude Code already records every token it uses. It writes each session to~/.claude/projects/<project>/<session>.jsonl and appends in real time as the
conversation happens. That file is the source of truth for what you spent — it just
has no viewer.
The question that started this was narrow: when do I burn the most tokens, and on
which task? The answer was already on disk. This is the viewer for it — no proxy,
no API key, no account, no network call. Your prompts never leave the disk they are
already on.
What you get
Task attribution. Every row is labeled with the session's real title — the one
you see in Claude Code's sidebar — so you can tell which piece of work cost what.
The title comes from your own customTitle when you set one, the generatedaiTitle when you did not, and only then falls back to the first message.
A usage calendar. A month-at-a-glance heatmap. Click any day to pull the whole
dashboard to that date: its cost, its hourly activity, its tasks.
Live sessions. What is running right now, how much it has burned, and how long
since its last token. Refreshes every two seconds.
Two charts. Total output per minute over the last 30, and one line per active
task so you can see which one is driving the spend. Hover for a crosshair carrying
every series.
API-equivalent cost — off by default, opt in with one click. The toolbar has aUS$ / R$ / — switch that starts on —. Turn it on and every task, day and total
also carries what the usage would cost at Anthropic's published per-token rates,
with cache writes billed at 1.25× input and cache reads at 0.1×. Set your own
exchange rate for a second currency; the rate is yours to type, because looking one
up would mean a network call.
Why cost is off by default: most people run Claude Code on a subscription.
Pro, Max and Team are flat-fee, with an allowance that is not denominated in API
dollars — so a large API-equivalent figure next to a usage meter reading 3% is not
a contradiction, it is two different rulers, and the gap is the value the plan is
giving you. Shown without that context the number misleads, so you choose to see
it. If you pay per token, turn it on: then it is your bill. On a subscription
it still works as a ranking — it sorts tasks by real weight better than raw token
counts do.
Light and dark themes follow your system by default, with a manual override that
persists. The layout works on a phone.
Two front ends, one port. Opening the server gives you the HUD: a dark,
full-bleed cockpit built to be read from across the room, on a tablet propped up
next to the keyboard. The original working dashboard — calendar, tables, theUS$ / R$ / — switch — is still there, at /painel. Both poll the same /api
every two seconds, and neither one changes what the collector does.
The HUD's own toolbar. A control strip across the top narrows what the
cockpit is showing: a Hoje / Tudo scope switch — today only, or the whole
history — and a project filter listing every root the collector found. Next to
them is the same — / US$ / R$ switch as the dashboard, starting on — for the
reason above, with the exchange rate typed by hand because looking one up would
mean a network call. Scope, project, currency and rate persist inlocalStorage, so the tablet comes back the way you left it.
Help built into the panel. A Como ler este painel button opens a modal
explaining the top controls, the two rings and both charts; every metric also
carries a small i you can tap for what that number actually counts — input
versus output, cache read versus cache written, pace, cost, session, token. On a
screen meant to be read from two metres away, having to leave for a README
defeats the point.
Run it locally
There is no hosted demo, so this section is the demo. It is meant to be followed
by someone who has just cloned the repository.
Requirements: Python 3.11 or newer. Nothing else — no pip install, no virtual
environment, no lockfile. Claude Code must have run at least once on this machine,
so that ~/.claude/projects exists.
git clone https://github.com/claudneysessa/local-token-monitor.git
cd local-token-monitor
python -m unittest discover
python monitor.py
Then open http://127.0.0.1:8099.
Or skip the clone entirely — it is one file:
curl -O https://raw.githubusercontent.com/claudneysessa/local-token-monitor/main/monitor.py
python monitor.py
Downloaded on its own, monitor.py serves the dashboard at / and skips the HUD:
the HUD is a second file, and the server simply falls back when it is not next to
the script. Grab both if you want it:
curl -O https://raw.githubusercontent.com/claudneysessa/local-token-monitor/main/monitor.py
curl -O https://raw.githubusercontent.com/claudneysessa/local-token-monitor/main/hud.html
python monitor.py
Routes
| Route | Serves |
|---|---|
/ |
the HUD, or the dashboard when hud.html is absent |
/hud |
the HUD, explicitly |
/painel |
the working dashboard, always |
/api |
the JSON snapshot the pages poll; ?force=1 rescans first |
hud.html is a single compiled file with its fonts embedded, so it needs no
network of its own — which is what makes it usable on a tablet with no internet.
It is a build artifact: do not hand-edit it.
By default the server binds to 127.0.0.1 only, so it is not reachable from your
network, and no internet connection is required. --host / MONITOR_HOST and--raiz / MONITOR_ROOTS change that — see Options below, and read
the security warning in Running in Docker before binding to0.0.0.0.
Options
python monitor.py --port 9000        # different port
python monitor.py --intervalo 5      # scan every 5s instead of 2 (less disk I/O)
python monitor.py --dias-inicio 30   # preload 30 days before opening, not 7
python monitor.py --raiz ~/.claude/projects --raiz ~/.claude-insiders/projects
python monitor.py --host 0.0.0.0     # exposes it on the network, no authentication
MONITOR_ROOTS=/um,/dois python monitor.py
--raiz is repeatable and sums every root into one panel; a root that does not
exist is simply skipped — the program only fails when none of them exists, and
then it prints every path it searched. Resolution order, most specific wins:--raiz beats MONITOR_ROOTS (comma-separated) beats the historic default~/.claude/projects. The same command-line-beats-environment order applies to--host / MONITOR_HOST (default 127.0.0.1) and --port / MONITOR_PORT
(default 8099).
Project filter, currency, theme and forced refresh live in the toolbar.
Running in Docker
The container needs no dependency step either: it is python:3.13-slim plus the
OS tzdata package, nothing from pip, running as a non-root user.
cp .env.example .env
Open .env and point ROOT_CLI, ROOT_VSCODE and ROOT_INSIDERS at whichever of
your session roots exist on this machine (see the table below). Leave a variable
blank if that client is not installed here — the mount falls back to a checked-in
empty directory, and that root is silently ignored, exactly as a missing --raiz
would be.
docker compose up -d
Open http://127.0.0.1:8099.
Known roots, by client
| Client | Root on the host |
|---|---|
| CLI / terminal | ~/.claude/projects |
| VS Code (stable) | ~/.claude-vscode/projects |
| VS Code Insiders | ~/.claude-insiders/projects |
Claude Desktop is out of scope. Its Claude Code runs inside a VM, so it never
writes a .jsonl transcript to the host — there is nothing on disk for this tool
to read.
HOST_BIND — read this before changing it
.env ships with HOST_BIND=127.0.0.1: only this machine can open the panel.
Changing it to 0.0.0.0 publishes the port to the network, and there is no
authentication in front of it:
With
0.0.0.0and no authentication, any device on the network reads session
titles, project names, folder paths and token volume, and/apianswers any
request. Acceptable on a trusted home network, not acceptable on hotel, airport
or shared-office Wi-Fi.
Publishing the port also usually requires an inbound firewall rule on the host —
Windows Defender Firewall, ufw, or whatever the platform uses. Creating that
rule is the installer's responsibility; this project does not touch firewall
configuration.
TZ
Without it the container runs in UTC and every day on the panel is shifted from
the day you actually worked — a session at 11pm local time can be attributed to
tomorrow. Set TZ to your own zone, e.g. America/Sao_Paulo, so the container's
days match a direct python monitor.py run on the same machine.
What gets mounted, and why only that
Each configured root is mounted read-only, and only the projects folder inside
it — never the whole ~/.claude* configuration directory, which also holds.credentials.json. The container has no business seeing that file, andread_only: true plus a tmpfs at /tmp mean it cannot write to the host at all.
Editing without a rebuild
docker-compose.yml also mounts the host's own monitor.py read-only into the
running container. Edit the file, then:
docker compose restart monitor
applies the change without rebuilding the image — or start the stack withdocker compose up --watch instead, which reloads automatically every time you
save.
hud.html is the exception: it is copied into the image at build time, not
mounted. The host bind carries monitor.py alone, so changing the HUD meansdocker compose up -d --build.
Starting with the machine
docker-compose.yml ships restart: unless-stopped, so once the stack is up it
comes back on its own when the Docker daemon starts — with Docker Desktop, that
means it is already running by the time you log in. The one exception is in the
name: if you stop it deliberately with docker compose stop, it stays stopped
until you start it again. docker compose down is different — it removes the
container entirely, and there is nothing left to restart until the nextdocker compose up -d.
How it works
Every assistant message in the .jsonl carries a usage block with four counters:
| Field | Meaning | Billed at |
|---|---|---|
input_tokens |
new text you sent | 1× input rate |
output_tokens |
what the model generated | output rate |
cache_creation_input_tokens |
context written to cache | 1.25× input rate |
cache_read_input_tokens |
context reused from cache | 0.1× input rate |
Architecture
~/.claude/projects/**/*.jsonl
        │
        ▼
   Coletor ──── incremental read (byte offset per file)
        │
        ▼
   snapshot() ── JSON aggregate
        │
        ▼
   http.server ── GET / → HUD  ·  GET /painel → dashboard  ·  GET /api → snapshot
        │
        ▼
   browser ──── polls /api every 2s
The collector, the dashboard and the server live in one file on purpose. Splitting a
few hundred lines across modules would buy nothing and would cost the curl-and-run
property that makes the tool easy to try. The HUD is the one exception, and only
because it cannot be otherwise: it is compiled, it carries its own fonts, and it
weighs more than everything else combined. It stays a separate optional file so the
single-file promise holds without it.
Two-phase load
The first pass reads only files modified in the last seven days and opens the
dashboard; the rest streams in behind it, newest first. The "already loaded"
boundary is exact, not estimated: a file containing a message from day D must
have been modified on D or later, so finishing every file with mtime >= T
guarantees every day >= T is complete. Days before the boundary are drawn as
still loading rather than claiming no usage.
Three things a naive implementation gets wrong
Each of these has a test:
- Sessions that cross midnight. Consumption is attributed by the timestamp of
each individual message, not by the session's date. Otherwise a session started at
11pm dumps its entire cost into the wrong day. - A partially-written last line. The file is being appended to while you read
it. The collector stops at the last complete line and picks up the rest next pass
— otherwise half a JSON object is silently dropped, taking its tokens with it. - Truncated or rewritten files. If a file shrinks below the stored offset, that
session is reparsed from zero.
Nothing is persisted here
This tool keeps no database and no cache of its own. State lives in memory and is
rebuilt on startup, because Claude Code is already the durable record. Kill it
and reopen it whenever you like; even the 30-minute activity chart comes back, since
the per-minute buckets are derived from timestamps in the files.
Tools and techniques
- Python standard library —
http.serverserves the dashboard,jsonparses
the session files,threadingruns the background scan. No third-party package. - Incremental file reads — a byte offset per file, so a 2-second refresh stays
viable across hundreds of megabytes of history. - Inline HTML/CSS/JS — the page is a string in
monitor.py. No build step, no
CDN, no external font. It renders with the network cable unplugged. - A validated colour palette — the single-series bars use a sequential blue; the
per-task lines use a categorical set checked for colour-vision separation; the
calendar ramp was verified against its surface for contrast in both themes. - GitHub Actions — runs the tests on Python 3.11, 3.12 and 3.13, plus an
end-to-end check that the server boots against a synthetic history and answers.
Reading the numbers
Sort by cache writes, not by input. On the reference machine, real input across
57 sessions totalled 257k tokens — against 88M written to cache and 3.3 billion
read back. A long prompt is almost never the problem; a long session that rewrites
its context over and over is.
Cache reads dominate the token counts and barely dent the bill. They are the
biggest number on screen by two orders of magnitude and the cheapest per token. Use
them to understand how much context is in flight, not to hunt for waste.
The burn rate is the useful alarm. If it spikes while you are doing something
trivial, something oversized is entering the context on every turn.
Where the money goes
Over 18 days on the reference machine, with cost display turned on:
| tokens | API-equivalent | share | |
|---|---|---|---|
| cache read | 3,226M | $1,612 | 64% |
| cache write | 86M | $538 | 21% |
| output | 15M | $378 | 15% |
| input | 0.3M | $1 | 0% |
Two thirds of the figure is context being re-read every turn. Under per-token
billing that is the largest line on the invoice; under a subscription it is what
makes long sessions practical.
Tests and quality
python -m unittest discover -v
Thirty-three tests, all standard library. They exist to protect the claims this README
makes, not to pad a badge:
- the price table matches model ids by prefix, so
haiku-4-5-20251001resolves,
and an unknown model yields no cost rather than a fabricated zero; - the four cost components sum correctly, including the cache multipliers;
- a second read of an unchanged file adds nothing, and an appended line is counted
exactly once; - a half-written final line is neither counted nor discarded;
- a truncated file is reparsed from zero;
- a session crossing local midnight splits across both days;
- your own title outranks the generated one, which outranks the first message;
- a corrupt line does not stop the read;
- the two-phase load stops at the mtime cut and reports the boundary.
CI runs the same suite on three Python versions and then boots the server against a
synthetic history to confirm /, /hud, /painel and /api answer — in the
container too, where /hud doubles as proof that hud.html was baked into the
image.
Privacy
The server binds to 127.0.0.1. It reads files under ~/.claude/projects and
writes none. It makes no outbound request — the page carries no external font,
script, image or analytics, and the exchange rate is typed by you precisely so that
no lookup is needed.
Reading your own files on your own disk is not automated access to any service, so
pointing this at your work does not touch anyone's terms of use.
Current strengths
- Runs from a single file with no install step.
- Opens in about half a second, with the rest of the history streaming in behind.
- Attributes usage to the task names you already recognise.
- Costs are computed from published rates and verified by tests.
- Works offline, in light and dark, on desktop and phone.
- Ships two front ends on one port: a working dashboard and a tablet HUD that
explains itself, with fonts embedded and no outbound request. - Runs in Docker across several session roots at once, read-only, non-root, and
comes back up with the machine.
Limitations and opportunities
- Cache writes assume the 5-minute TTL (1.25× input). A 1-hour TTL costs 2×, so
a workload using it is under-reported. A future version could infer the TTL from
usage patterns. - Subscription plans are not billed per token, so the cost figure is a value
indicator there rather than an amount owed. A plan-aware mode would need data the
local files do not carry. - Models without a price entry show no cost. The footer names them. Adding a
model is one line inPRECOS. - Only Claude Code is read. Other agent CLIs write their own local logs; the
collector could learn their formats. - No history beyond what Claude Code keeps. If those files are pruned, the
numbers go with them.
Roadmap
- Live dashboard with per-task attribution
- Usage calendar with an exact loaded-through boundary
- API-equivalent cost, opt-in, multi-currency
- Test suite and CI on three Python versions
- Docker with multiple session roots in one panel
- Tablet HUD at
/, with scope, project filter and built-in help - Alert when the burn rate crosses a threshold
- Week-over-week comparison
- Export a period to CSV
- Read other agent CLIs that log locally
Contributing — bring your own model
It reads Claude Code today because that is what the author uses. Nothing in the
design is tied to it. The collector parses a local log, sums four counters and
prices them from a table — every agent CLI that writes usage to disk fits the same
shape.
If you use another model or another tool, adapt it and contribute back:
- A new model is one line in
PRECOSat the top ofmonitor.py. - A new log format is one parser.
_consumir()is the only place that knows
what a line looks like; everything downstream works on the four counters. - A different pricing shape — no cache tiers, per-request billing, a flat rate —
fits incusto_usd().
Open an issue describing the tool and where it writes its logs, or send the pull
request straight away. It is open source precisely so it does not have to stay
about one product.
Two constraints the project intends to keep:
- Standard library only. A single file you can
curland run is worth more
than any dependency would add. - Local reads only. No proxying requests, no credentials, no telemetry, no
calling home. This is what makes the tool safe to point at your own work.
Author and license
Built by Claudney Sarti Sessa — design, implementation and documentation.
[email protected]
Released under the MIT License. The licence covers the code in this
repository. Token prices are Anthropic's published rates, reproduced here for
calculation; they are not part of this project and can change without notice.
Not affiliated with Anthropic
This is an independent, community-built tool. It is not affiliated with,
endorsed by, sponsored by or supported by Anthropic. Claude and Claude Code
are trademarks of Anthropic, PBC, used here only to identify the product this tool
reads data from.
Nothing here reverse-engineers, proxies or accesses any Anthropic service. The tool
reads plaintext files that Claude Code writes to your own disk, and makes no network
request of any kind.
The .jsonl session format is an internal detail of Claude Code, not a documented
public interface. It can change at any time without notice, and a change may break
this tool until the collector is updated.
Yorumlar (0)
Yorum birakmak icin giris yap.
Yorum birakSonuc bulunamadi