kubebolt
Health Uyari
- License — License: MIT
- Description — Repository has a description
- Active repo — Last push 0 days ago
- Low visibility — Only 5 GitHub stars
Code Gecti
- Code scan — Scanned 12 files during light audit, no dangerous patterns found
Permissions Gecti
- Permissions — No dangerous permissions requested
This tool provides an instant, web-based monitoring and management platform for Kubernetes clusters. It offers a full visual dashboard, topology maps, and resource insights without requiring agents or complex configurations like Prometheus.
Security Assessment
The application requires access to your local kubeconfig file to interact with your Kubernetes clusters, which is highly sensitive data. It inherently makes network requests to your cluster APIs to retrieve metrics and facilitate features like pod terminals and port forwarding. The automated code scan (covering 12 files) found no dangerous patterns and identified no hardcoded secrets. Because it acts as a direct interface to your infrastructure, you should still carefully review the Docker Compose configuration before exposing it. Overall risk: Medium.
Quality Assessment
The project is licensed under the permissive MIT license, which is excellent for open-source adoption. It was actively updated very recently (last push was today). However, community visibility and adoption are currently very low, with only 5 GitHub stars. Because of this, the tool should be treated as an early-stage project, meaning it may lack the extensive peer review, battle-testing, and rapid community support found in more established tools.
Verdict
Use with caution — the code appears safe, but early-stage adoption and the required access to sensitive cluster configurations warrant a manual review of the repository before deploying in production environments.
Instant Kubernetes monitoring platform — full cluster visibility in under 2 minutes. Go backend + React frontend. Multi-cluster, Gateway API, insights engine, topology map.
⚡ KubeBolt
![]()

Instant Kubernetes Monitoring & Management
Full cluster visibility in under 2 minutes. No agents, no configuration, no Prometheus required. Connect your kubeconfig and go.
Why KubeBolt?
| kubectl | k9s | Lens | KubeBolt | |
|---|---|---|---|---|
| Web-based UI | Yes | |||
| Zero install | Yes | |||
| Multi-cluster | Yes | Yes | ||
| RBAC-aware degradation | Yes | |||
| Pod terminal | Yes | Yes | Yes | |
| Port forwarding | Yes | Yes | Yes | |
| Cluster topology map | Yes | |||
| Insights engine | Yes | |||
| Gateway API support | Yes | |||
| < 70 MB RAM | Yes | Yes |
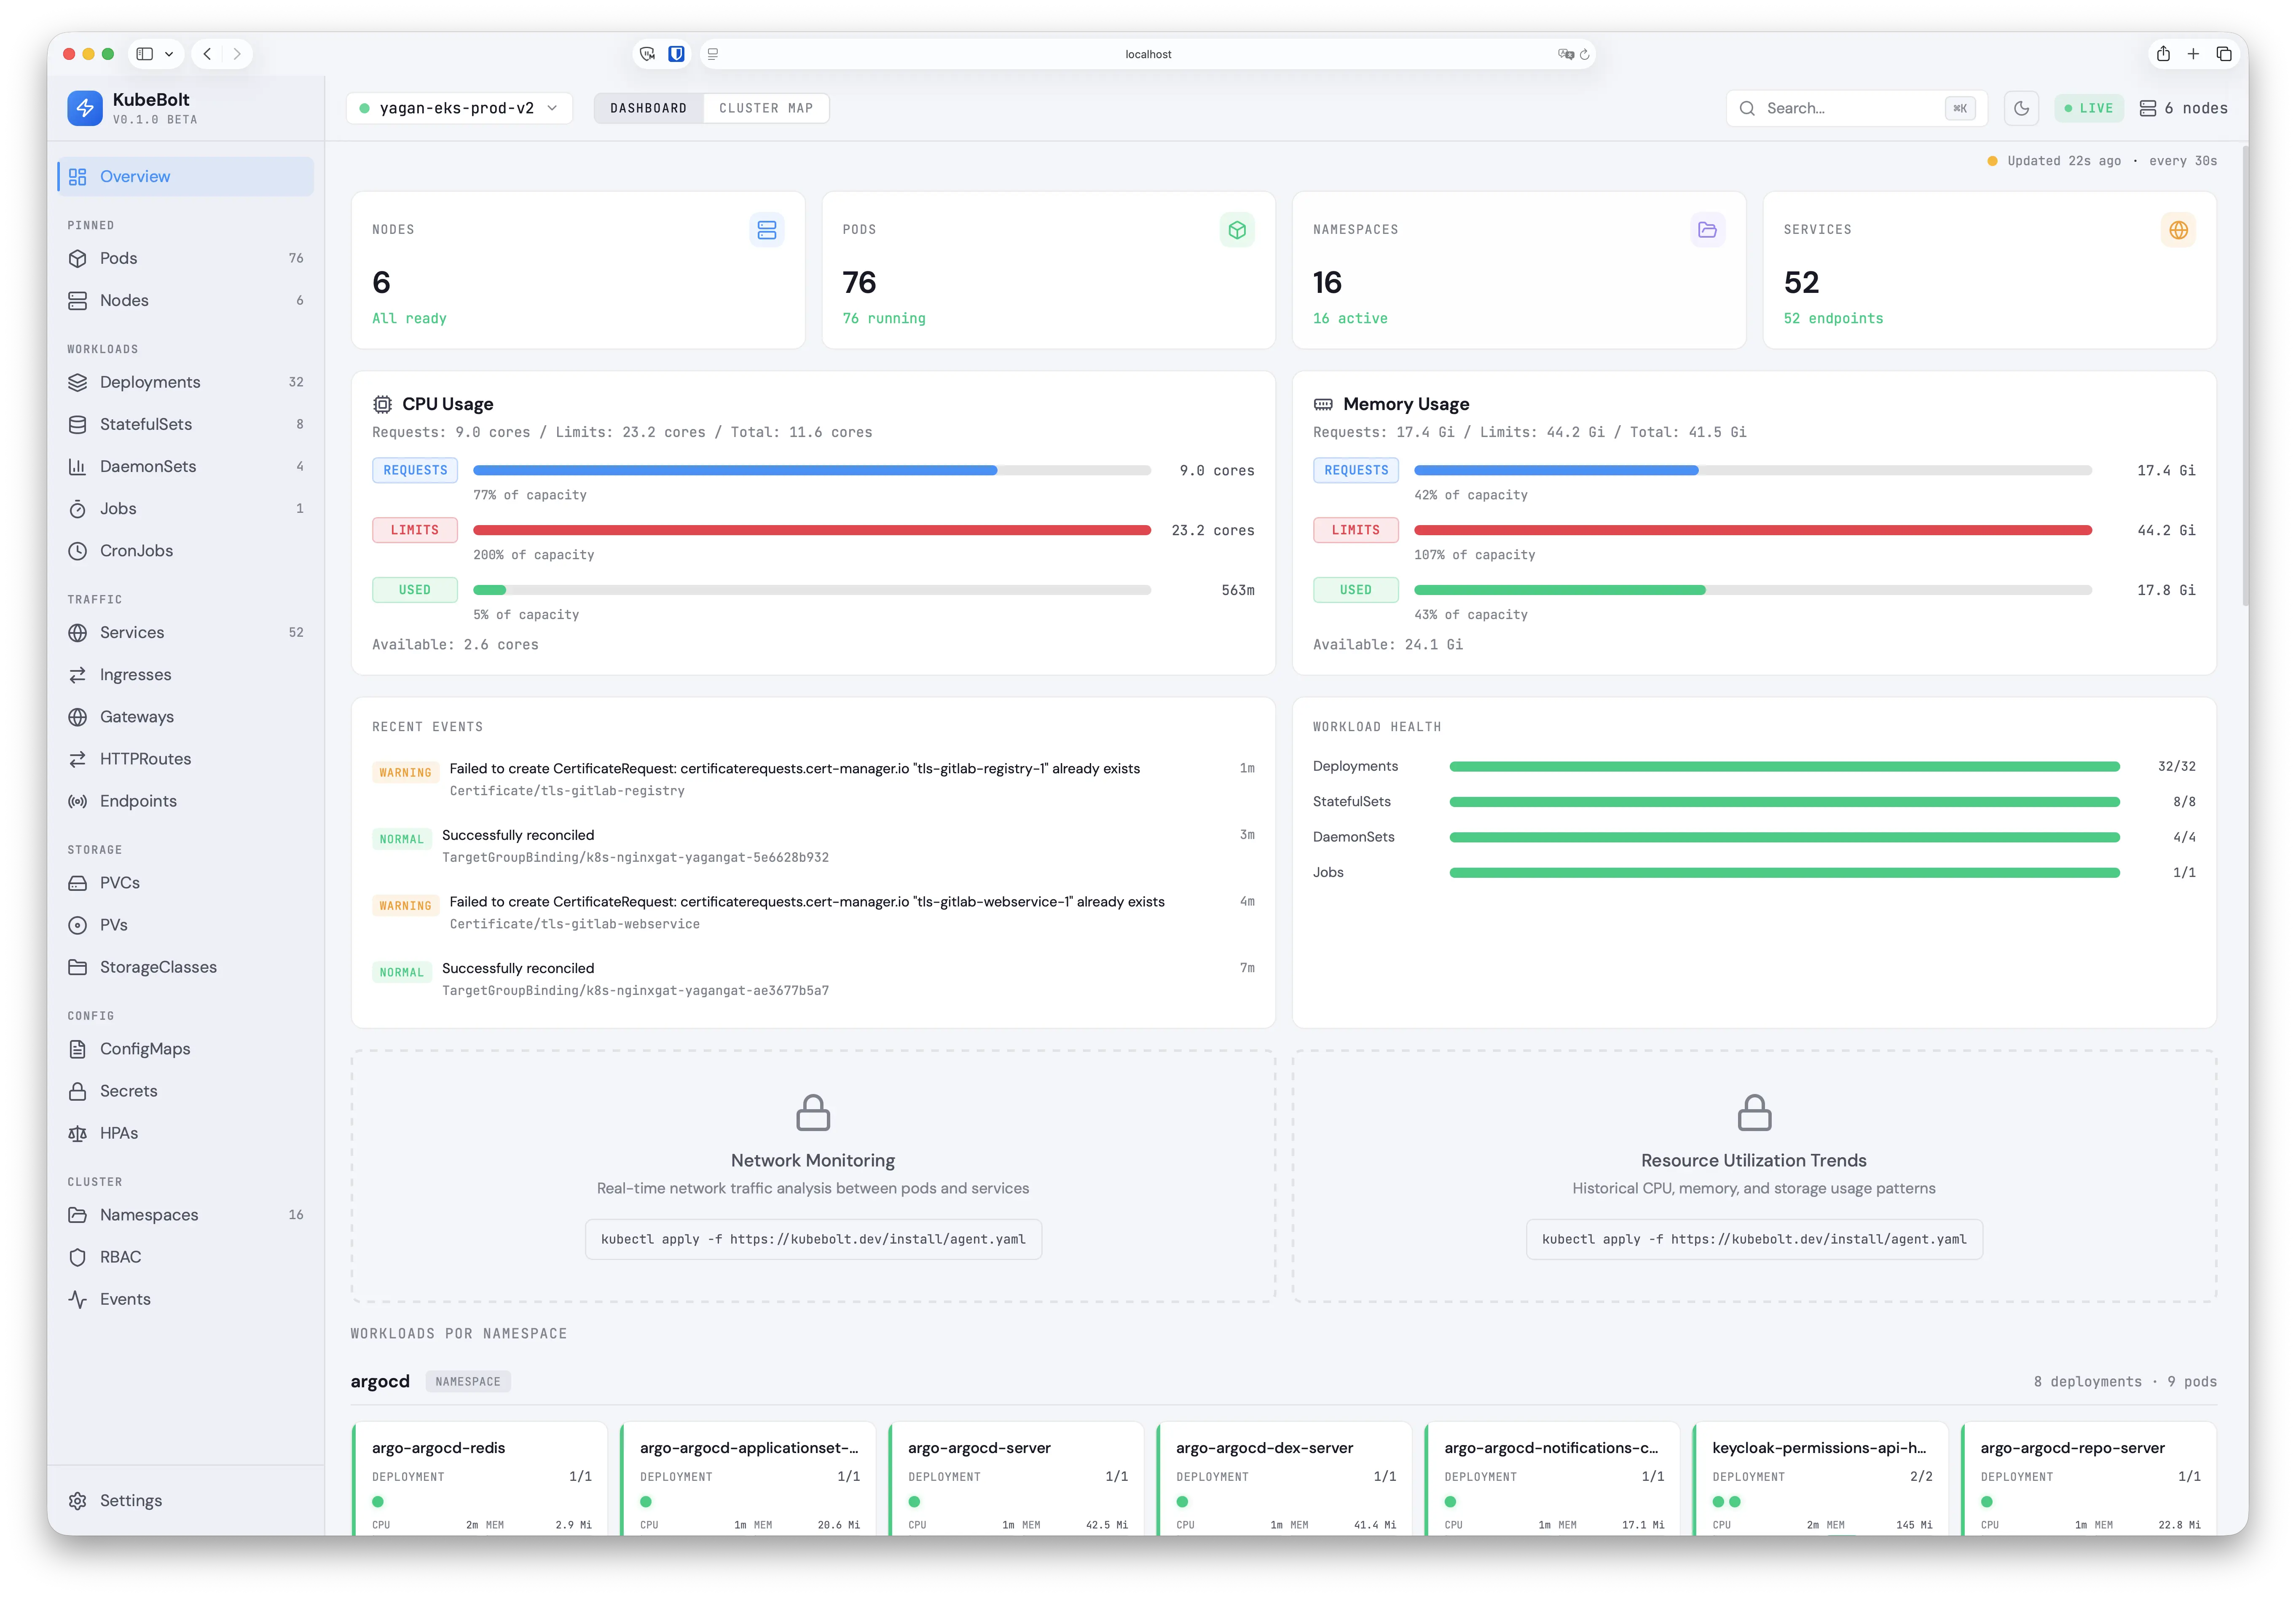
Dashboard Overview
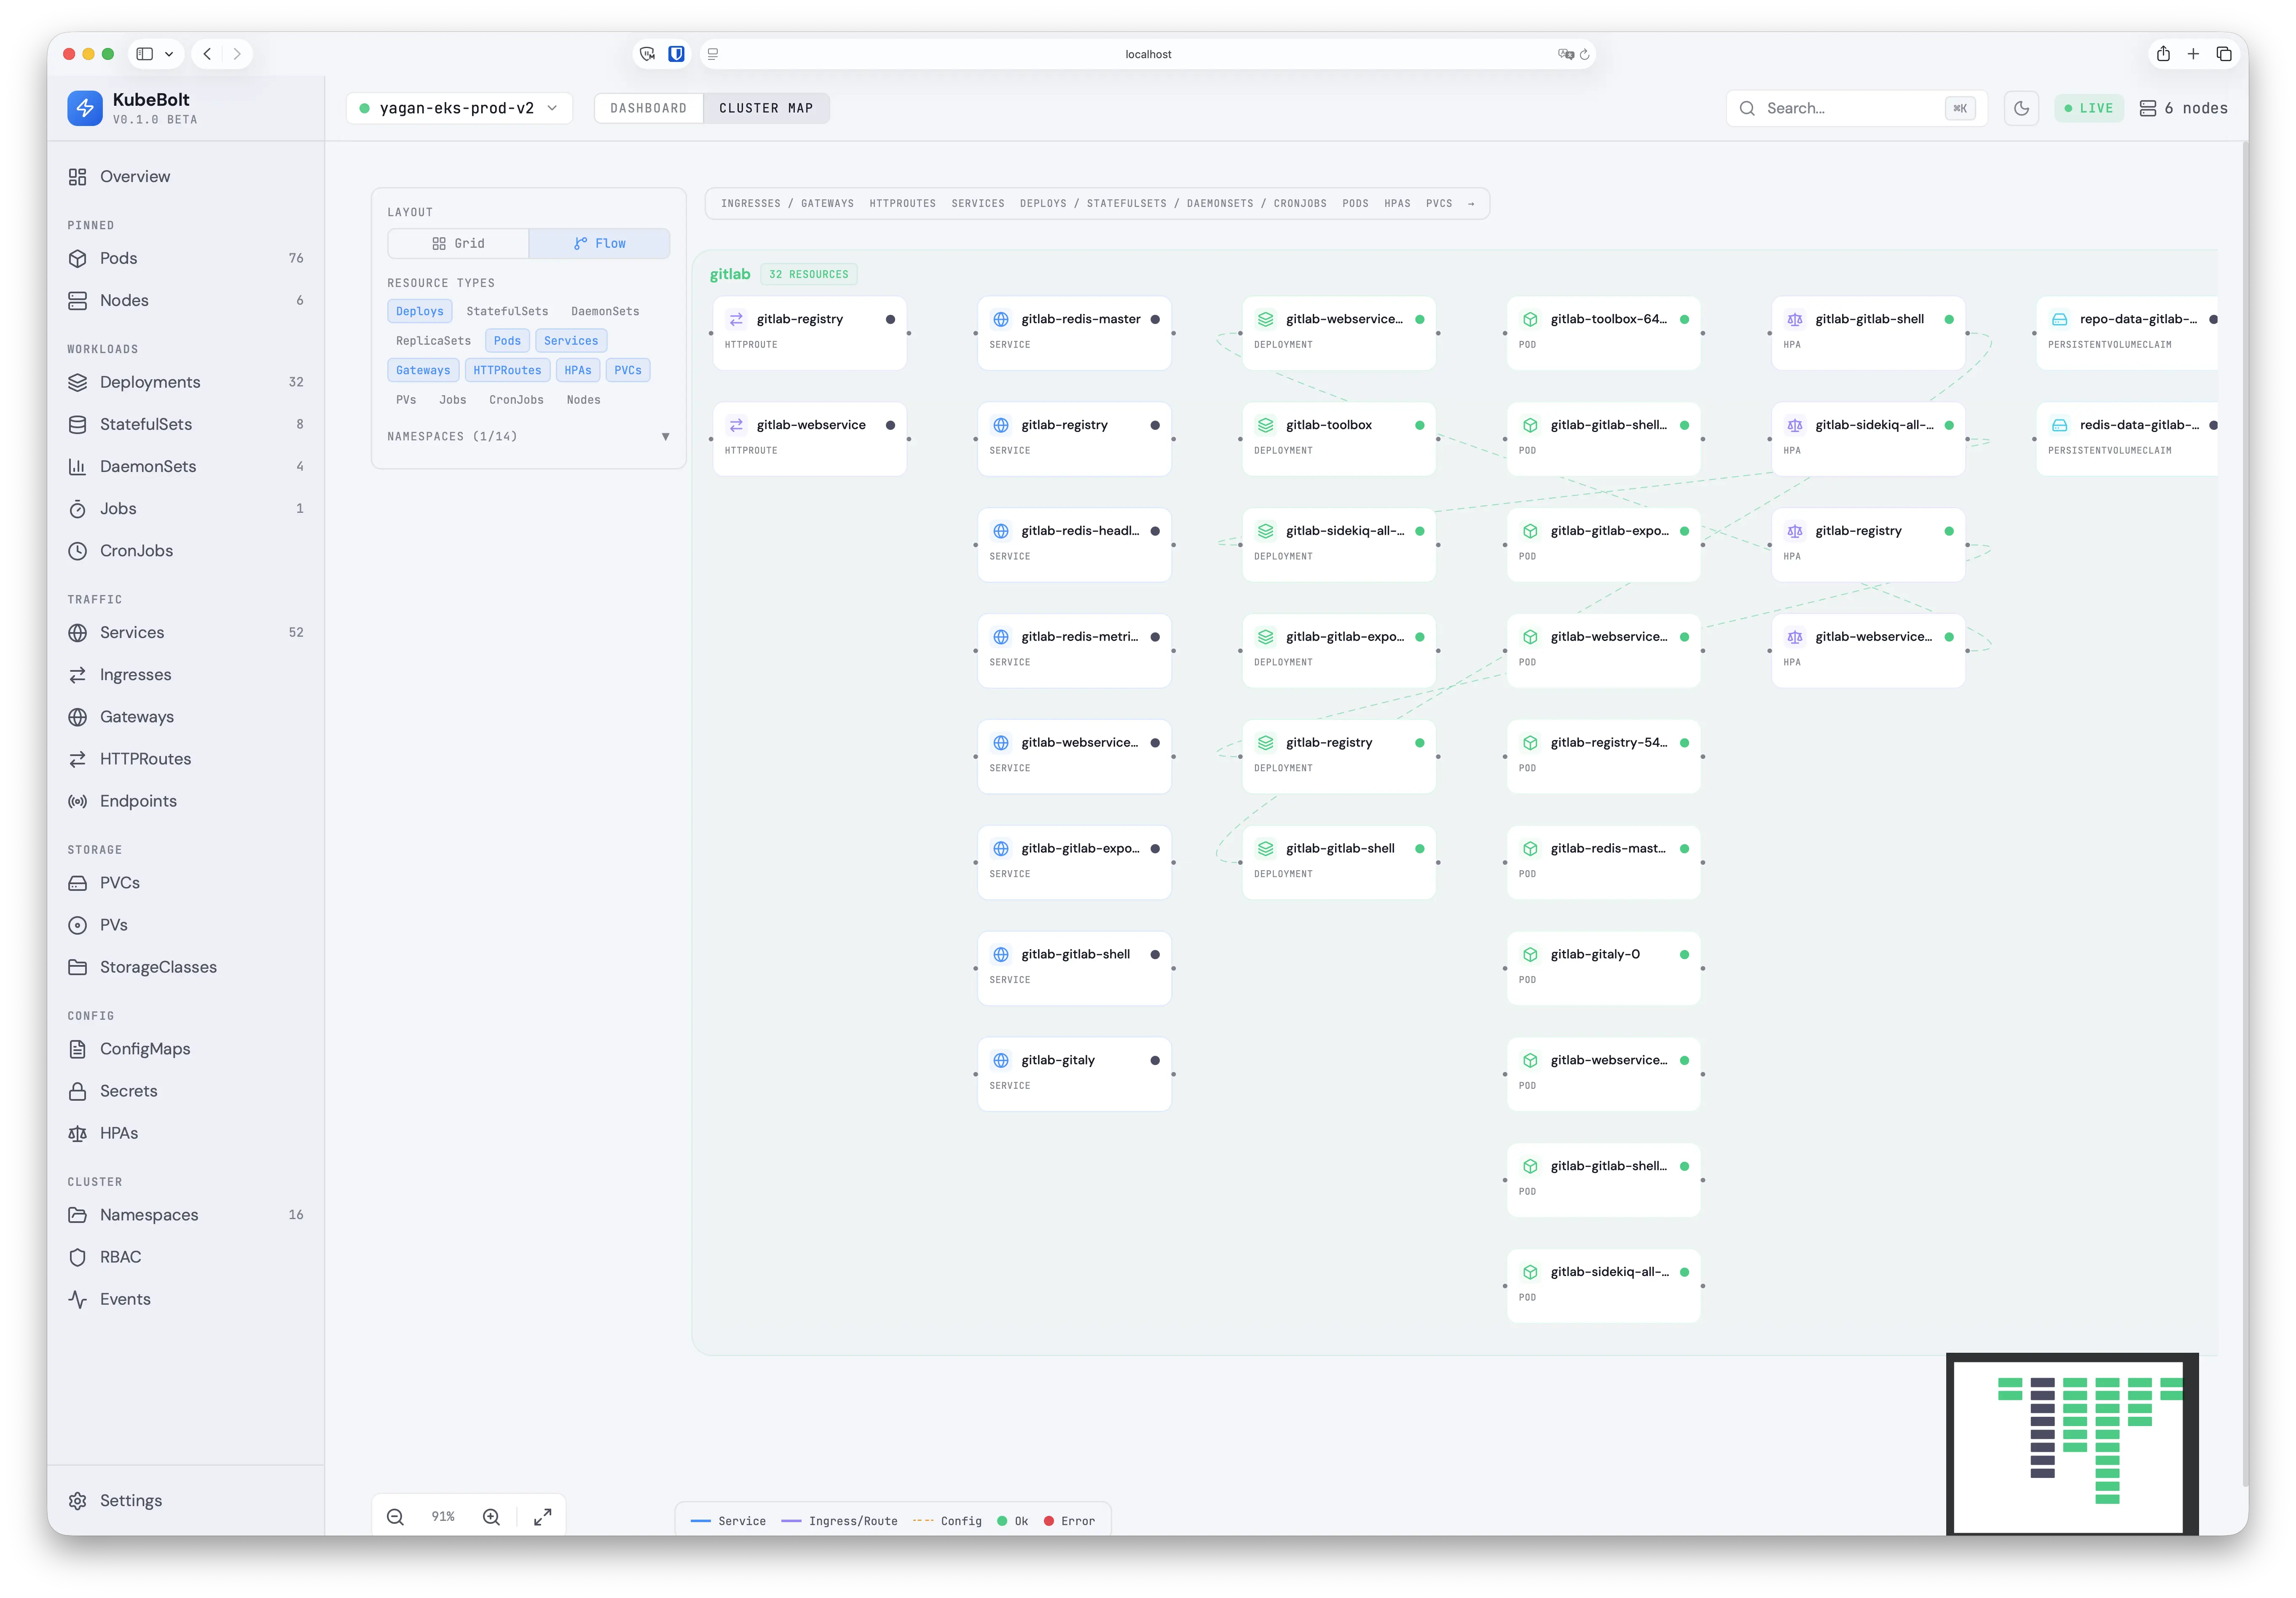
Cluster Topology Map
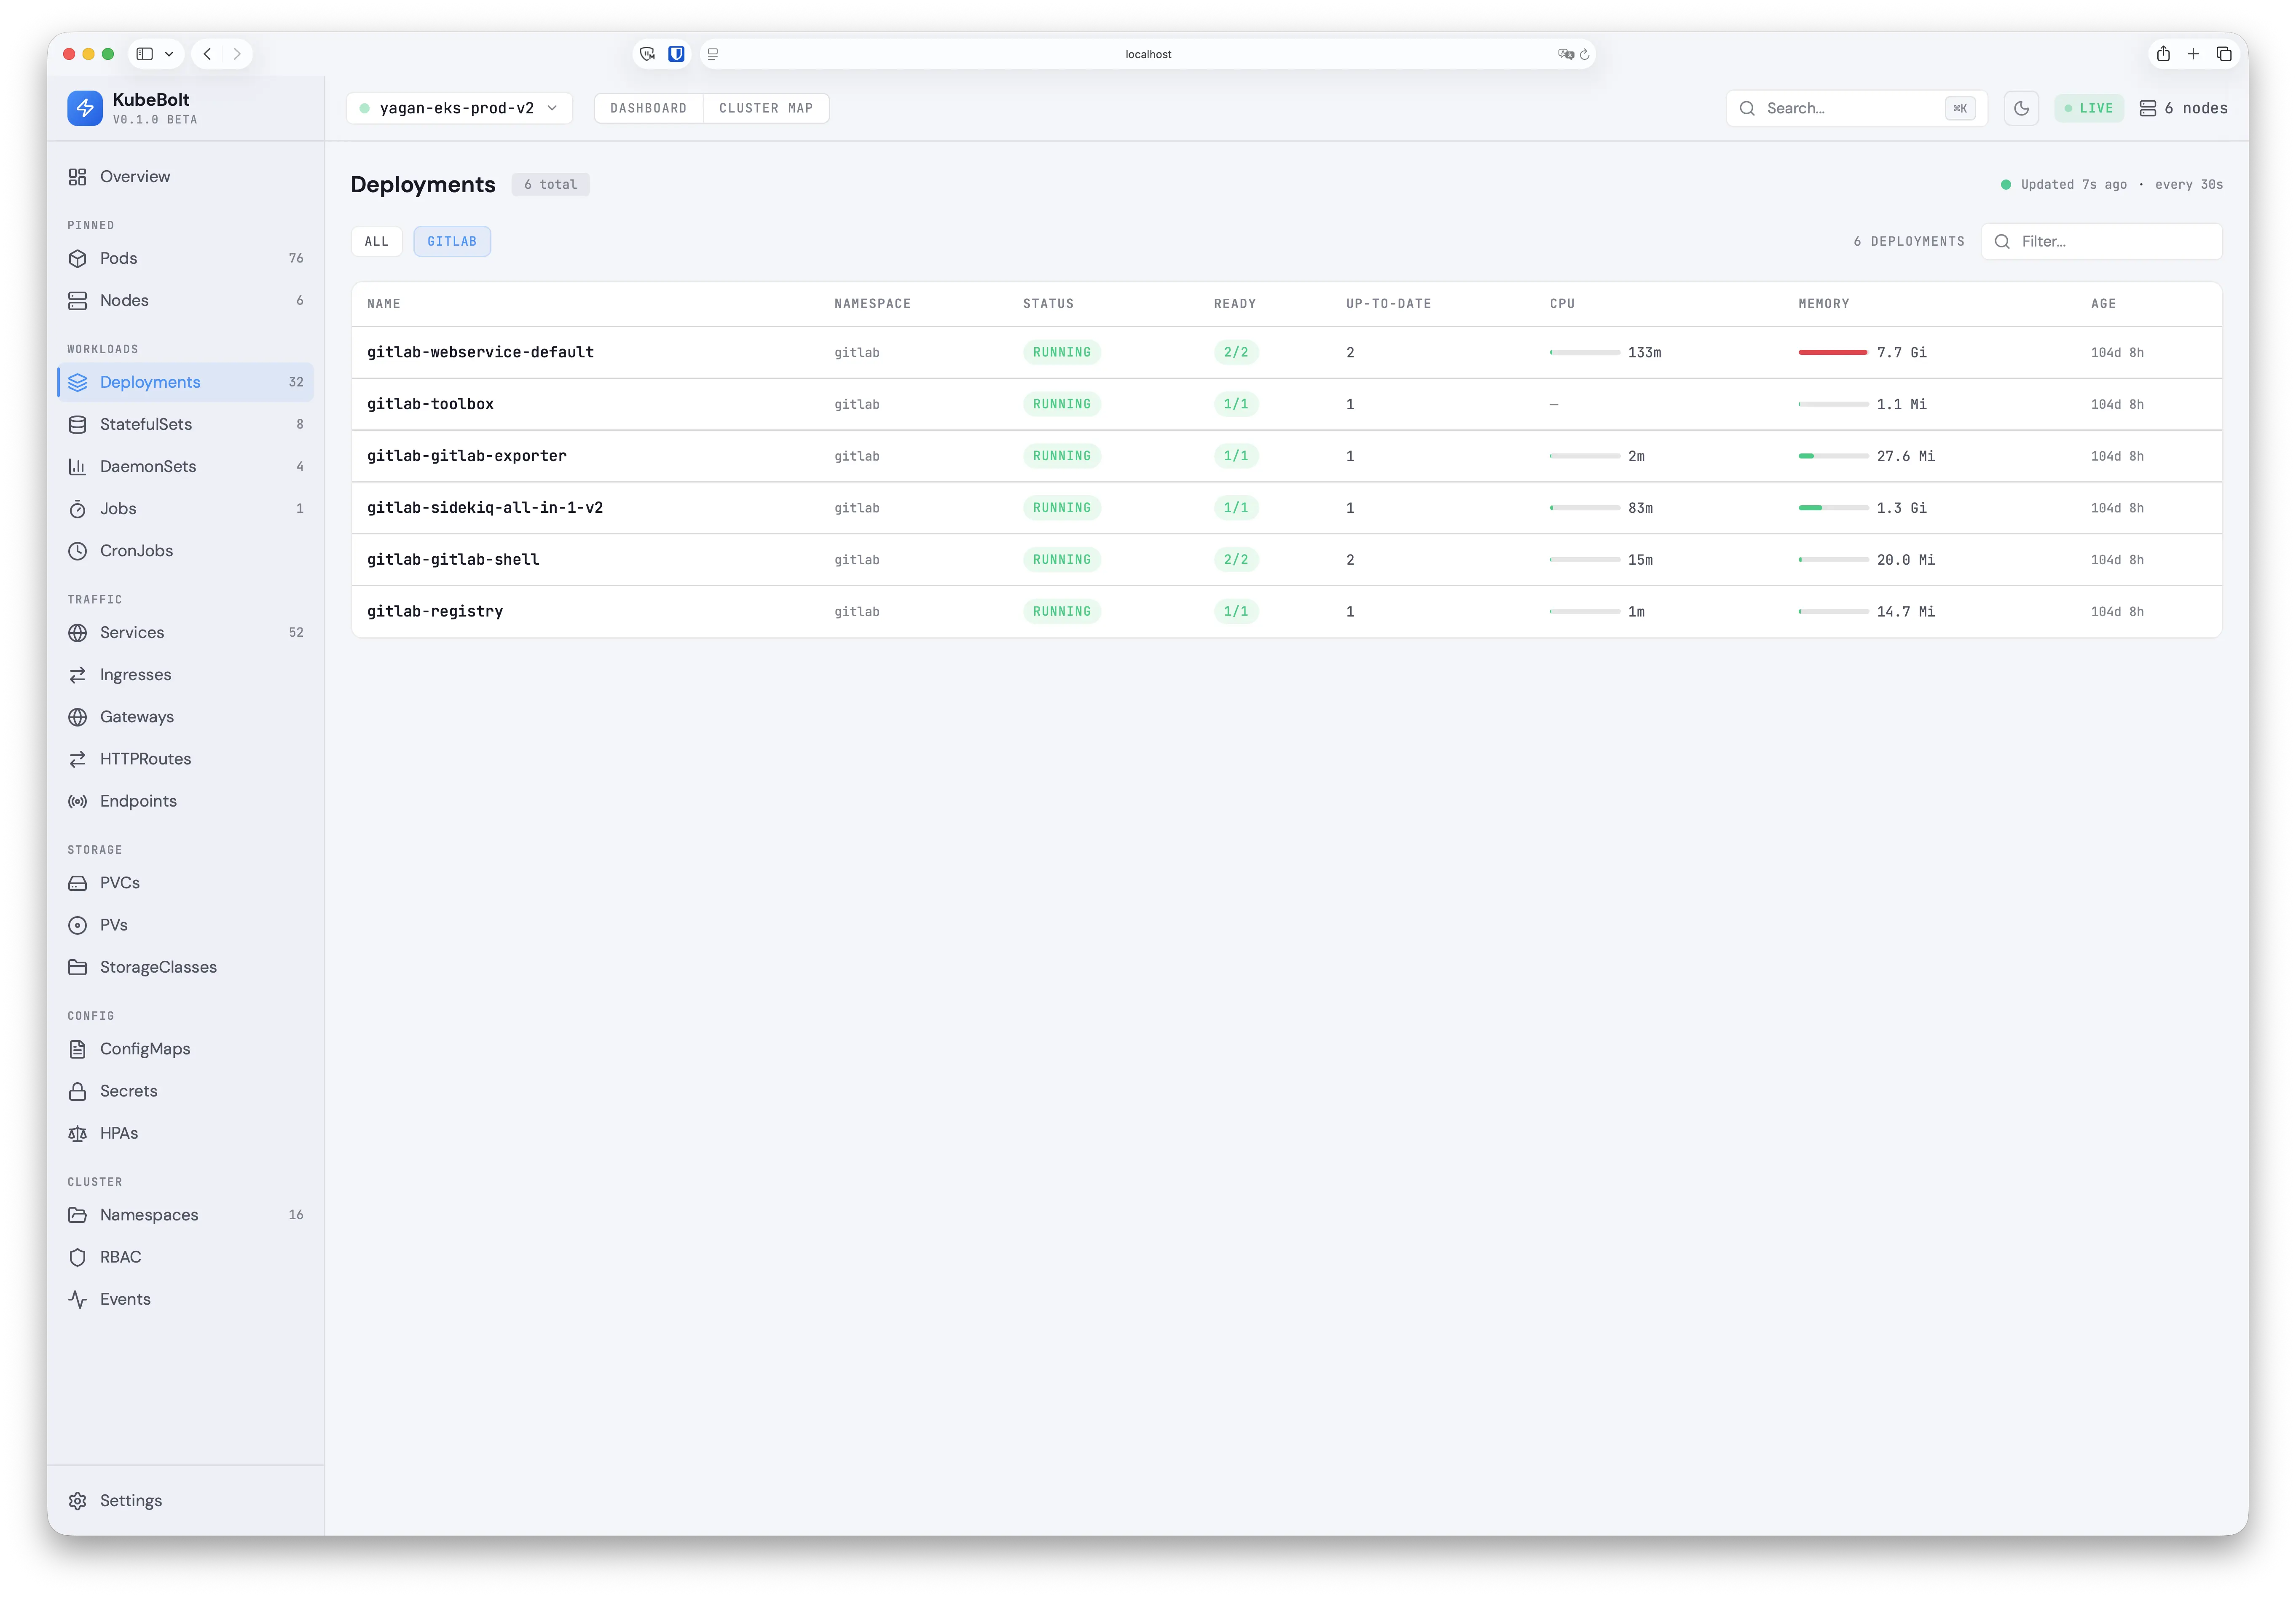
Resource Views with Live Metrics
Quick Start
Option 1: Docker Compose (recommended)
Runs the full stack (Go API + React frontend via nginx) in containers.
Prerequisites: Docker Desktop with a reachable Kubernetes cluster.
Remote clusters (EKS, GKE, AKS, etc.)
If your kubeconfig points to remote cluster endpoints, it works directly:
# Set your kubectl context to the desired cluster
kubectl config use-context my-cluster

# Start the stack
cd deploy
docker compose up -d
EKS note: The API container needs the AWS CLI to obtain tokens. The Dockerfile already includes
aws-cli, and the compose file mounts~/.awsfor credentials. Make sure your AWS profile/SSO session is active before starting.
Docker Desktop Kubernetes
Docker Desktop's built-in K8s uses 127.0.0.1:6443 as the API server address, which doesn't work from inside a container. A helper script rewrites the kubeconfig to use kubernetes.docker.internal instead:
# 1. Enable Kubernetes in Docker Desktop (Settings > Kubernetes > Enable)
# 2. Switch to the docker-desktop context
kubectl config use-context docker-desktop

# 3. Generate a container-compatible kubeconfig
./deploy/docker-kubeconfig.sh

# 4. Start the stack
cd deploy
docker compose up -d
Open http://localhost:3000 — the nginx frontend proxies API and WebSocket requests to the backend.
To stop: docker compose down
To rebuild after code changes: docker compose up -d --build
Option 2: Local development (no Docker)
Requires Go 1.25+ and Node 20+.
# Start the backend
cd apps/api
go run cmd/server/main.go --kubeconfig ~/.kube/config

# Start the frontend (separate terminal)
cd apps/web
npm install && npm run dev
Open http://localhost:5173 — Vite proxies /api and /ws to the backend on port 8080.
Features
Monitoring & Observability
- 23 resource views — Pods, Deployments, Services, Ingresses, Gateways, HTTPRoutes, Nodes, and more
- Cluster Map — Interactive topology with Grid and Flow layouts, namespace grouping, resource type filters
- Live metrics — CPU/Memory usage bars with request/limit markers and hover tooltips
- Insights Engine — 12 built-in rules: crash loops, OOM kills, CPU throttling, HPA saturation, pending PVCs
- Real-time updates — WebSocket-powered live updates via K8s shared informers
- Configurable refresh — Choose refresh interval from 5s to 2m, persisted across sessions
Cluster Management
- Pod Terminal — Interactive shell access from the browser (xterm.js + SPDY exec). Auto-detects bash/sh. Multi-container support.
- Port Forwarding — Forward pod ports with one click. Active forwards shown in Topbar with Open/Stop controls.
- Multi-cluster — All kubeconfig contexts auto-discovered, switch clusters in one click with connection overlay
Security & RBAC
- RBAC-aware — Auto-detects permissions at connect time via SelfSubjectAccessReview
- Namespace-scoped SAs — Works with RoleBinding-only ServiceAccounts using per-namespace informers
- Sensitive data redaction — Secret values always redacted. ConfigMap values with sensitive keys (passwords, tokens, API keys) auto-redacted in YAML view.
- Graceful degradation — Restricted resources dimmed in sidebar, "Access Restricted" pages, "No access" indicators on dashboard cards
Developer Experience
- Gateway API — Native support for
gateway.networking.k8s.ioGateways and HTTPRoutes - YAML viewer — Syntax highlighted with theme-aware colors, works in light and dark mode
- Search & filter — Debounced search across resources with namespace filtering
- Dark/Light mode — Full theme support with CSS custom properties
Architecture
┌─────────────────────────────────┐
│      Kubernetes Cluster(s)      │
│   API Server + Metrics Server   │
└───────────────┬─────────────────┘
                │ kubeconfig (all contexts)
┌───────────────▼─────────────────┐
│   KubeBolt Backend (Go)         │
│   ├─ Permission Probe (SSAR)    │
│   ├─ Shared Informers (gated)   │
│   ├─ Dynamic Client (GW API)    │
│   ├─ Metrics Collector          │
│   ├─ Insights Engine (12 rules) │
│   ├─ SPDY Exec Bridge           │
│   └─ Port Forward Manager       │
└───────────────┬─────────────────┘
                │ REST API + WebSocket
┌───────────────▼─────────────────┐
│   KubeBolt Frontend (React)     │
│   ├─ Dashboard Overview         │
│   ├─ Cluster Map (Grid/Flow)    │
│   ├─ 23 Resource Views          │
│   ├─ Pod Terminal (xterm.js)    │
│   └─ Port Forward UI            │
└─────────────────────────────────┘
RBAC & Permissions
KubeBolt works with any level of Kubernetes access — from full cluster-admin to namespace-scoped read-only ServiceAccounts.
| Access Level | What You See |
|---|---|
| Cluster-admin | Everything — all resources, metrics, insights, terminal, port-forward |
Cluster read-only (ClusterRoleBinding view) |
All namespace resources, no Secrets/RBAC. Restricted items dimmed in sidebar |
| Namespace-scoped (RoleBindings in specific namespaces) | Only resources in permitted namespaces. Metrics polled per-namespace |
At connection time, KubeBolt probes permissions via SelfSubjectAccessReview and adapts:
- Informers only start for accessible resources (no 403 errors in logs)
- Namespace-scoped SAs get per-namespace informer factories with merged results
- UI shows a "Limited access" banner, dims restricted sidebar items, and displays clear "Access Restricted" pages
Tech Stack
| Component | Technology |
|---|---|
| Backend | Go 1.25+ with client-go, Chi v5, gorilla/websocket |
| K8s Client | Shared informers (typed) + dynamic client (Gateway API CRDs) |
| Terminal | SPDY exec bridge + xterm.js |
| Frontend | React 18 + TypeScript + Vite 5 + Tailwind CSS 3.4 |
| Cluster Map | React Flow 11 with custom nodes, edges, namespace group nodes |
| Data Fetching | TanStack Query 5 + TanStack Table 8 |
| Icons | Lucide React |
Performance
| Metric | Value |
|---|---|
| Backend RAM | ~70 MB (production cluster) |
| Frontend bundle | ~560 KB JS + 39 KB CSS (~250 KB gzipped) |
| API response time | < 5ms (from informer cache) |
| Startup time | < 5s (permission probe + informer sync) |
Roadmap
See docs/SPEC.md for the detailed technical specification and roadmap.
Coming next:
- Restart/Scale deployments from the UI
- In-place YAML editing with diff preview
- Resource deletion with confirmation
- Global search (Cmd+K)
- Helm chart for easy distribution
- File browser for pod containers
License
MIT License — see LICENSE for details.
Yorumlar (0)
Yorum birakmak icin giris yap.
Yorum birakSonuc bulunamadi