eliviz
Health Warn
- License — License: NOASSERTION
- Description — Repository has a description
- Active repo — Last push 0 days ago
- Low visibility — Only 7 GitHub stars
Code Fail
- exec() — Shell command execution in skills/html-report/assets/vendor/gsap.min.js
Permissions Pass
- Permissions — No dangerous permissions requested
No AI report is available for this listing yet.
Claude Code plugin: turn any data file into a single-file interactive HTML experience with switchable design identities
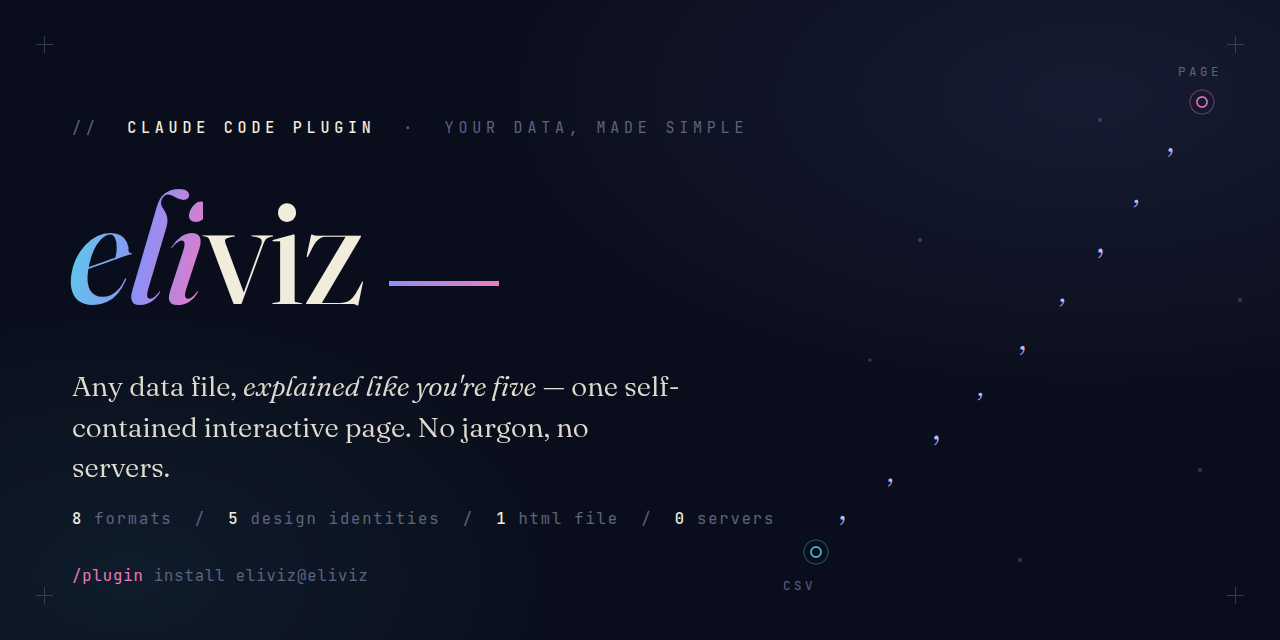



Install in Claude Code — two commands:
/plugin marketplace add costiash/eliviz
/plugin install eliviz@eliviz
You have a CSV, a log file, a SQLite database, a Markdown report. Someone needs to see it — not in a spreadsheet, not in less, but as something you'd actually present. eliviz turns any of those files into one polished, interactive HTML page: animated hero, live stat counters, charts, profiled tables. One file you can email, drop in Slack, or open from a USB stick — no server, no internet required.
New in 1.1: a second output path — static infographics. Ask for "an infographic" or "an image I can share" and eliviz composes a real data story (hero stat, numbered reading path, pictograms, annotations, takeaway) and renders it to a PNG, with the editable HTML source alongside. Three complexity levels — eli5, junior, pro — because a poster for your kid and a briefing for your board are different artifacts.
💬 Usage
Just ask. Examples:
| What you say | What you get |
|---|---|
| "Visualize this CSV" | Auto-profiled interactive page with charts, counters, and a sortable table |
| "Make a viewer for these logs" | Level-filterable log viewer, built for scanning |
| "Turn this report into a page for the board" | Polished document page with outline navigation |
| "Visualize this in our brand colors: #0a2540 and gold" | Custom design pack in your palette, contrast-verified |
| "I want the editorial layout but dark" | A blend — editorial structure, dark treatment |
| "Make an infographic of this sales data" | A static data-story PNG (plus its HTML source) with a hero stat and numbered reading path |
| "A one-pager my interns will actually read" | The same story at eli5 level — pictograms, one idea per card |
| "A briefing image for the exec review" | pro level — dense modules, findings block, formal source line |
🧒 The ELI5 voice — where the name comes from
eliviz = ELI5 + viz. What makes it unique isn't the charts — it's the words around them. Every page speaks in a mandatory plain-English voice ([MODE: ELI5_FOR_DUMMIES], baked verbatim into the skill): a smart 10-year-old could read any label on the page and get it.
So instead of dashboard jargon, generated pages say things like:
"One row = one record" · "A column is like a labeled jar — click it to peek inside" · "A log is a diary your software writes" · "Errors: things that broke" · "Dig in — like folders inside folders"
The hero opens with "Your data, made simple" and defaults to "A simple tour of X. No jargon." The voice is enforced end to end: it's a required section in the skill, an item in the output-expectations checklist, a note in the design spec so template edits keep it, and a guardrail in the design-adapter agent — every generated page complies out of the box.
One deliberate boundary: the rule covers the page's own words only. Your data — column names, cell values, log lines — is never rewritten.
🎨 Design bank
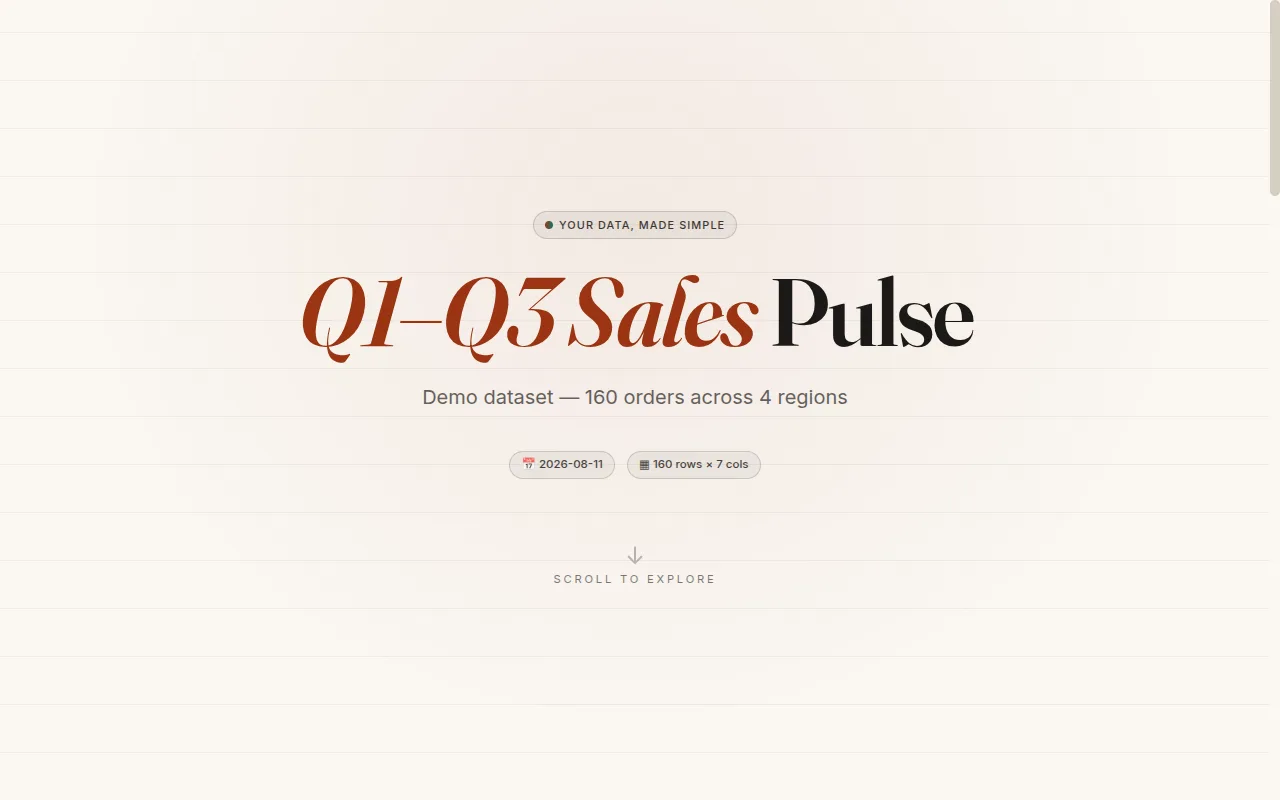
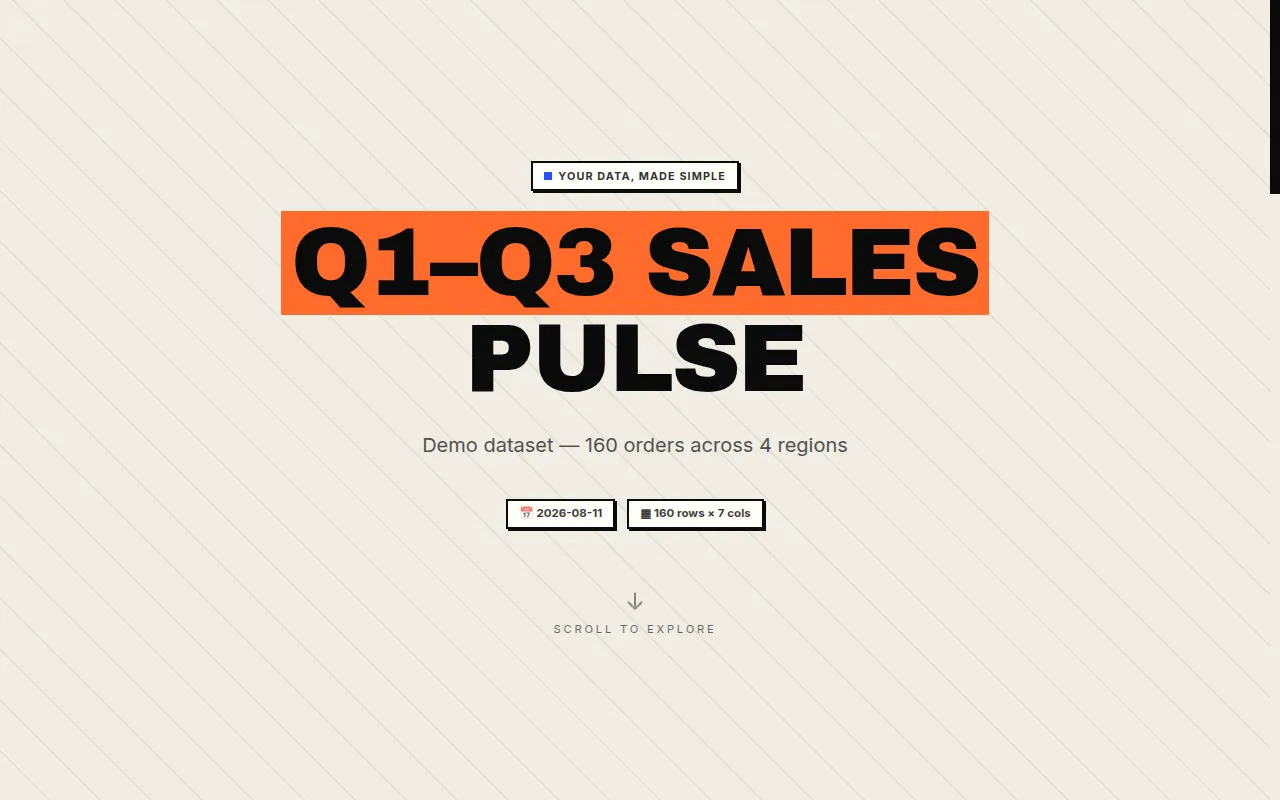
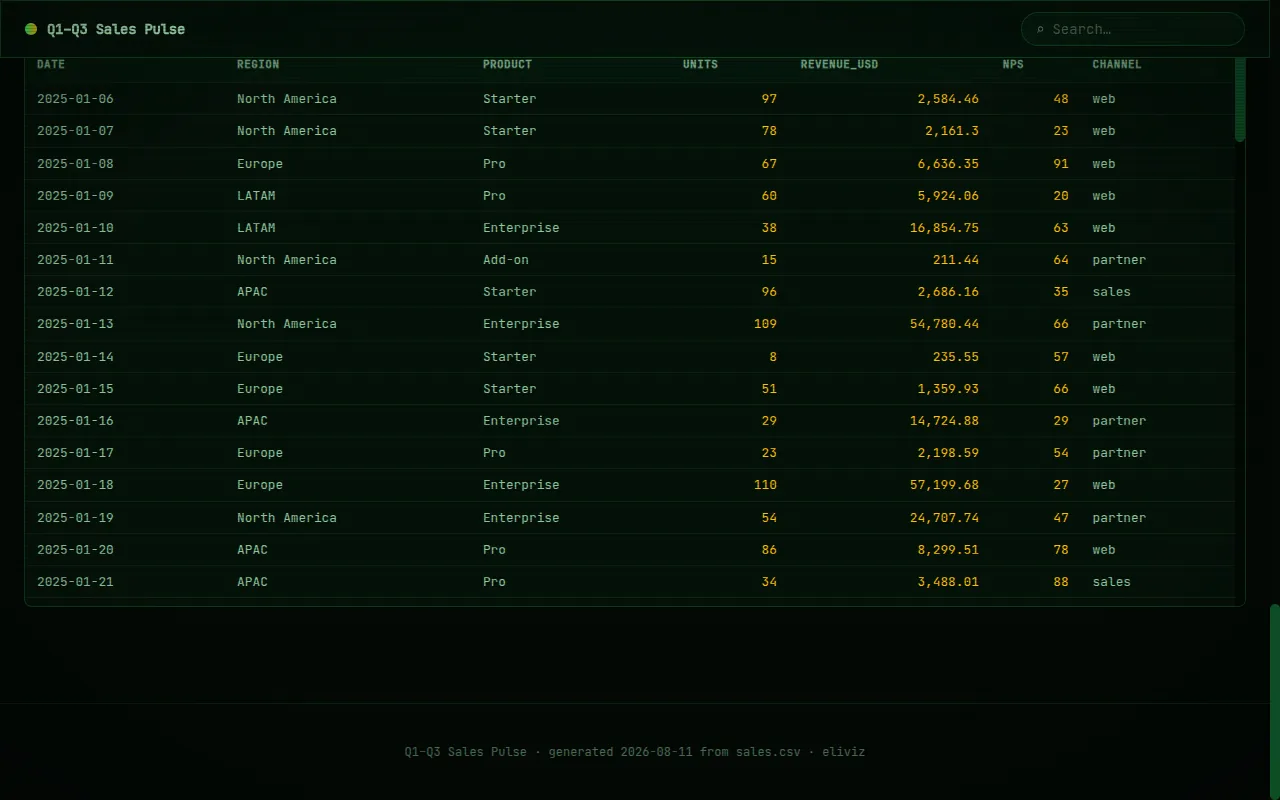
Five identities ship in the bank. eliviz picks one based on your data and how you phrase the request, or you choose with --design <id>. Same dataset ("Q1–Q3 Sales Pulse"), five looks — plus a peek inside the page body:
| 🌌 aurora — dark glass, particle-wave hero (default) | 📰 editorial — warm paper, serif type |
|---|---|
 |
 |
| ⬛ brutalist — hard borders, offset shadows | 🖥️ terminal — phosphor CRT, code-rain hero |
 |
 |
| 🌆 neon — cyberpunk glow, synthwave-grid hero | 🔍 inside every page — columns profiled |
 |
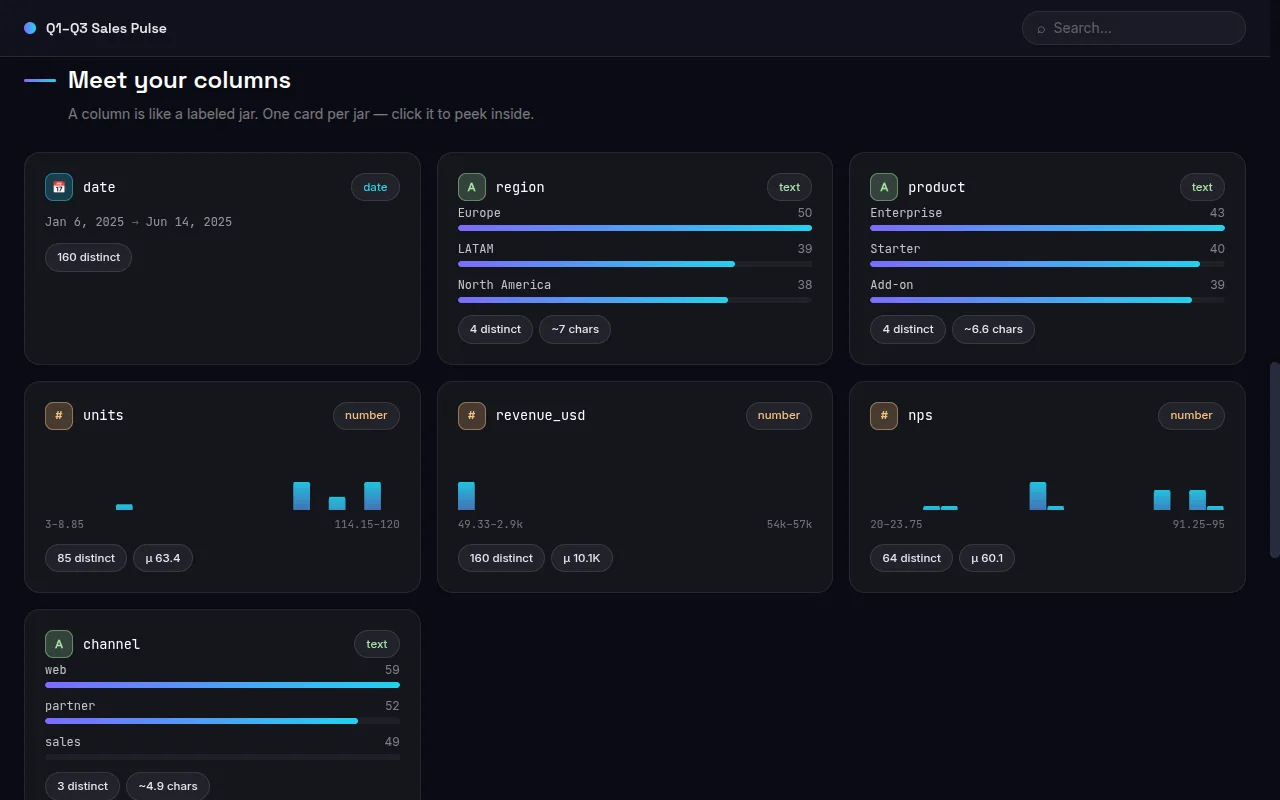 |
Bottom-right: the page body — every column profiled, types detected, distributions drawn. "A column is like a labeled jar."
Want something off-menu? The design-adapter agent builds custom packs — your brand colors, a mood, or a blend of bank styles — and screenshot-verifies contrast before handing the page back.
🖼️ Infographics — static data stories (new in 1.1)
Not every audience wants an interactive page. The infographic skill turns the same data files into shareable images: composed as HTML/SVG, rendered to PNG with headless Chromium — no image-generation APIs, fully offline, and every number on the canvas is computed deterministically from your file (the narrative agent selects numbers; it never invents or computes them).
The complexity level is chosen first, because a 10-year-old's explainer and a board briefing are different artifacts — same dataset, three registers:
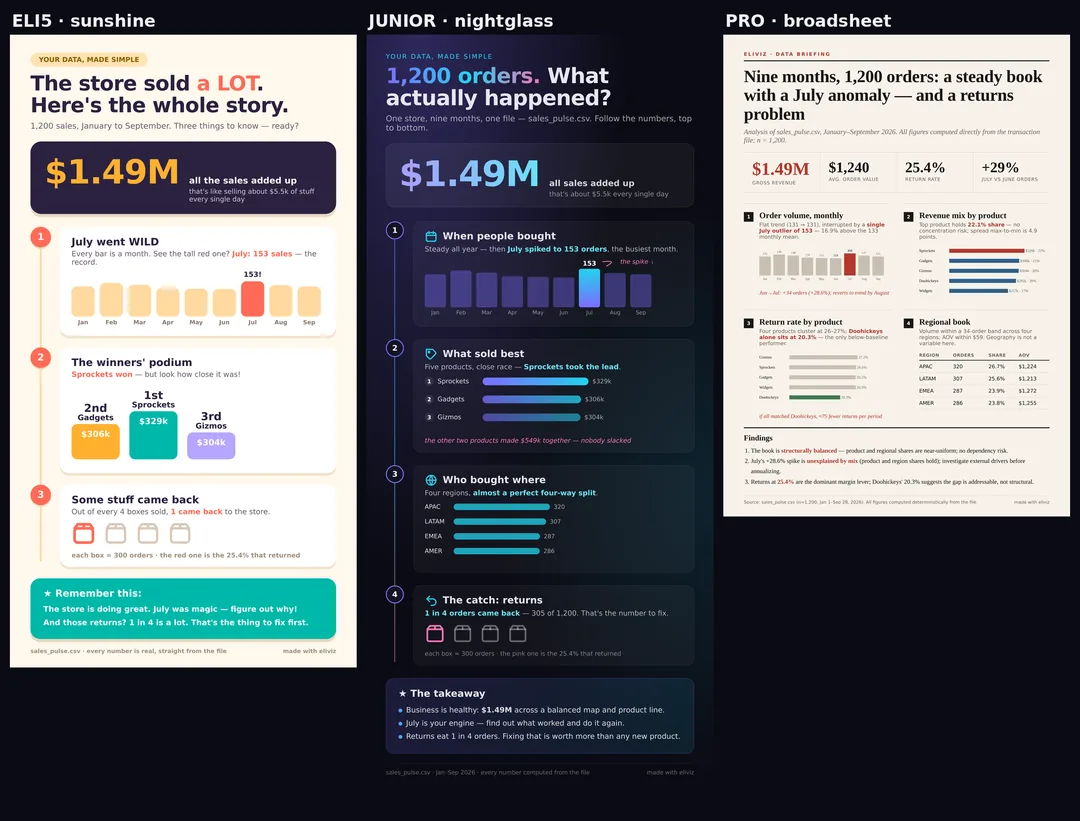
| 🧒 eli5 · sunshine | 🌃 junior · nightglass | 📊 pro · broadsheet | 🛡️ verdict-card |
|---|---|---|---|
 |
 |
 |
 |
| pictograms, one idea per card | the clean-modern default | data-journalism briefing | the "report-card" grid |
Click any card to open the full live version — each one is the real, self-contained HTML the PNG is rendered from.
Under the hood: six layout templates (journey-spine, verdict-card, broadsheet-brief, bento-grid, badge-map, neon-blueprint), a level-keyed design bank, and an infographic-director agent that writes the story brief from the parser's numbers. Rules that never bend: one hero stat, a single numbered reading path, fixed color semantics (green=pass, amber=caution, red=risk), a source strip on every canvas — and you always get both the PNG and its editable HTML source.
✨ Features
- ELI5 voice — all page copy passes the "smart 10-year-old" test; your data itself is never touched
- Any input — CSV, TSV, Excel, SQLite, JSON/JSONL, Markdown, plain text, logs
- One file out — GSAP, three.js, and Tailwind inlined; fully offline-capable (
--cdnfor smaller files) - Animated hero — three.js particle field with GSAP-driven entrance
- Stat counters & SVG charts — key numbers animate in, charts built from your actual data
- Column-profiled tables — sortable, with per-column type detection and distribution cards
- Outline reading view — Markdown and text documents become navigable pages
- Log viewer — level-filterable, built for scanning
- Deterministic parsing — bundled Python, stdlib only (openpyxl needed just for Excel)
- Five design identities — auto-picked per dataset, or forced with
--design <id> - Design-adapter agent — custom packs from brand colors, moods, or blends of bank styles, screenshot-verified for contrast before delivery
- Static infographics (new) — real data stories rendered to PNG + editable HTML, three complexity levels, level-keyed style packs, six layout templates
- Infographic-director agent (new) — writes the narrative brief; every number copied verbatim from the parser, never computed downstream
⚙️ How it works
One bundled Python parser (stdlib only, shared by both skills) reads your file deterministically and profiles every column — including group-by aggregates, so no number is ever computed by a language model. For pages, Claude composes the interactive HTML around a design identity from the bank. For infographics, the infographic-director agent writes a story brief from the parser's numbers, Claude composes the poster from a layout template and a level-keyed style pack, and headless Chromium renders it to PNG at measured height.
▶️ Live demos
Click, don't clone: everything below is live on GitHub Pages, rendered from the same demo dataset.
Interactive report, five designs:
| 🌌 aurora | 📰 editorial | ⬛ brutalist | 🖥️ terminal | 🌆 neon |
Infographics, three levels + one template showcase:
| 🧒 sunshine (eli5) | 🌃 nightglass (junior) | 📊 broadsheet (pro) | 🛡️ verdict-card |
or browse them from the demo gallery. Prefer the fully-offline single-file versions (all libraries inlined, ~1.6 MB each)? They're attached to the latest release — download one, open it anywhere, no internet needed.
📄 Requirements & license
- Python for parsing — standard library only;
openpyxlis needed only for Excel files;playwright(pluspython -m playwright install chromium) is needed only for infographic PNG rendering. - MIT licensed. Generated pages inline vendored libraries under their own terms: GSAP (standard license), three.js (MIT), Tailwind CSS (MIT).
Reviews (0)
Sign in to leave a review.
Leave a reviewNo results found