culprit-sql-studio
Health Uyari
- License — License: MIT
- Description — Repository has a description
- Active repo — Last push 0 days ago
- Low visibility — Only 5 GitHub stars
Code Basarisiz
- rm -rf — Recursive force deletion command in .github/workflows/release.yml
Permissions Gecti
- Permissions — No dangerous permissions requested
Bu listing icin henuz AI raporu yok.
Find what's slowing your database down: a free desktop app, CLI and MCP server for SQL Server, PostgreSQL, MySQL and MariaDB performance (slow queries, execution plans, indexes, blocking, deadlocks).

Culprit SQL Studio
Find out what's slowing your database down, and exactly how to fix it.
A fast desktop app and CLI for SQL Server, PostgreSQL, MySQL and MariaDB, on macOS, Linux and Windows.
Plain-language answers for people. Safe, structured access for coding agents.





culpritsql.com · Why Culprit · What you get · Coding agents · Safety · Get started · Guide
Why Culprit
When a database gets slow, someone has to dig through Query Store, wait statistics, plan caches and execution plans to find out why. That takes an expert, an afternoon and a handful of tools that each show a piece of the picture.
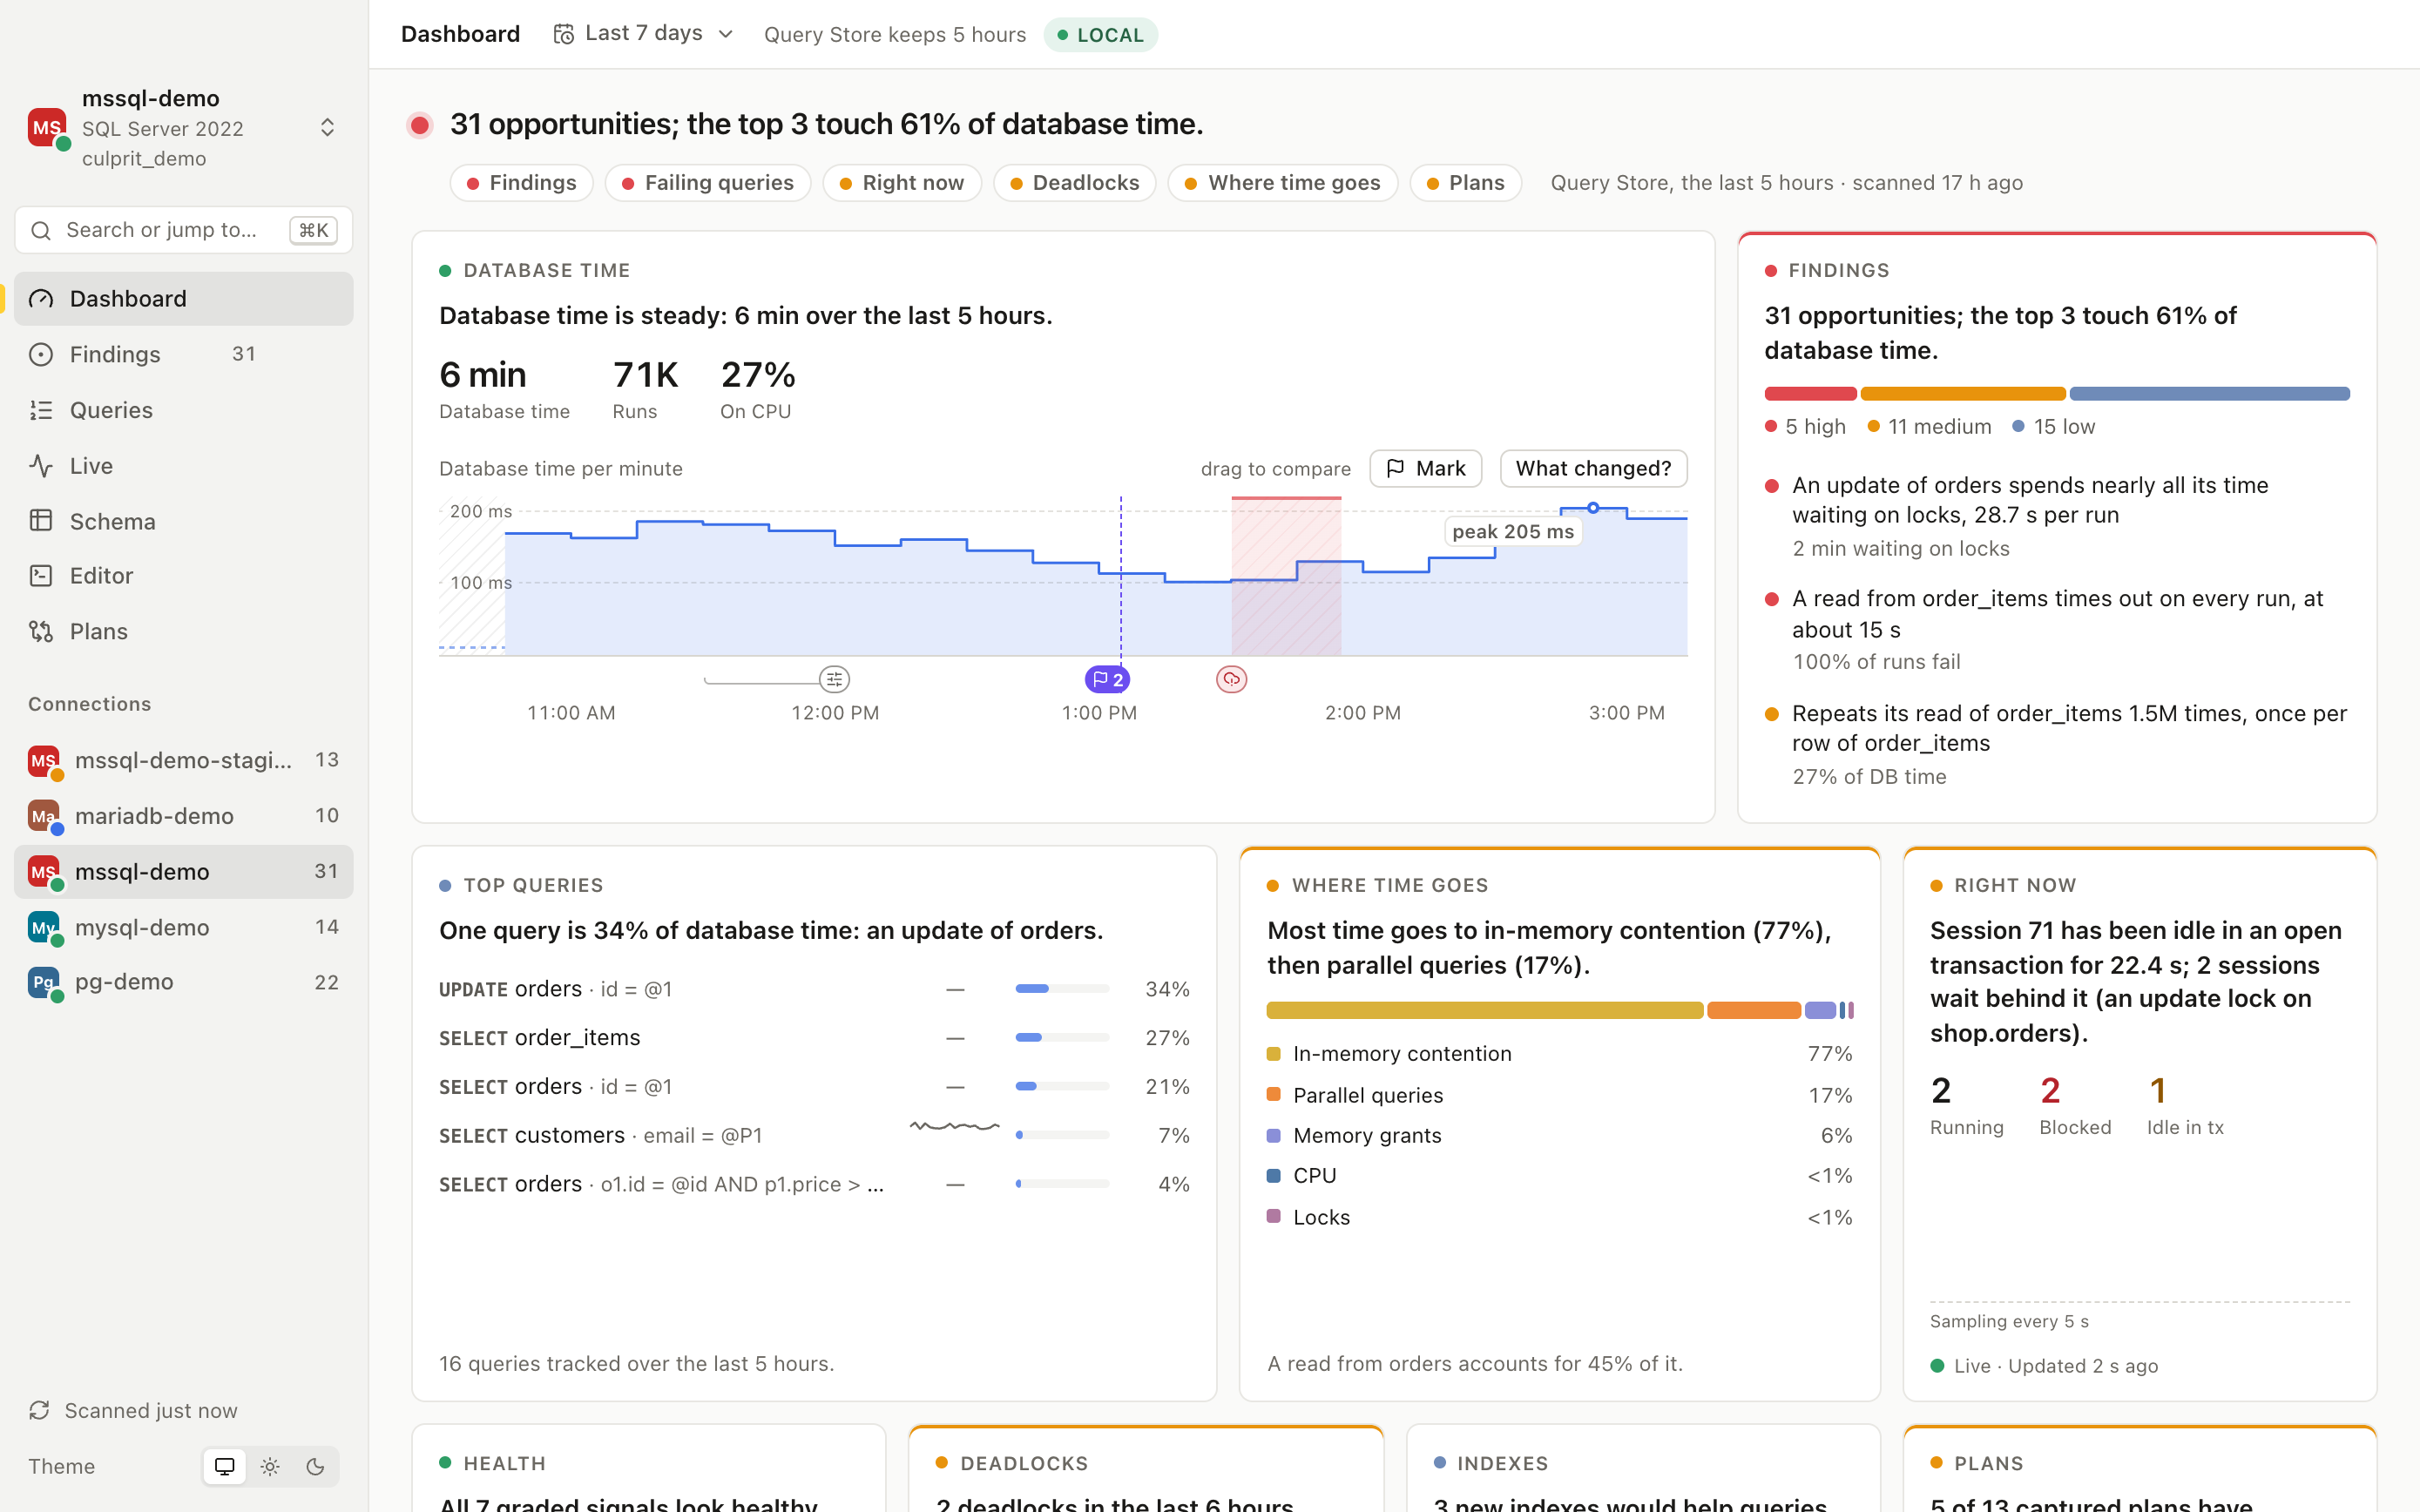
Culprit does the digging in seconds. It reads the statistics your database already keeps, works out where the time goes, and tells you in one sentence what is wrong, what it costs and what to change:
Repeats its read of
order_items1.5M times, once per row oforder_items.
27% of database time, and it times out on every run · Fix: the query forces a loop join; remove the hint and let the optimizer choose · Verify: run it with actual rows: a hash join, or far fewer executions oforder_items.
|
🎯 Answers, not raw numbers Every finding is ranked by its share of database time and comes with the evidence, a production-safe fix and a way to prove it worked. |
🛡️ Safe on production Scans read statistics only and never run your queries. Anything that would change data on a production database asks first. |
🤖 Built for coding agents An MCP server, JSON output everywhere and per-connection permissions let Claude Code, Cursor or Codex investigate with you. Every call is approved and audited. |
|
⚡ Fast and light A 14 MB app that opens in under a second and shows the last report instantly while a fresh scan runs in the background. |
🧭 One tool, four engines The same views, wording and workflow on SQL Server, PostgreSQL, MySQL and MariaDB. When an engine can't show something, Culprit says why in one sentence. |
🔌 Open and pluggable Add your own checks or database engines without forking. The app, the CLI and the agent tools share one Rust core. |
What you get
Findings you can act on
51 checks look for what actually costs time: runaway loops in plans, plan regressions, missing and unused indexes, N+1 query loops, type mismatches that block indexes, parameter-sensitive plans, queries that fail or time out, spills to disk, hot rows, statements that lock a whole table, slow storage, connection storms, replication lag, stale statistics, risky settings and more. Each finding names the queries involved, shows their share of database time, and ends with a fix you copy (Culprit never applies it for you) and a way to verify it.
Plans that explain themselves
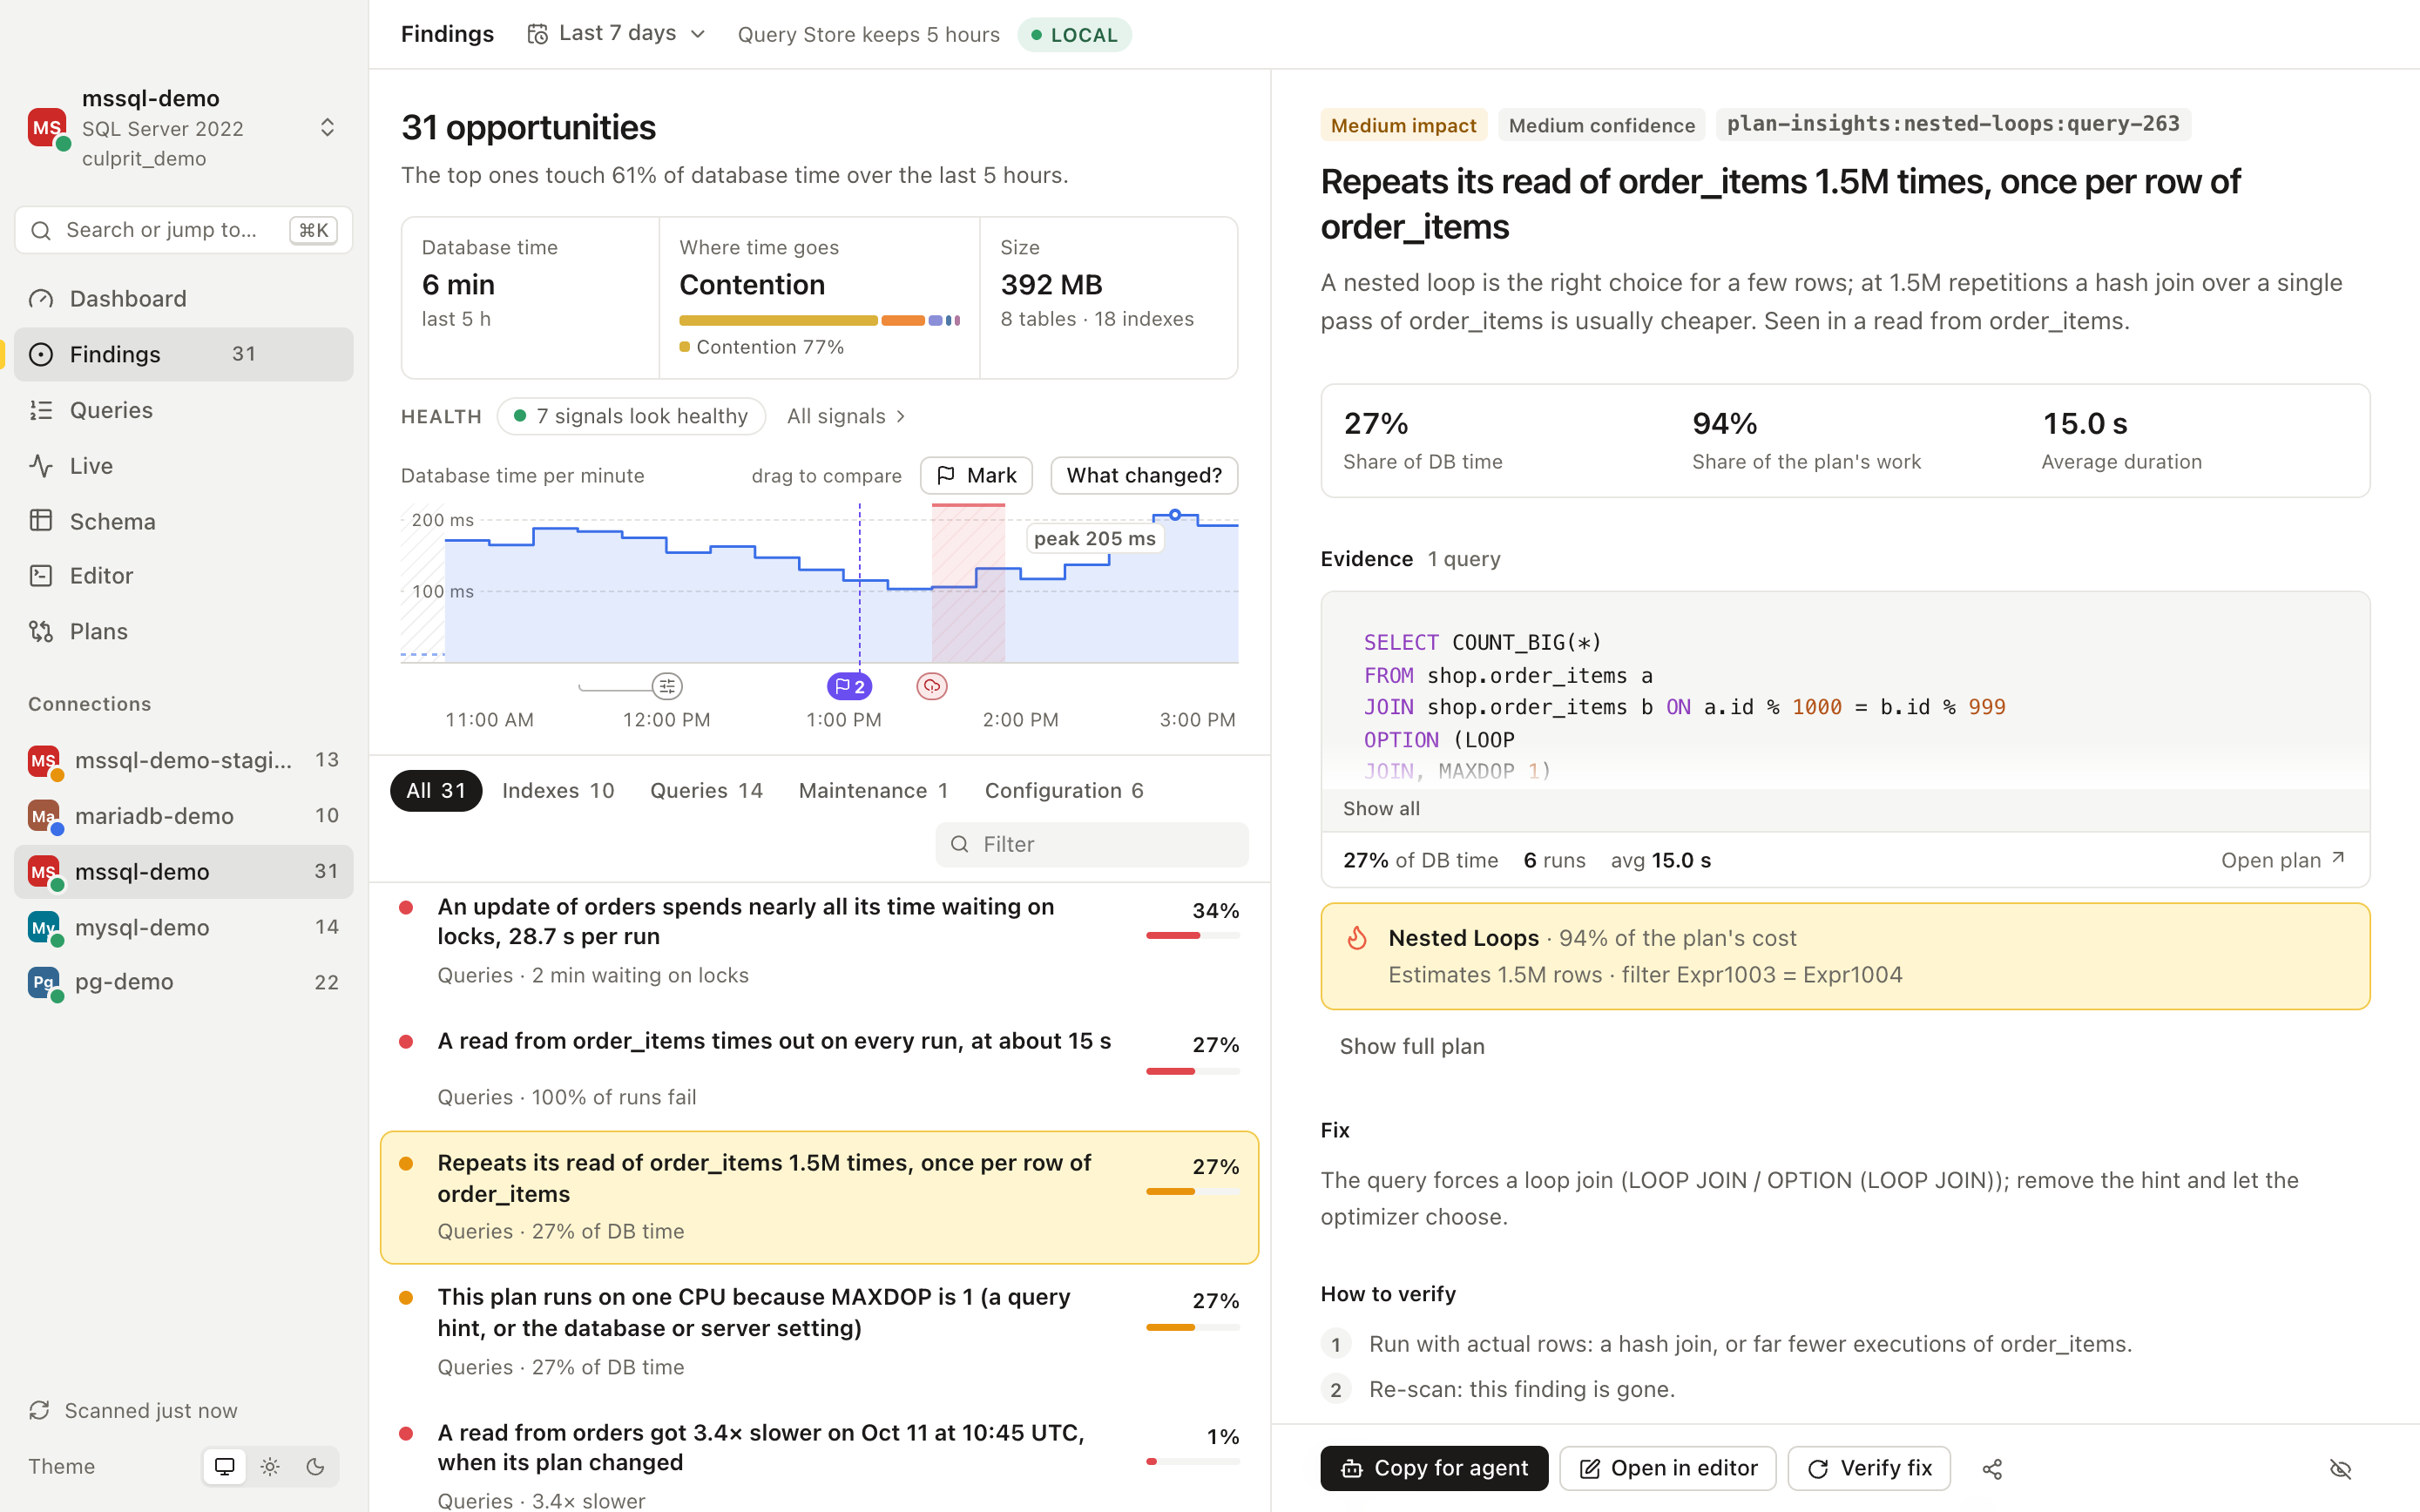
Every captured plan comes with insights in plain words ("repeats its read of order_items 1.5M times, once per row"), a diagram that shows where the cost goes, and the operator's details one click away. 32 rules cover SQL Server, PostgreSQL and MySQL plans. Measure a run safely (writes are rolled back), and on SQL Server see the last actual plan without re-running the query or watch a long query's progress step by step.
"What changed?" in one drag
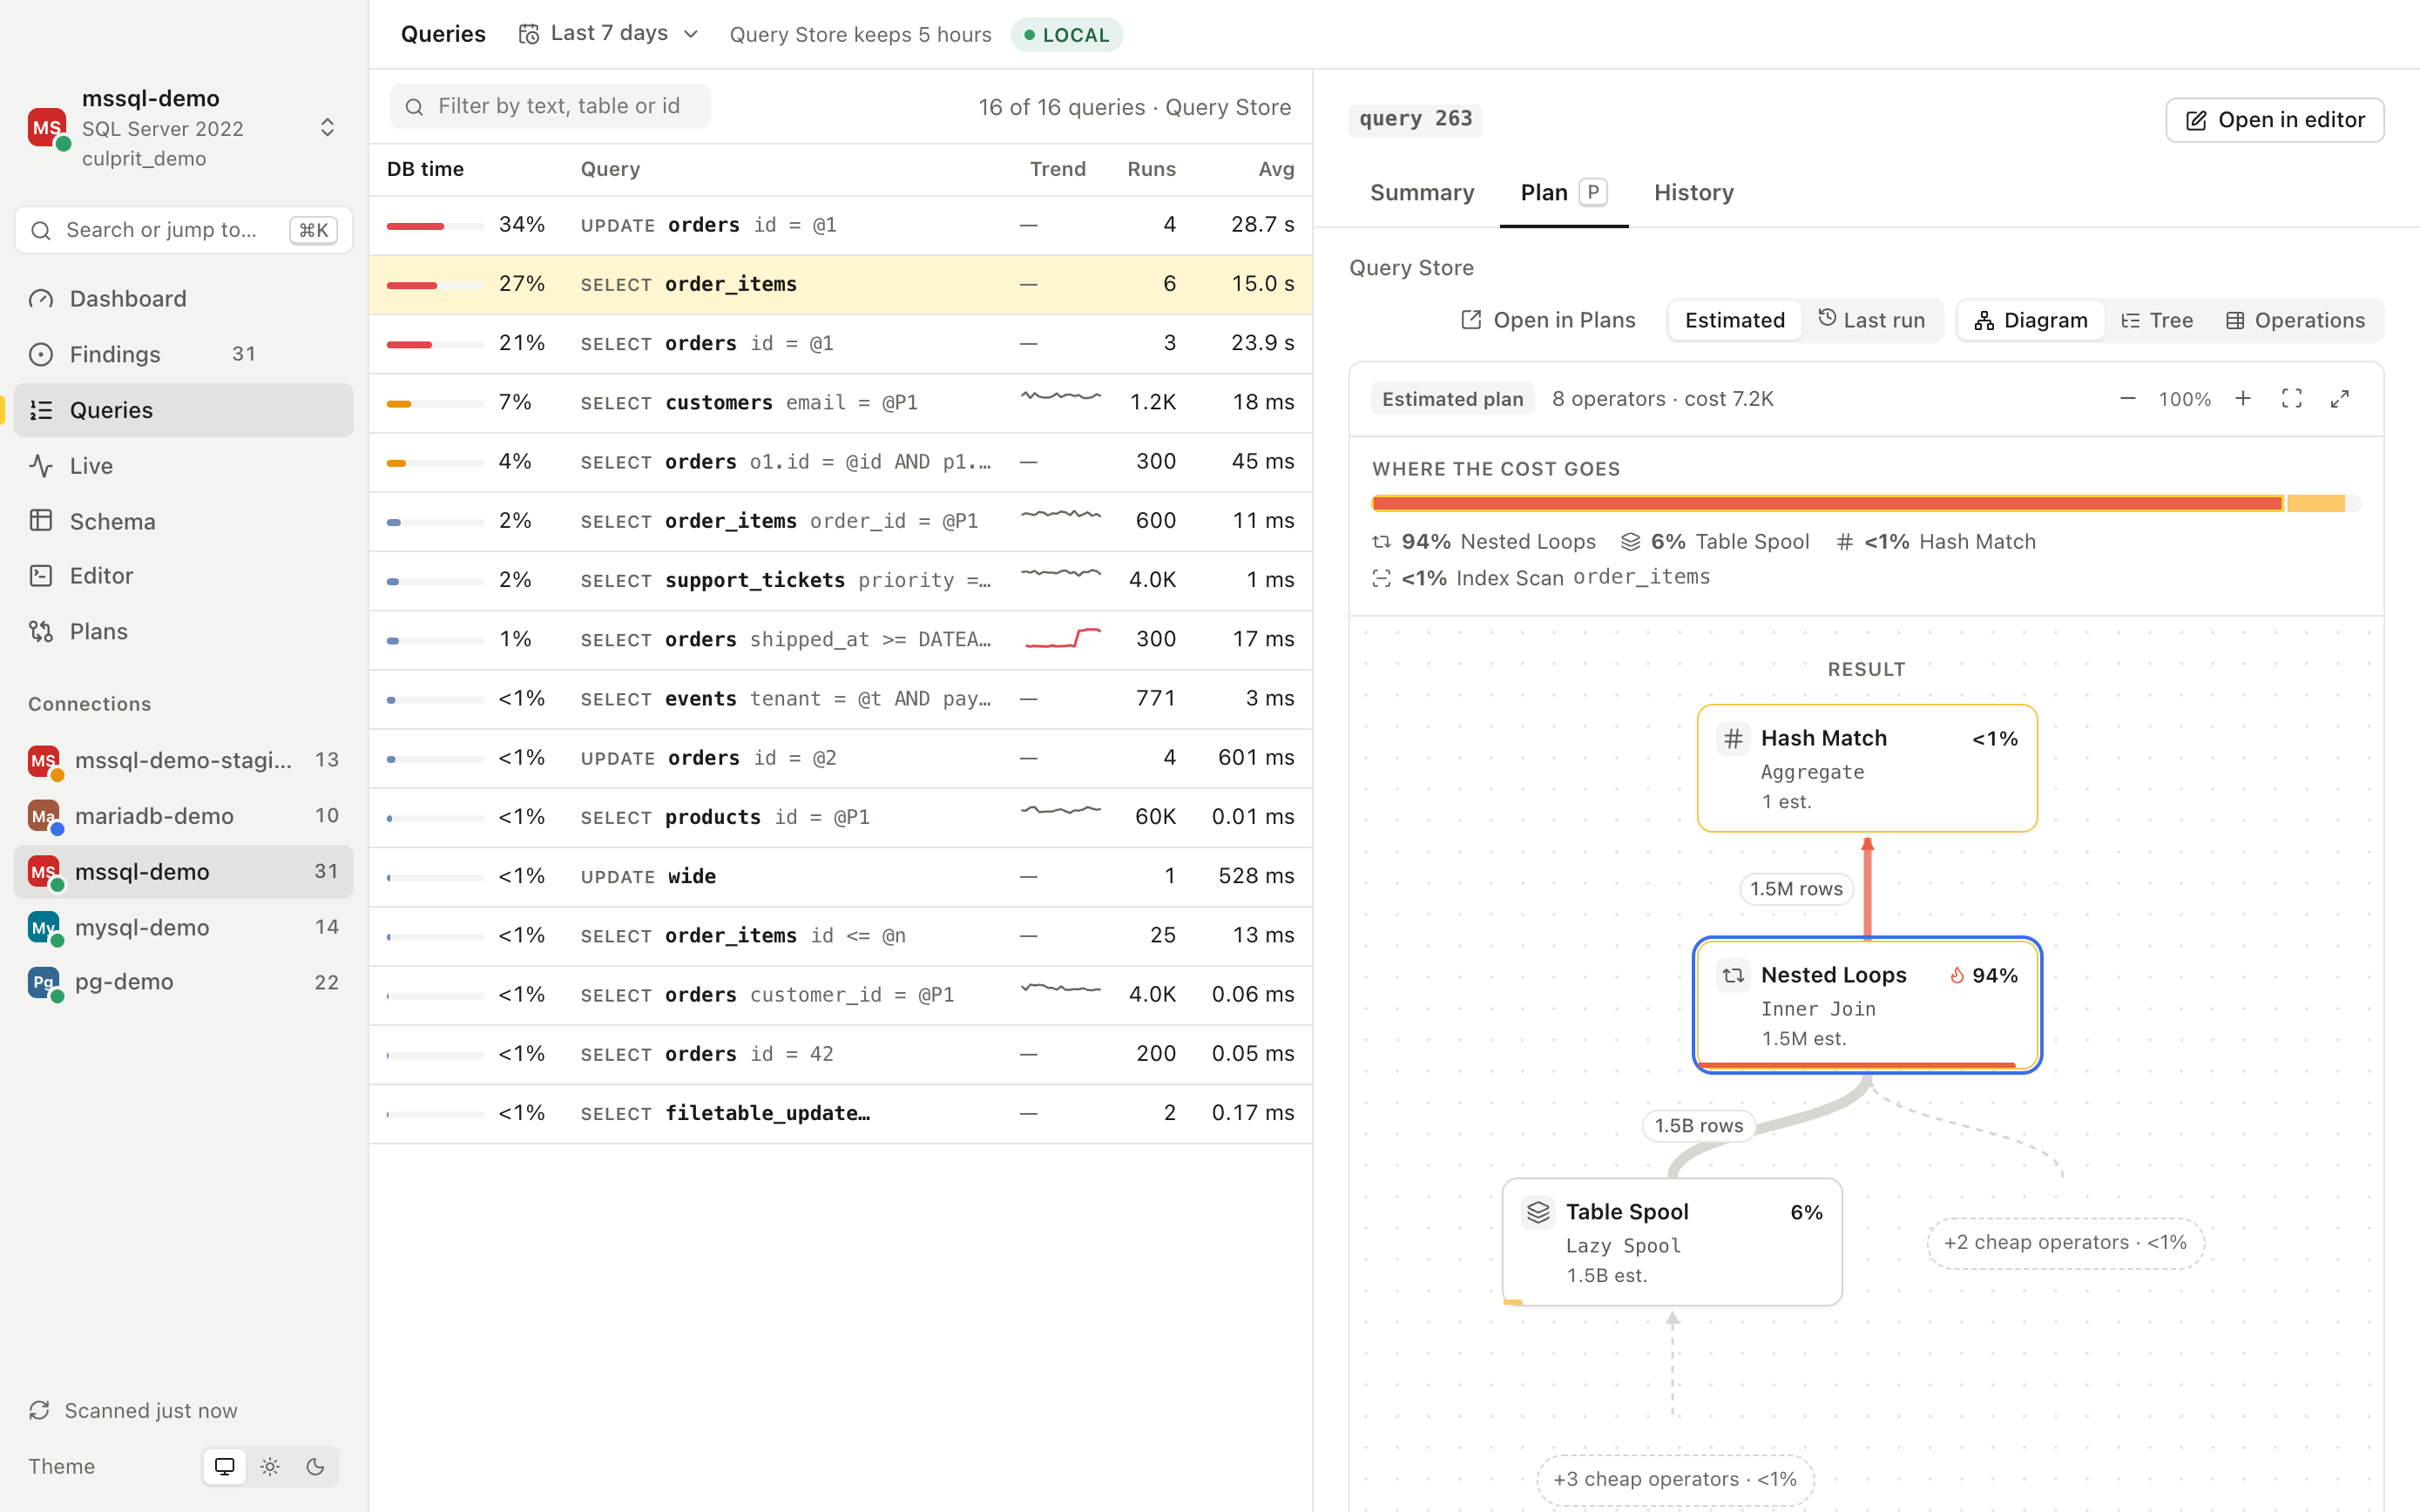
Drag across the database-time chart to compare two periods. Culprit lists what got slower, what's new and what improved, and says why: "Got 293× slower at 5:00 PM, when SQL Server switched from plan 163 to plan 198." It also lines regressions up with everything else that changed around them: a dropped index, a new setting, a restart, a deploy your pipeline marked with culprit mark, or the cloud throttling the server (Amazon RDS CPU credits running out, Azure tier limits), read with your own aws or az sign-in.
Compare any two plans
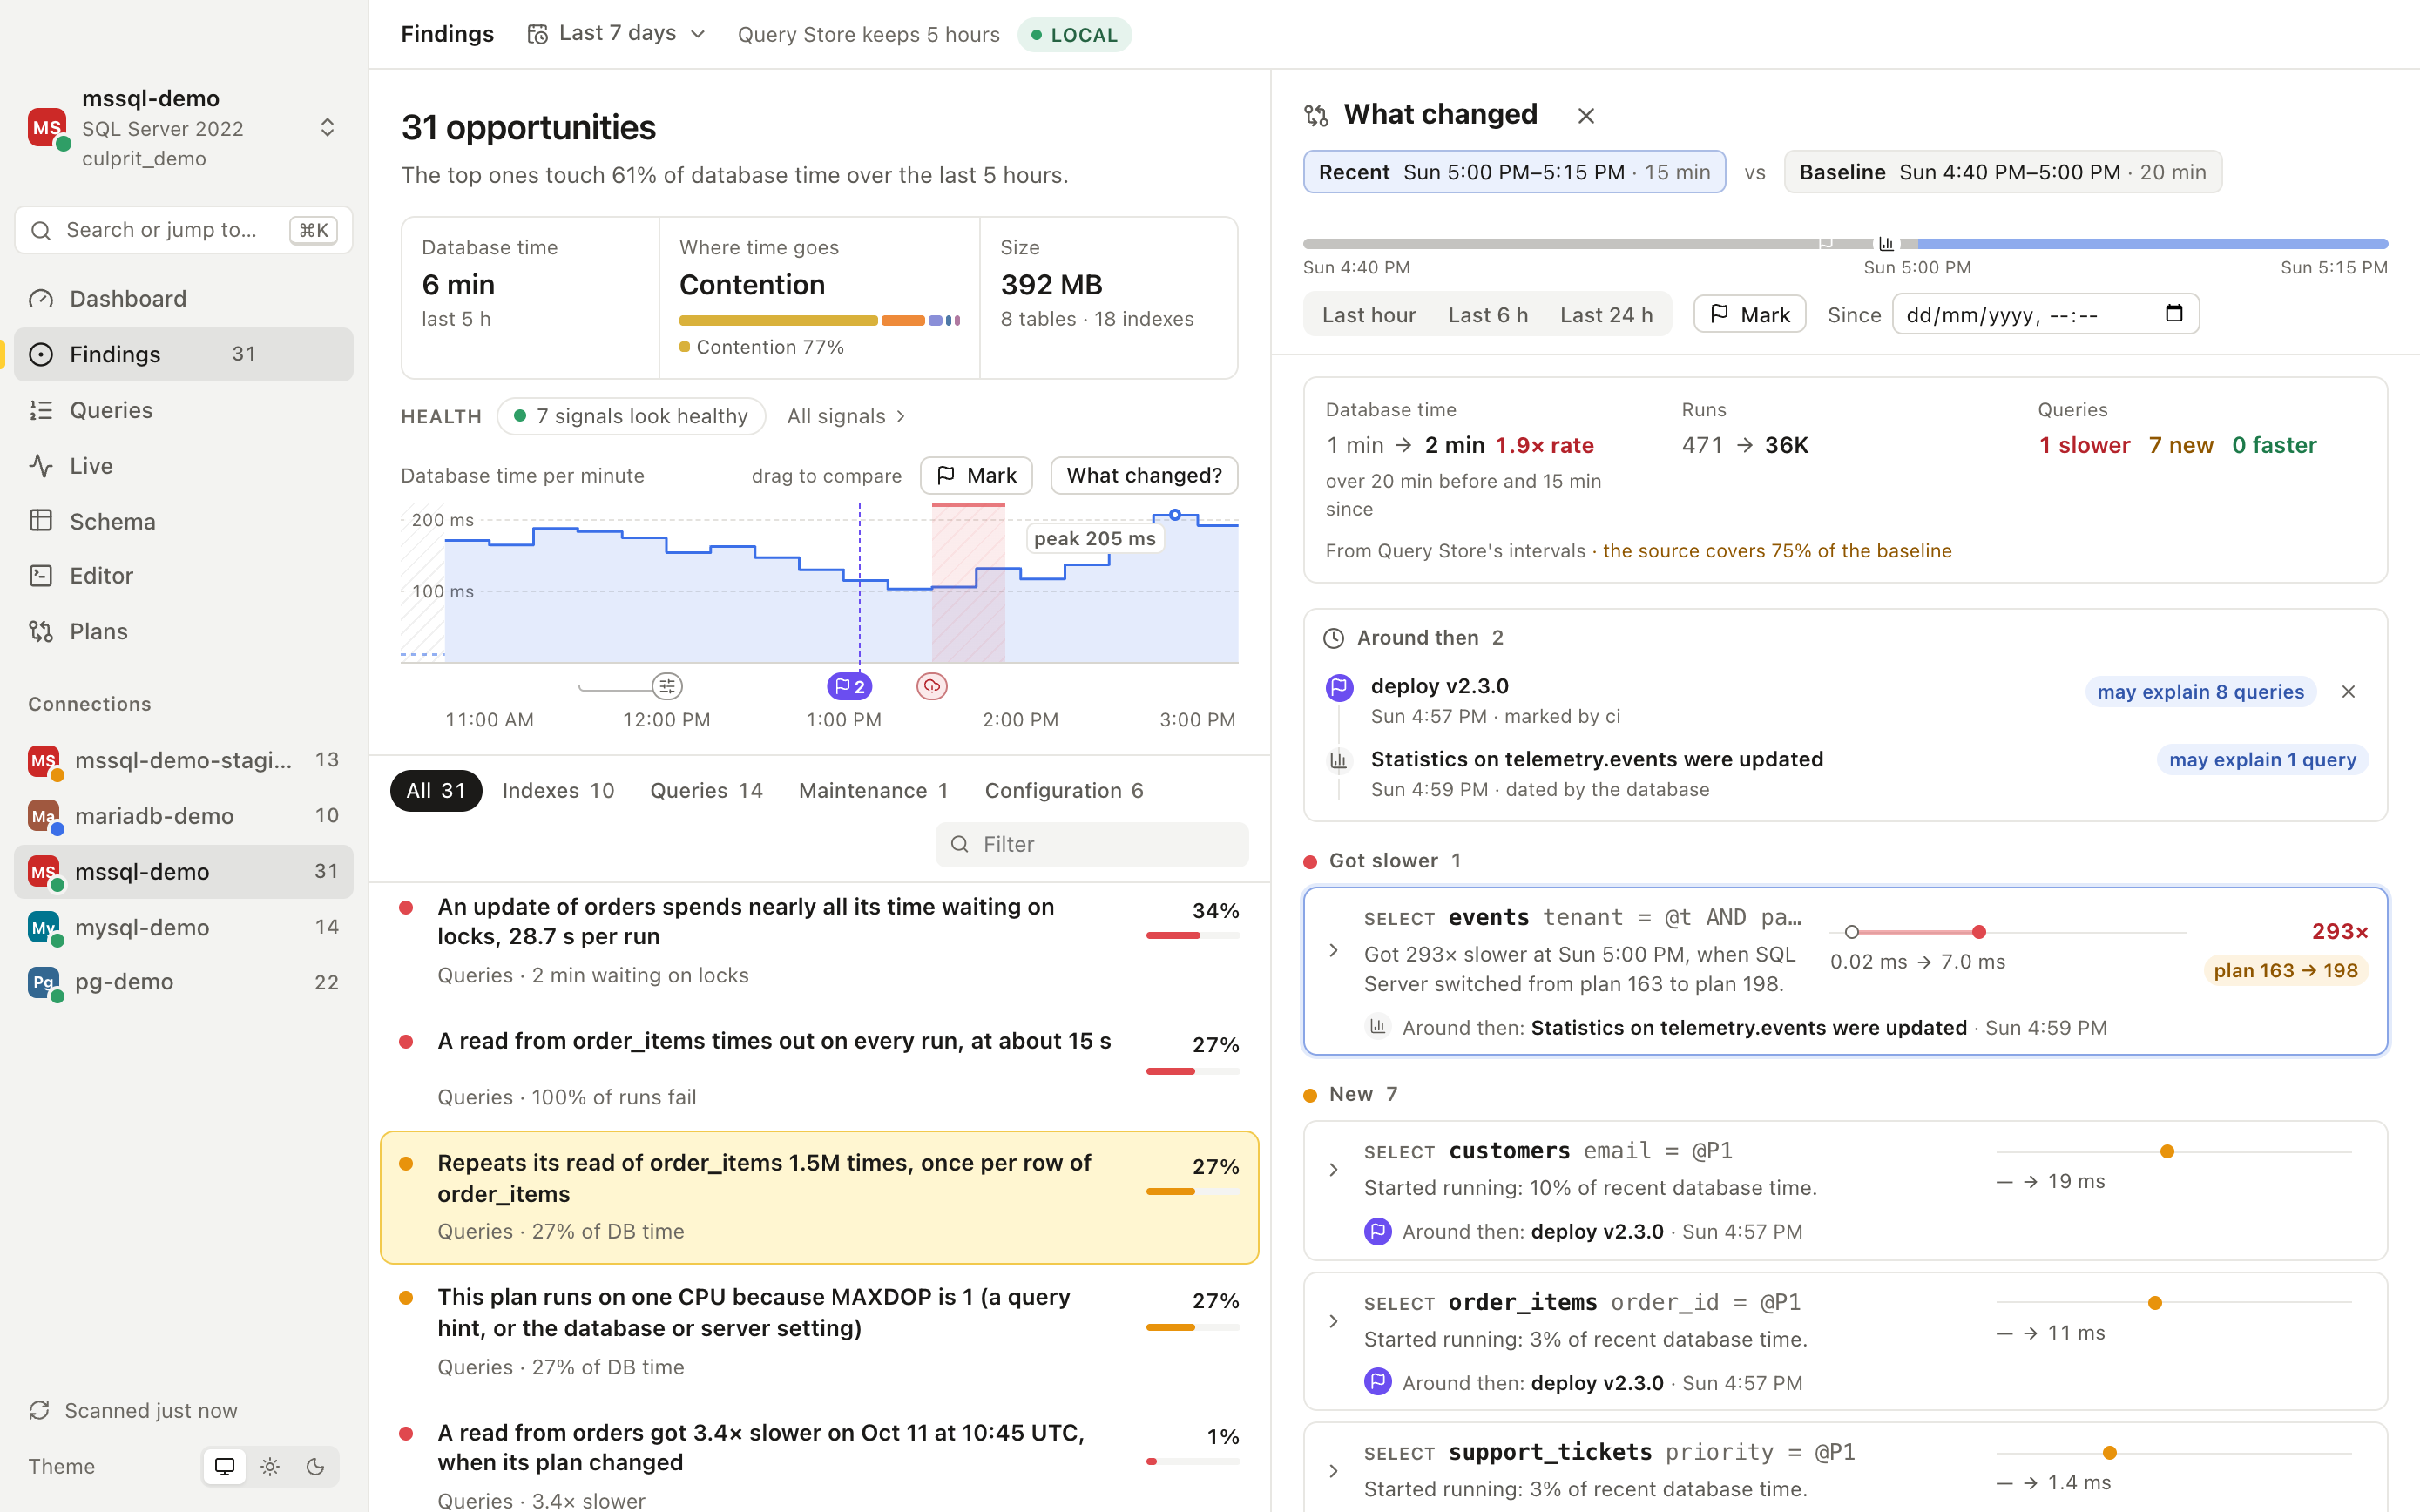
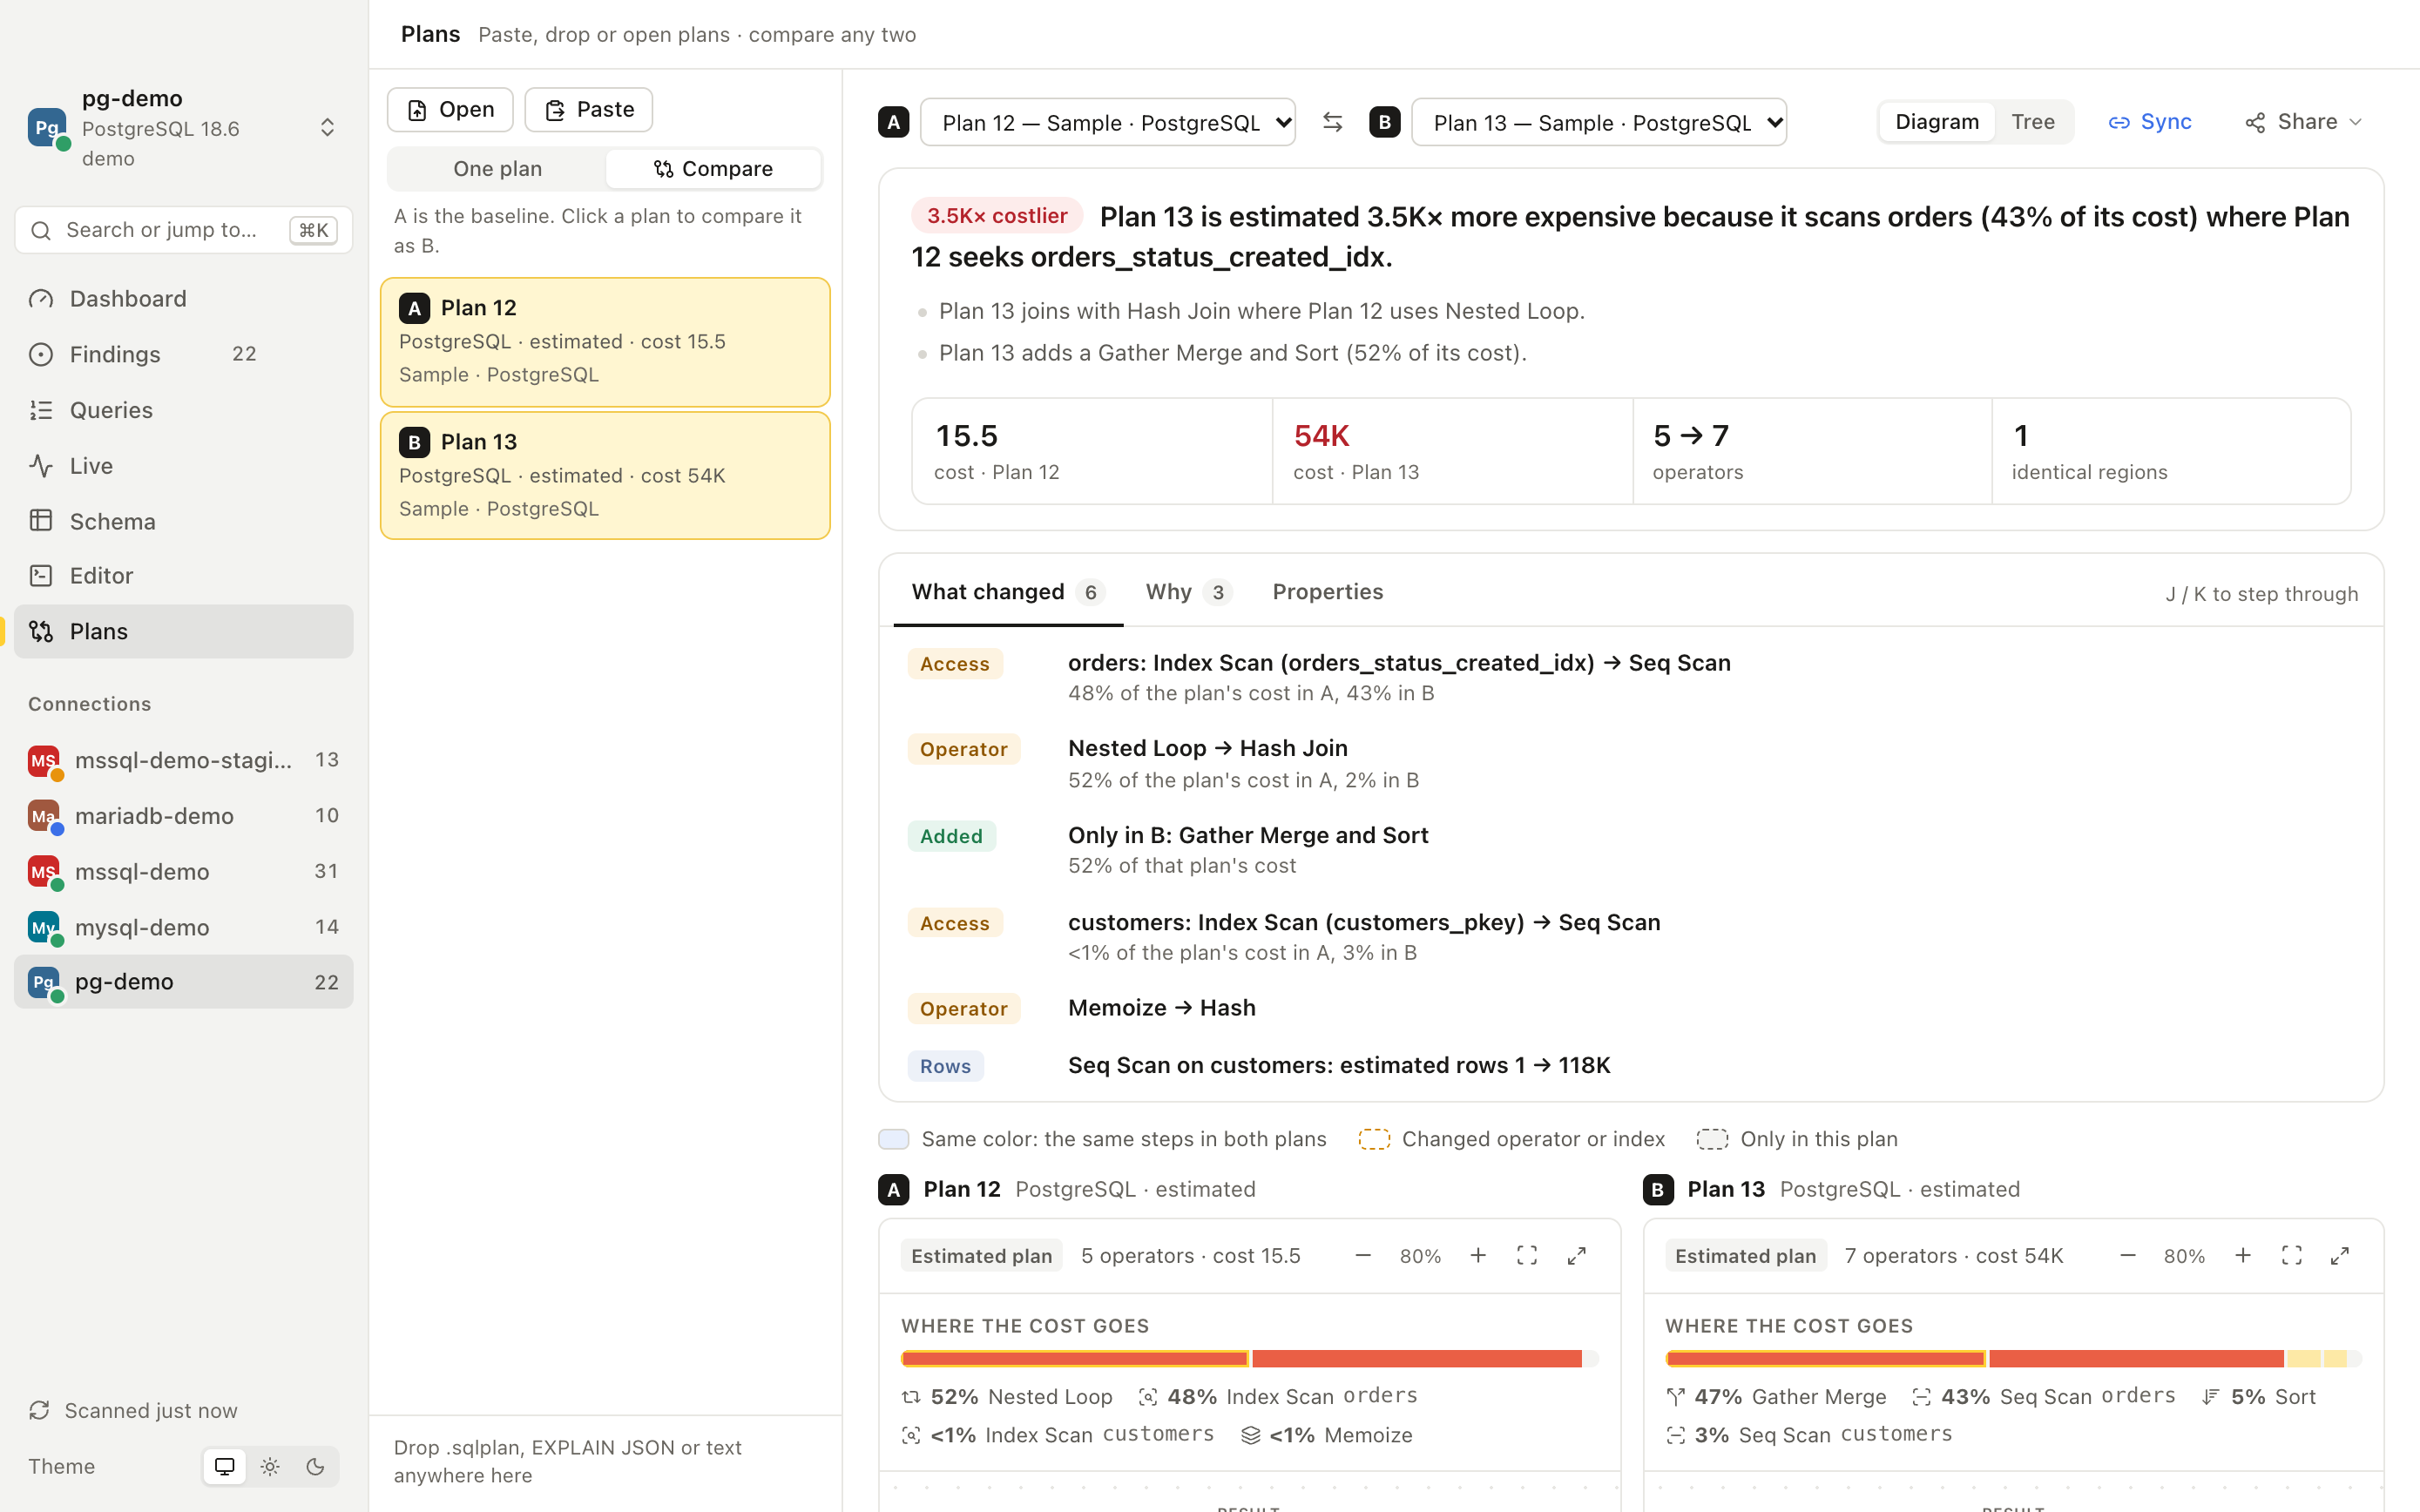
Paste or drop a plan from anywhere (SSMS .sqlplan, PostgreSQL EXPLAIN, MySQL EXPLAIN FORMAT=JSON) and compare it with another. The headline says what matters: "Plan 13 is estimated 3.5K× more expensive because it scans orders where Plan 12 seeks orders_status_created_idx." Every changed step is marked in both diagrams.
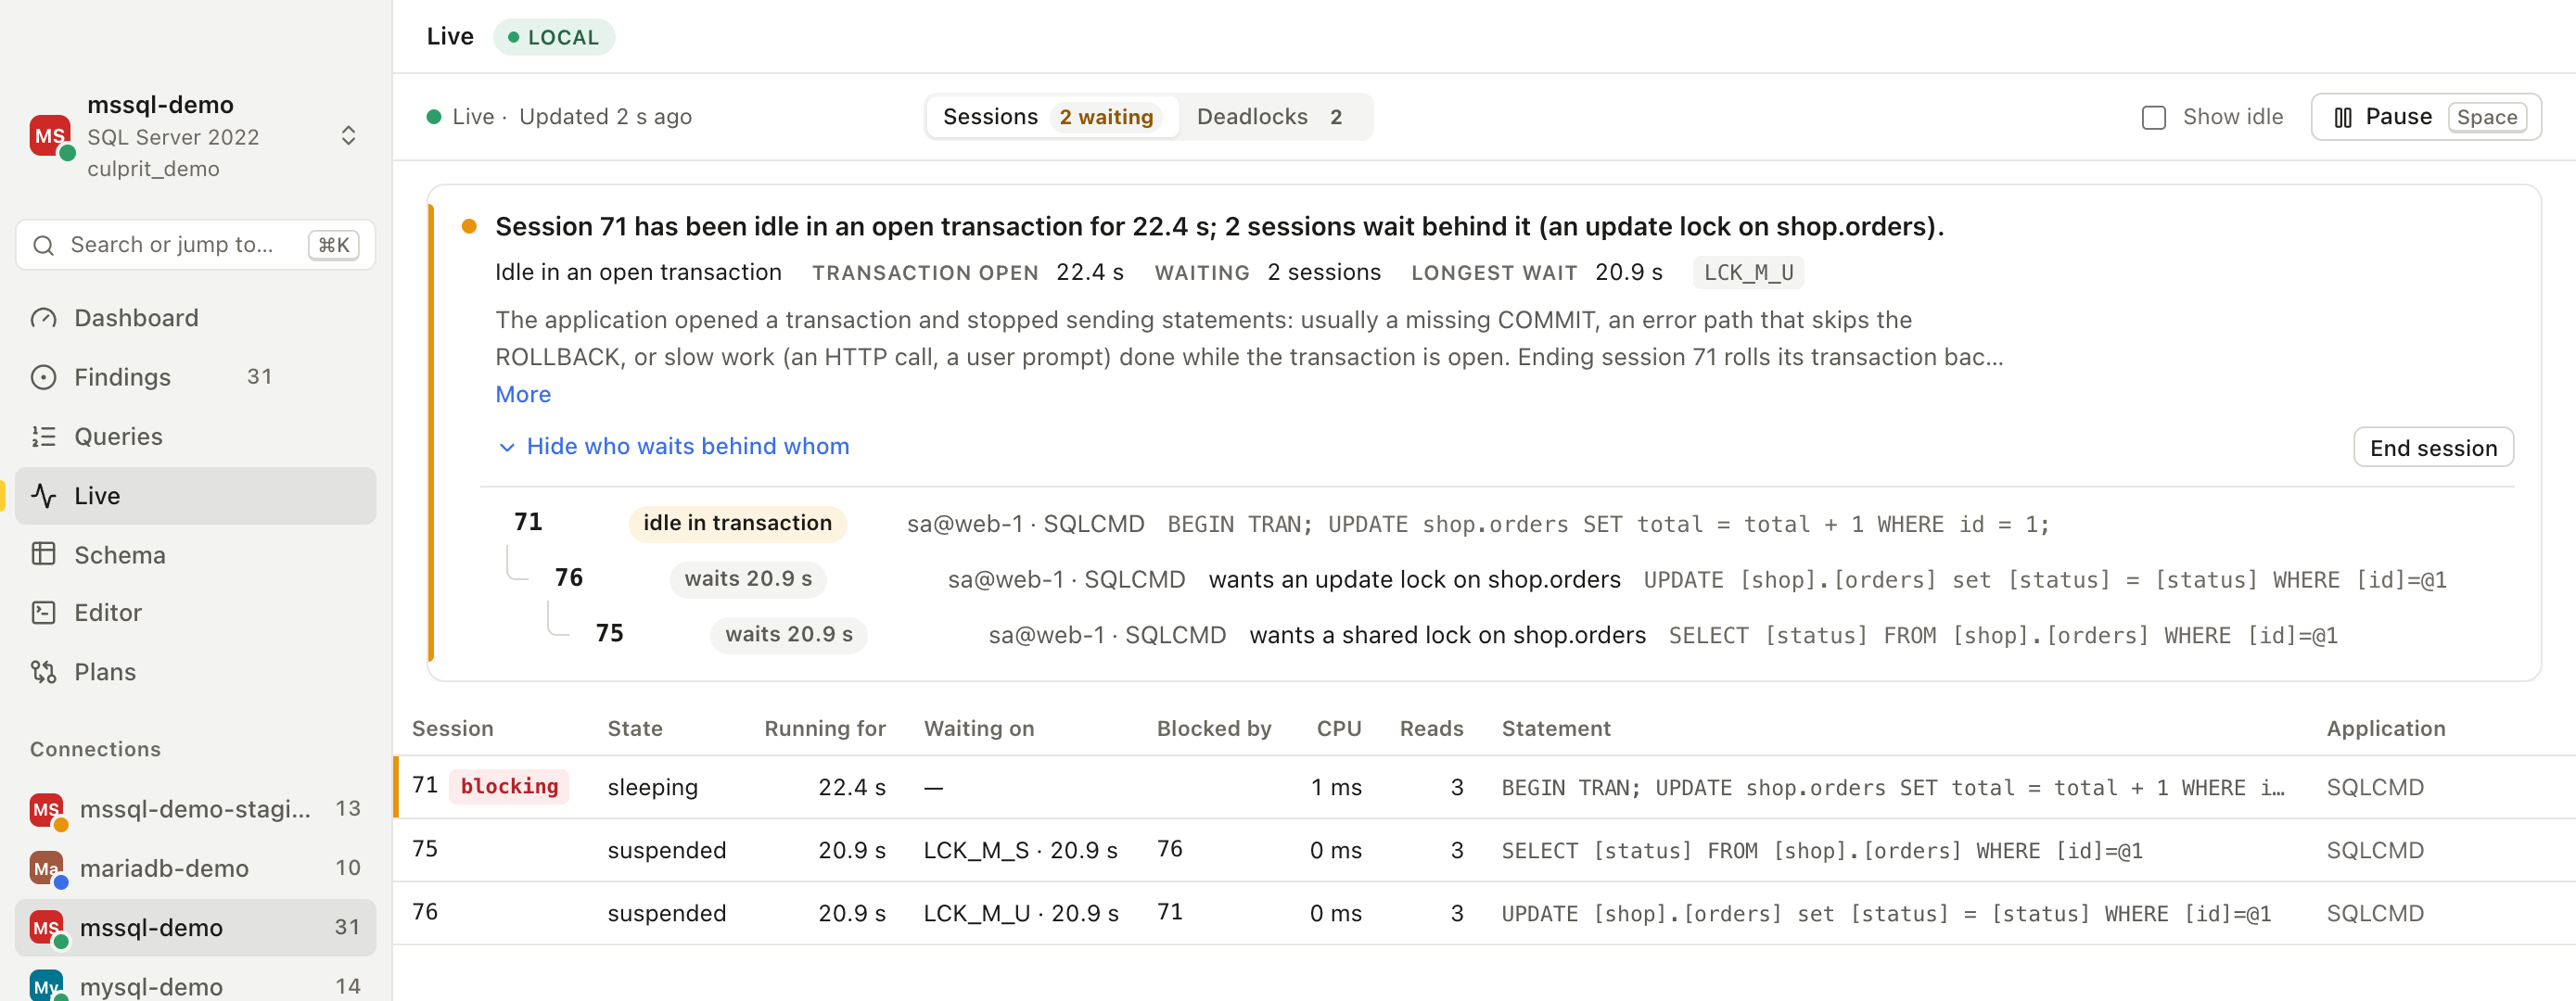
Who is blocking whom, right now
Live sessions turn a wall of lock waits into one sentence and a tree: which session holds everyone up, why (here: a transaction left open by the application) and who waits behind it. Deadlocks get the same treatment, with the pattern named and the fix spelled out.
And everything else, done properly
| Feature | What it does |
|---|---|
| Index advisor | Indexes to add, ranked by the database time of the queries that need them, plus duplicate, overlapping and unused indexes to clean up, with what each costs on writes |
| Where time goes | Wait statistics in plain words, traced back to the queries behind them, with a live sample to compare against the usual mix |
| Health signals | Memory, compiles, connections, row locks, storage latency per file, replication lag and cloud limits, each graded with a one-line takeaway |
| SQL editor | Tabs, autocomplete for schemas, tables and columns, saved queries, estimated and measured plans. Reads run read-only; production changes ask first |
| Schema explorer | Tables, sizes, indexes and how each index is used, plus drift between two environments with the SQL to close the gap |
| Connections | Paste any connection string, discover Azure and AWS databases with your existing CLI login, or import from Azure Data Studio, VS Code, DBeaver and DataGrip. Passwords stay in your OS keychain |
| Keyboard first | A command palette (⌘K) for every view, finding, query and action |
Built for coding agents
Culprit is designed to be driven by an agent as comfortably as by a person. culprit mcp serves 25 tools over the Model Context Protocol (dashboard, findings, plans, insights, what changed, blocking, waits, index advice, verify and more), every CLI command prints JSON when piped, and finding ids are stable, so an agent can find a problem, fix the code and prove the fix worked.
claude mcp add culprit -- culprit mcp   # Claude Code; Cursor and Codex take the same command
culprit agent init                      # teach agents in this repository to use Culprit
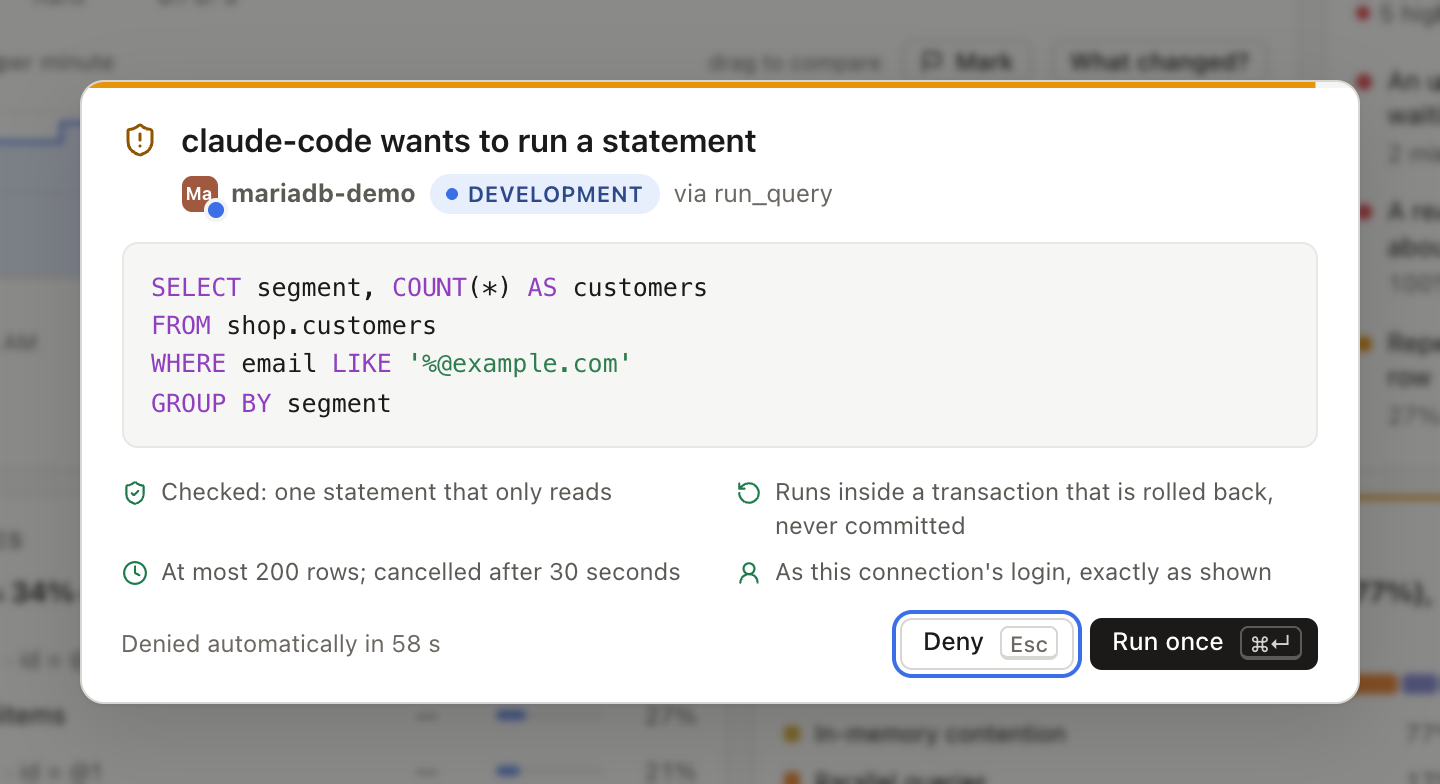
You decide what agents may do, per connection: nothing, read statistics and plans (the default), or run read-only queries that you approve one by one. Approval shows the exact statement and what Culprit guarantees about it, and every tool call lands in a local audit log.
Safe on production
- Read-only by design. Scans read statistics and catalog views only, with short lock timeouts. Estimated plans never execute anything.
- Production is guarded. Statements Culprit can prove only read run in a read-only transaction. Anything else on a production connection needs an explicit confirmation that says what it will do, and destructive statements need the connection's name typed.
- Fixes are suggestions. Every fix is shown and copied, never applied, and uses online or concurrent operations where the server supports them.
- Secrets stay put. Passwords live in the OS keychain, Entra ID uses your
az login, and nothing about your servers leaves your machine. Exports redact literal values by default. - Agents get least privilege. Off, statistics only, or approved read-only queries, per connection, with every call audited.
Supported databases
| Engine | Tested on | Where the answers come from |
|---|---|---|
| SQL Server | SQL Server 2022, Azure SQL Database | Query Store, plan cache, DMVs, the deadlock history in extended events |
| PostgreSQL | PostgreSQL 15 and 18, including Amazon RDS | pg_stat_statements, statistics views, EXPLAIN (generic plans from version 12) |
| MySQL | MySQL 8.4 | performance_schema, sys, EXPLAIN FORMAT=JSON |
| MariaDB | MariaDB 10.11 and 11.8 | performance_schema, the slow query log, user statistics, ANALYZE FORMAT=JSON, SHOW ANALYZE |
When a source is switched off (Query Store, pg_stat_statements, performance_schema), Culprit shows the one statement that turns it on and what you'll get once it's on.
Get started
Culprit builds from source today. You need Rust (stable) and Bun; on Linux, also the WebKitGTK development packages listed in the guide. CI builds and tests every commit on macOS, Linux and Windows, and bundles the desktop app for each (an .app, a .deb and an .msi).
git clone https://github.com/cristipufu/culprit-sql-studio.git
cd culprit-sql-studio

cargo build --release -p culprit-cli           # the culprit CLI, in target/release
cd app && bun install && bunx tauri build      # the desktop app
Connect a database and get its dashboard:
culprit conn add shop --env staging --url 'postgres://[email protected]:5432/shop'
culprit dashboard shop       # the database at a glance
culprit scan shop            # every finding, ranked
Or open the desktop app, paste a connection string, and the first report appears in seconds.
Just looking? cd app && bun install && bun run dev opens the full interface in your browser with demo data: no database needed.
Learn more
- Guide: every check and command, the agent setup, measured speed, safety details and how to extend Culprit
- Design: how the product behaves and why
- Coding agents: MCP tools, permissions, approvals and the audit log
- Engine parity: every feature on SQL Server, PostgreSQL, MySQL and MariaDB, and where each answer comes from
Culprit is open source under the MIT license.
Made for the people who get paged when the database is slow.
Yorumlar (0)
Yorum birakmak icin giris yap.
Yorum birakSonuc bulunamadi