anofox-visualization
Health Pass
- License — License: NOASSERTION
- Description — Repository has a description
- Active repo — Last push 0 days ago
- Community trust — 15 GitHub stars
Code Fail
- eval() — Dynamic code execution via eval() in .github/workflows/assist-eval.yml
Permissions Pass
- Permissions — No dangerous permissions requested
No AI report is available for this listing yet.
Dashboards from plain DuckDB SQL: tag result columns with ::ROLE casts and each SELECT becomes a chart, KPI, table, map or input, drawn as SVG by ggplot-rs. Runs in the browser (DuckDB-Wasm), as a DuckDB extension, or as a locked server with login, row/column policies and exports.
Anofox Visualization - DuckDB Extension
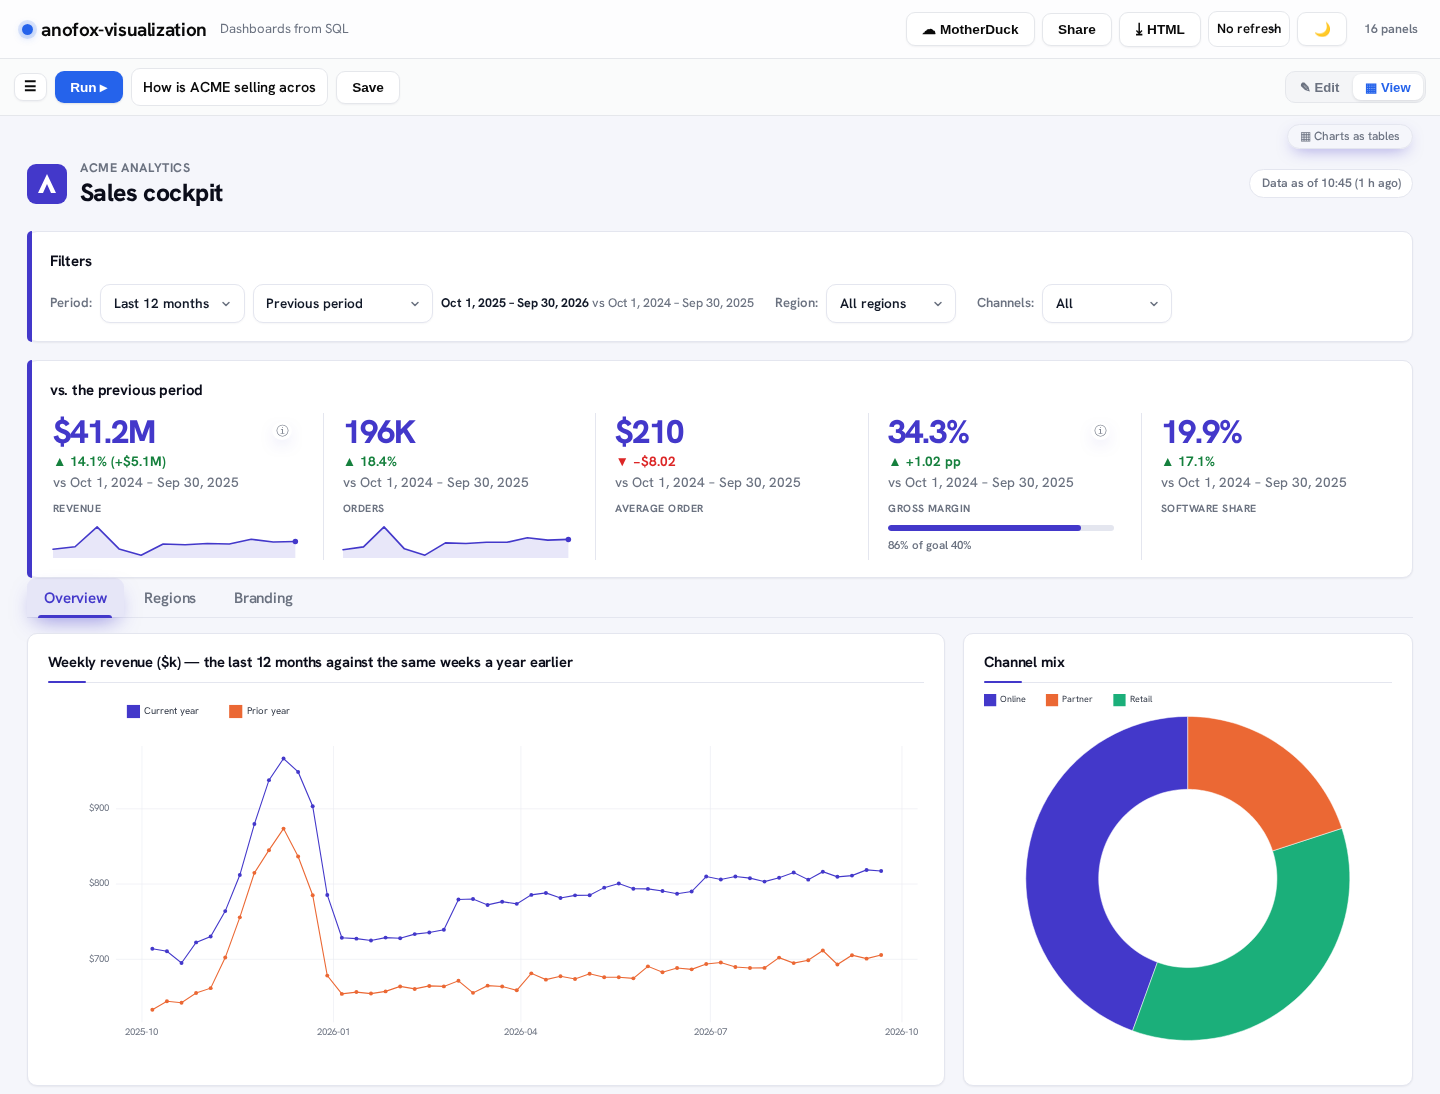
Charts & dashboards for DuckDB — the grammar of graphics, straight from SQL. You
write ordinary DuckDB SQL and tag output columns with ::ROLE casts; each
annotated SELECT becomes a panel (chart / KPI / table / input), rendered to
SVG by ggplot-rs, a
grammar-of-graphics engine. No JS charting library, no bespoke config — the
SQL is the dashboard.




[!IMPORTANT]
This extension is in early development, so bugs and breaking changes are expected.
Please use the issues page to report bugs or request features.
LOAD anofox_visualization;

-- Convenience macros: pass columns, get one SVG per group.
WITH sales AS (SELECT * FROM (VALUES ('app',30),('web',22),('api',12)) t(ch,n))
SELECT anofox_bar(ch, n) FROM sales;                 -- <svg> bar chart
▶ Live demo — the full
builder running in your browser on DuckDB-Wasm. Its sidebar keeps your own
dashboards first, then one Examples library grouped by business area (start
here, demand & stock, logistics & production, sales & customers, service &
operations, data quality, and the feature tours under how it works). Each
example places itself with -- @group / -- @tags header comments. Among
them: statistics and forecast computed live
in the browser by their wasm builds; tabular
(a data-quality report), optimize
(decisions at a distribution centre) and decide
(support-ticket triage with a decision model) read results computed natively,
because those extensions can't run in DuckDB-Wasm yet; and an
inventory digital twin (stock, risk, drift
monitoring, calibration and replay of inventory-rs twins) with a
supplier lead-time companion (reliability,
drift and what lead-time variability costs in safety stock).
Features
Chart kinds
Cast the measure column with the chart role; add ::XAXIS / ::CATEGORY for
the axes and colour series.
| Family | Roles |
|---|---|
| Bars | ::BARCHART, _STACKED, _PERCENT, _STACKED_PERCENT, ::FLIP (horizontal) |
| Lines & areas | ::LINECHART, _PERCENT, ::STEP, ::SMOOTH (trend), ::AREACHART, _STACKED |
| Points | ::SCATTER, ::BUBBLE (sized), ::JITTER, ::HEXBIN (bins a planar scatter into a 2D count density) |
| Part-to-whole | ::PIE, ::DONUTCHART |
| Distribution | ::HISTOGRAM, ::DENSITY, ::BOXPLOT, ::VIOLIN, ::QQ — histogram and QQ take ::CATEGORY / ::FACET; ::HIST_BINS (count or edges), 'share'::HIST_NORM |
| Matrix / geo | ::HEATMAP, calendar heatmap, maps: ::MAP/::REGION choropleth (WKT geometry or a region code against the built-in boundaries), ::LAT/::LON points, graduated symbols, flow maps (::ORIGIN/::DEST), ::HEXBIN density |
| Finance | ::CANDLESTICK, ::OHLC, ::SPARKLINE |
| Gauge / radar | ::GAUGE (+ ::RANGE, ::COLORS zones), ::RADAR |
| Annotations | ::REFLINE/::XLINE reference lines, ::BAND_LOWER/::BAND_UPPER bands |
| Small multiples & axes | ::FACET (one panel per value, shared axes), ::XSCALE/::YSCALE ('log10', 'sqrt', 'reverse', with round-number ticks), ::XBREAKS/::YBREAKS (explicit ticks) |
KPIs, text & tables
| Group | Roles |
|---|---|
| KPI tiles | ::METRIC, ::MONEY, ::PERCENT, ::COMPACT (+ ::LABEL caption, ::DELTA arrow), 'compact'::KPI_SIZE for a dense one-line strip |
| Text | ::TEXT_SMALL/_MEDIUM/_LARGE, ::MARKDOWN (GFM tables), ::SUBTITLE under a panel's title, ::INFO (a Markdown popover on the title) |
| Tables | ::TABLE, ::PAGED (SQL-paginated), ::COLORSCALE, ::BADGE, ::TREND, ::SPARKLINE, ::RECORD (one record as a key/value card), ::DOWNLOAD_CSV/_XLSX/_PDF/_JSON; a bare DESCRIBE / SUMMARIZE / SHOW is a table panel |
Inputs, layout & interactivity
| Group | Roles / behaviour |
|---|---|
| Inputs | ::DROPDOWN (searchable for long option lists; ::DROPDOWN_STYLE forces it), ::MULTISELECT, ::NUMBER, ::DATE, ::TEXT, ::DATERANGE → each is a DuckDB variable read with getvariable('name') |
| Collect & write back | ::SUBMIT records a viewer's answers (append-only, per viewer); ::SAVE writes a ::FORM's values or an edited graph into ::SAVE_TABLES, with conflict checks and an audit trail. On a locked server, its options must enable both; in the builder, a save stays in the tab |
| Layout | 12-column grid (::COLUMNS/::COL/::HEIGHT), ::GROUP boxes, tabs (::TAB/::SUBTAB), alternative views of one panel (::VIEW/::ENDVIEW — a Lines/Bars/Table switcher), fit-to-screen tabs ('fit'::FIT, no page scroll), ::TRACK strips under a chart that share its x axis, ::FIGURE/::ENDFIGURE (several charts as one patchwork picture with aligned axes) |
| Interactivity | hover tooltips (extra columns with ::TOOLTIP, templates with ::TOOLTIP_FORMAT / ::TOOLTIP_HEADER), click-to-cross-filter, range zoom, brush/value filters, dark mode, share links — pure DOM, so it works on exported HTML too |
| Formatting | ggplot2-style axis formatters (::YFORMAT '€', ::XFORMAT '$', percent, compact) |
Contract plots
Model/test output from anofox-statistics and anofox-forecast, and data-quality
output from anofox-tabular, plotted straight from their result tables:anofox_plot_terms/_prediction/_curve/_summary/_obs/_diagnostics/_tests/_compare/_partial/_events/_diagram, plus the newer_decomposition (time-series decomposition), _cv (cross-validation fold
timeline, provisional), _checks (data-quality checks) and _matrix
(correlation / confusion heatmap). anofox_plot(tbl) picks the right one from
the table's columns. See the
statistics-plots skill
and docs/DOCS.md.
Key capabilities
- Three surfaces, one renderer — a core library (annotated result → SVG, wasm-compatible), a DuckDB extension (render + serve), and a browser builder on DuckDB-Wasm.
- Serve locked, read-only dashboards (from-source build) — hand a folder of
.sqlfiles to untrusted consumers; the server owns the SQL (the client sends only panel ids + variable values) over a locked, read-only snapshot. The folder groups itself from header comments (-- @group,-- @tags,-- @description,-- @owner,-- @certified,-- @order Nfor nav/start-page ordering,-- @navfor a short nav/card label distinct from-- @title): a grouped nav (a searchable menu above 8 dashboards) and a/landing page of cards with descriptions, owners and a ✓ certified badge. - Run a locked server for others (full toolkit) — see Secure serving:
- Logins: an auth proxy, OIDC / JWT, signed embed links, API keys, and share links (public or password-protected). Row and column access policies are keyed on the viewer's claims.
- Exports:
GET /api/export/<dashboard>.svg|png|pdf(a dashboard or one tab), and a named panel's rows as CSV or JSON. - Schedules: scheduled tasks (
tasks/*.task.sqlwith::SCHEDULE). Reports and alerts go out by e-mail, signed webhooks, Slack or Teams. - Operations: Prometheus
/metrics, and-- @materializefor a heavy setup step that runs once per input instead of once per panel.
- Publish as a static site (full toolkit CLI) —
dashboard --site <folder> <out-dir> [--data …]turns a dashboard folder into plain files (HTML, the DuckDB-Wasm renderer, the.sql, the data) for GitHub Pages, S3 or any web server; nothing to run.dashboard --svgand static HTML export render a dashboard headless — see Secure serving. - Any DuckDB source — CSV / Parquet / JSON / Arrow, MotherDuck, Postgres / MySQL / SQLite via
ATTACH, remote HTTP, and spatial layers (ST_AsText→ WKT →::MAP). A locked server can also snapshot a live Quack source (DuckDB 2.0 host, opt-in) instead of a local database — see Secure serving. - Authoring aids — a
dashboard --checklinter (structure +design/*quality checks), abuild-dashboardagent skill that writes dashboards from a prompt, and a per-query timeout for authoringserve(--query-timeout, default 120s) that ends a hung query and starts a fresh session. - AI assistant in the browser builder (off unless an installation enables it in
app-config.json) — a plain-language request becomes a dashboard, or follow-up edits to one, via "new from question" or the assistant panel; every proposal is previewed in a locked, network-free DuckDB-Wasm sandbox on a capped copy of your tables and only runs on the page's own database after you choose Apply. In the browser app it calls Claude with your own API key. On an authoringserve, it goes through the server's/assistproxy, so the key stays on the server. It never goes through a DataZooDE server (docs).
Quick Start
All rendering functions use the anofox_ prefix.
LOAD anofox_visualization;

-- 1) Convenience macros — pass columns, get one SVG per group.
WITH sales AS (SELECT * FROM (VALUES ('app',30),('web',22),('api',12)) t(ch,n))
SELECT anofox_bar(ch, n) FROM sales;                 -- <svg> bar chart
--   also anofox_line / _scatter / _area(x, y),
--        anofox_xy(x, y, kind := 'VIOLIN', width := 640, height := 400),
--        anofox_xyc(x, y, series)   -- coloured by series

-- 1b) Model output: pass the whole row of an anofox-statistics/-forecast table.
SELECT anofox_plot_terms(c) FROM coefficients c;     -- coefficient forest
--   also anofox_plot_prediction / _curve / _summary / _obs / _diagnostics,
--        anofox_plot(tbl) picks one from the columns (docs/DOCS.md)

-- 2) The raw spec (rows + role annotations) — the same JSON the browser uses:
SELECT anofox_render('{"rows":[{"c0":"a","c1":3}],"roles":[[0,"XAXIS"],[1,"BARCHART"]]}');

-- 3) A dashboard panel — annotate the SELECT list with ::ROLE casts:
SELECT week::XAXIS, channel::CATEGORY, sum(n)::BARCHART_STACKED, 'Sessions'::TITLE
FROM sessions GROUP BY ALL ORDER BY ALL;
What's in the extension vs. the full toolkit
[!NOTE]
The community extension you install (below) provides rendering only —anofox_render, theanofox_bar/_line/_scatter/_area/_xy/_xycmacros and theanofox_plot_*model-output macros that
turn SQL into SVG. The serving and builder features below embed a web UI +
HTTP server and are not in the community binary — they come with the
full toolkit: prebuilt on every GitHub release (see
Installation → From a release) or a
from-source build.
With the full toolkit you also get an in-browser builder and locked,
read-only serving:
-- Interactive builder wired to THIS database, DuckDB-UI style (loopback only;
-- the printed URL carries a per-server token):
SELECT anofox_serve(8080);              -- http://127.0.0.1:8080/?token=…

-- Serve a folder of .sql dashboards locked + read-only to consumers:
SELECT anofox_serve_dashboards('dashboards', 8095);
-- http://127.0.0.1:8095/           a list of the folder's dashboards
-- http://127.0.0.1:8095/d/<name>   one dashboard — full UI, editor removed
SELECT anofox_serve_refresh(8095);      -- re-snapshot now (or options.refresh_s)
SELECT anofox_serve_reload(8095);       -- re-read the dashboards folder after a deploy
SELECT anofox_serve_report(8095, 'weekly');  -- send a scheduled report (or check an alert) now
SELECT anofox_serve_stop(8095);         -- stop a server (and delete its snapshot)
…plus a dashboard CLI (in the release CLI archive, or cargo run --bin dashboard -- file.sql) and the
standalone browser app (web/).
A runnable example of a served setup — result cache, refresh without a restart,
a live data folder with the run picked by a variable, and a login proxy — is inexamples/served/: examples/served/serve.sh start.
Installation
Community Extension
Listed in DuckDB Community Extensions:
INSTALL anofox_visualization FROM community;
LOAD anofox_visualization;
Community Extensions now builds every extension, this one included, against
DuckDB 2.0 by default; a build against another version (e.g. the
v1.5.6 this repository is pinned to) needs the separate variegata
field. An open PR bumps this extension to v2026.10.21 with variegata set
for a 1.5.6 build alongside the 2.0 one
(duckdb/community-extensions#3228,
not yet merged) — until it lands, INSTALL … FROM community serves the
last merged version.
Provides: rendering only — anofox_render and the anofox_bar/_line/_scatter/_area/_xy/_xyc
macros (SQL → SVG). Serving and the builder are not included (see below).
From a release (full toolkit)
Every GitHub release
carries the full toolkit — rendering plus anofox_serve,anofox_serve_dashboards, anofox_serve_refresh, anofox_serve_reload, anofox_serve_report, anofox_serve_stop with the browser builder
embedded — prebuilt for each platform, together with the dashboard / serve
CLIs and a SHA256SUMS file:
| Platform | Extension asset | CLI asset |
|---|---|---|
| Linux x86_64 (glibc ≥ 2.35) | anofox_visualization.<tag>.duckdb-v1.5.6.linux_amd64.duckdb_extension |
anofox-visualization-cli-<tag>-x86_64-unknown-linux-gnu.tar.gz |
| Linux arm64 (glibc ≥ 2.35) | anofox_visualization.<tag>.duckdb-v1.5.6.linux_arm64.duckdb_extension |
anofox-visualization-cli-<tag>-aarch64-unknown-linux-gnu.tar.gz |
| macOS Apple silicon | anofox_visualization.<tag>.duckdb-v1.5.6.osx_arm64.duckdb_extension |
anofox-visualization-cli-<tag>-aarch64-apple-darwin.tar.gz |
| macOS Intel | anofox_visualization.<tag>.duckdb-v1.5.6.osx_amd64.duckdb_extension |
anofox-visualization-cli-<tag>-x86_64-apple-darwin.tar.gz |
| Windows x64 | anofox_visualization.<tag>.duckdb-v1.5.6.windows_amd64.duckdb_extension |
anofox-visualization-cli-<tag>-x86_64-pc-windows-msvc.zip |
duckdb-v1.5.6 is the DuckDB release each file is built and smoke-tested
against; the extension uses DuckDB's stable C extension API (v1.2.0), so it
also loads in other DuckDB versions ≥ v1.2 for the same platform.
The extensions are unsigned: start DuckDB with -unsigned (orSET allow_unsigned_extensions = true before the first LOAD, e.g.duckdb.connect(config={"allow_unsigned_extensions": "true"}) in Python).
TAG=v2026.10.21 PLATFORM=linux_amd64      # linux_arm64, osx_arm64, osx_amd64, windows_amd64
EXT=anofox_visualization.$TAG.duckdb-v1.5.6.$PLATFORM.duckdb_extension
curl -fLO https://github.com/DataZooDE/anofox-visualization/releases/download/$TAG/$EXT
curl -fLO https://github.com/DataZooDE/anofox-visualization/releases/download/$TAG/SHA256SUMS
sha256sum --check --ignore-missing SHA256SUMS      # macOS: shasum -a 256 -c --ignore-missing
duckdb -unsigned -c "LOAD './$EXT'; SELECT anofox_contract_version();"
-- in `duckdb -unsigned`
LOAD './anofox_visualization.v2026.10.21.duckdb-v1.5.6.linux_amd64.duckdb_extension';
SELECT anofox_serve(8080);      -- the builder UI on the live session
Keep the file name's anofox_visualization. prefix when renaming: DuckDB
derives the extension's name (and entry point) from the file name up to the
first dot. Or install it like any other extension from the project's DuckDB
extension repository on GitHub Pages (latest release; DuckDB v1.5.6):
-- duckdb -unsigned
INSTALL anofox_visualization FROM 'https://datazoode.github.io/anofox-visualization/extensions';
LOAD anofox_visualization;
The CLI archives contain dashboard (render an annotated .sql file to HTML,
or lint it) and serve (the builder / locked dashboard server, UI embedded).
Both run queries through a duckdb CLI on your PATH:
tar xzf anofox-visualization-cli-$TAG-x86_64-unknown-linux-gnu.tar.gz
cd anofox-visualization-cli-$TAG-x86_64-unknown-linux-gnu
./dashboard --version                     # dashboard v2026.10.21
./dashboard my_dashboard.sql out.html     # static interactive HTML
./dashboard --check my_dashboard.sql      # which panels error / are empty
./serve my.duckdb                         # builder on http://127.0.0.1:8080
./serve --dashboards dashboards/ --db my.duckdb   # locked serving
On macOS, downloads from a browser are quarantined; clear it withxattr -d com.apple.quarantine <file> (not needed with curl).
From source
There are two native builds (see BUILD.md for why):
make (CMake, C++ shell) |
duckext/scripts/build-native.sh (C-API) |
|
|---|---|---|
| Provides | rendering: anofox_render + macros |
full toolkit: rendering + anofox_serve, anofox_serve_dashboards, anofox_serve_refresh, anofox_serve_stop (embedded web builder) |
| Same as | the community binary | — |
| DuckDB | exactly the pinned version (v1.5.6) | any DuckDB with C-API v1.2.0+ (v1.2 or newer) |
| Needs | submodules, CMake, a C++ toolchain, Rust | Rust, libclang (bindgen), wasm-bindgen + wasm-opt (not wasm-pack, #552), Python 3, a duckdb CLI |
Both binaries are unsigned: start DuckDB with -unsigned (or setallow_unsigned_extensions).
DuckDB 2.0. DuckDB 2.0.0 LTS (2026-10-21) is supported now: the CMake /
community (make) build also compiles and runs its sqllogictests against
v2.0.0 ([email protected]), checked by a non-blocking CI
job alongside the pinned v1.5.6 build. The C-API full-toolkit build
(duckext/) is unaffected either way — it is version-portable (C-API
v1.2.0+). This repository's own pin (.duckdb-version, v1.5.6) moves to the
2.0 line around 2.0.1 (~2026-11-18), once duckdb-wasm and the other anofox_*
extensions have 2.0 builds; see docs/DOCS.md and issue #352 for details.
Render-only (make)
git clone --recurse-submodules https://github.com/DataZooDE/anofox-visualization
cd anofox-visualization
make                 # → build/release/extension/anofox_visualization/anofox_visualization.duckdb_extension
make test            # sqllogictests in test/sql
LOAD './build/release/extension/anofox_visualization/anofox_visualization.duckdb_extension';
Full toolkit (build-native.sh)
git clone https://github.com/DataZooDE/anofox-visualization
cd anofox-visualization
duckext/scripts/build-native.sh --release   # builds web/pkg, the extension, packages + smoke-tests it
# → /tmp/anofox_visualization.duckdb_extension   (OUT=… to change; LOAD needs a name starting anofox_visualization.)
LOAD '/tmp/anofox_visualization.duckdb_extension';
SELECT anofox_serve(8080);
The dashboard CLI and the standalone serve binary come from the core crate:cargo run --bin dashboard -- file.sql, cargo run --features serve --bin serve -- my.duckdb.
Documentation
- Annotation model & role reference — every
::ROLE, layout, and serving mode. - Plotting results from Python and R — statsmodels, scikit-learn, scipy, broom, … into the
anofox_plot_*macros; theanofox_vizhelper package and an example notebook. - Dashboard design principles — what makes a dashboard good (enforced by
dashboard --check). - Visual review rubric — the appearance gate.
- Secure serving — the trust model for locked serving;
examples/served/runs it end to end. - Claude Code plugin — four skills that document the SQL API for Claude Code, including the dashboard-authoring workflow (also available in this checkout as the project skill
build-dashboard).
Conformance with anofox-statistics
scripts/statistics_conformance.py calls every contract producer of the
anofox-statistics extension
(the 141 functions tagged anofox.contract = '1': table macros directly, the*_agg test aggregates through unnest), hands each output toanofox_plot(...) and to its specific macro, and fails on a SQL error, a
missing SVG or an unexpected render warning. It writes every SVG (and a PNG
montage when rsvg-convert and Pillow are installed) to --out:
duckdb -unsigned -c "INSTALL anofox_statistics FROM 'https://get.erpl.io'"   # DuckDB v1.5.6
SKIP_WASM=1 OUT=/tmp/anofox_visualization.duckdb_extension duckext/scripts/build-native.sh --release
python3 scripts/statistics_conformance.py --duckdb duckdb --ext /tmp/anofox_visualization.duckdb_extension --out /tmp/stats-viz
CI runs it on every push (.github/workflows/ci.yml, job anofox-statistics
conformance).
Conformance with anofox-decide
anofox-decide tags no contract
producer yet: its answers are per-row probabilities, choices and scores, its
quality metrics single numbers. scripts/decide_conformance.py runs every
decide output through the SQL that makes it a contract table (metrics →summary, probabilities → ROC / PR / calibration curve, also through
anofox-statistics' roc_curve_by / pr_curve_by / calibration_curve_by),
hands it to anofox_plot(...) and to the specific macro, and fails on a SQL
error, a missing SVG or an unexpected render warning. The raw outputs no schema
takes (decide_table, decide_answers) must fail with the clean "match no
plottable schema" error, and a tagged decide producer without a recipe fails
the run. The answers come from decide's built-in stub model (offline);--model laya-multilingual adds a real local model:
duckdb -c "INSTALL anofox_decide FROM community"                             # DuckDB v1.5.6
python3 scripts/decide_conformance.py --duckdb duckdb --ext /tmp/anofox_visualization.duckdb_extension --out /tmp/decide-viz
CI runs it on every push (job anofox-decide conformance).
Conformance with anofox-tabular
anofox-tabular does not tag its
functions for the contract yet, and none of its outputs matches a contract
schema as it comes. scripts/tabular_conformance.py calls every result
producer anyway (the 30 anofox_tab_* table functions other than the
config/status ones) on small deterministic tables. It reshapes each output into
the nearest schema (check results and profiles → summary, the time-aware checks
→ events, outlier_tree → terms) or a generic chart (diffs, PII counts,
anomaly scores), and hands it to anofox_plot(...) and the specific macro. It
fails on a SQL error, a missing SVG, an unexpected render warning or a
producer without a recipe. It also reports when a raw output starts to match a
schema:
duckdb -c "INSTALL anofox_tabular FROM community"   # signed, DuckDB v1.5.6
python3 scripts/tabular_conformance.py --duckdb duckdb --ext /tmp/anofox_visualization.duckdb_extension --out /tmp/tabular-viz
CI job anofox-tabular conformance.
Conformance with anofox-forecast
scripts/forecast_conformance.py does the same for
anofox-forecast. That extension
does not tag its functions yet, so the producers are a curated registry: everyts_* table macro and aggregate of the loaded build is either a producer (51
today: forecasts, backtests, conformal intervals, decompositions, changepoints,
peaks, periods, metrics, residual tests, features) or listed as out of scope
with a reason (fills, drops, CV splits, validators); an unlisted function fails
the run. A producer is direct when its output plots as returned and an
adapter when the harness reshapes it first (the reshaping SQL is in the
script — what you would write today). It runs on a three-series daily panel
(weekly season, a level shift, an exogenous driver) and accepts both builds:
duckdb -c "INSTALL anofox_forecast FROM community"                                  # the release
duckdb -unsigned -c "FORCE INSTALL anofox_forecast FROM 'https://get.erpl.io'"      # or main
python3 scripts/forecast_conformance.py --duckdb duckdb --ext /tmp/anofox_visualization.duckdb_extension --out /tmp/forecast-viz
Producer bugs of a released build are listed in the script (KNOWN) and
reported XFAIL. CI runs both builds (job anofox-forecast conformance).
Claude Code plugin
The repository ships a Claude Code plugin with five skills. Each skill documents a part of the SQL API — function signatures, option names, role tokens and lint codes — so that Claude Code can write charts and dashboards for this extension from a plain-language request such as "build a dashboard of weekly revenue by channel with a region filter".
Install it in a Claude Code session:
/plugin marketplace add DataZooDE/anofox-visualization
/plugin install anofox-visualization@anofox-visualization
| Skill | Covers |
|---|---|
anofox-visualization-charts |
SQL → SVG: anofox_render(spec) (rows + roles JSON, size, brand colour, limits), the column macros anofox_bar/_line/_scatter/_area/_xy/_xyc and their kind := values, one SVG per group, saving SVGs, errors, the community (render-only) vs full-toolkit build |
anofox-visualization-dashboards |
Authoring ::ROLE dashboards (the build-dashboard workflow): every role, layout and tabs, KPIs with delta / sparkline / goal, ::PERIOD, tables, inputs and getvariable(), cross-filter, drill-down and URL state, annotations, forecast fans and strips, thresholds, waterfall / bullet / funnel, ::DIAGRAM, motion, Markdown values and formulas, contract plots as panels, Explore data, dashboard --describe / --check and its lint codes, the design contract, templates and gotchas |
anofox-visualization-statistics-plots |
The contract macros anofox_plot_terms/_summary/_obs/_diagnostics/_prediction/_curve/_tests/_compare/_partial/_events/_diagram, the newer _decomposition/_cv/_checks (provisional) and _matrix, and anofox_plot with all options, column aliases, anofox_contract_version(), the producer → macro table for anofox-statistics v0.11, anofox-forecast and anofox-tabular, results from Python (the anofox_viz package) and R, use in dashboards and the browser builder |
anofox-visualization-serving |
anofox_serve, anofox_serve_dashboards, anofox_serve_refresh, anofox_serve_stop and the serve / dashboard binaries: which mode to use, the trust model, every option and limit, cache and refresh, a data folder, header comments, deployment (systemd, Docker, reverse proxy, replicas) |
anofox-visualization-access-control |
Login on a locked server (auth proxy, JWT, OIDC, signed embed links, API keys), the __claim_* variables, row and column access policies, dashboard --check --policy, request and audit logs |
The skills live in plugins/anofox-visualization/. To use a local checkout instead of the marketplace, start Claude Code with claude --plugin-dir ./plugins/anofox-visualization. Every sql block in the skills is executed in CI against the built extension (scripts/validate_skills_sql.py; dashboard scripts are linted with dashboard --check --strict).
Dependencies
- DuckDB: v1.5.x for the CMake / community build (pinned to v1.5.6 in this repo; also builds and runs sqllogictests on v2.0.0 in a non-blocking CI job — see DuckDB 2.0); C-API v1.2.0+ (DuckDB v1.2 or newer, including 2.0) for the
duckextfull-toolkit build - Rust: stable toolchain (for building from source)
- ggplot-rs (version pinned in
Cargo.toml): the grammar-of-graphics rendering engine — all chart rendering lives here, not in this repository - plotters / image / ab_glyph: SVG & raster backends (via Cargo)
Telemetry
This extension collects no telemetry — no usage data, no query contents,
nothing leaves your machine.
The anofox extensions it plots (statistics, forecast, tabular, optimize,
decide) send pseudonymous usage telemetry by default, but it is off by
default wherever anofox-visualization runs (#333): the dashboard/serve
binaries and the anofox_visualization extension itself defaultDATAZOO_DISABLE_TELEMETRY to 1 for the process whenever it is unset or
empty (a templated VAR=${VAR} left blank is not a choice), before any
anofox extension they load can send anything — SET anofox_telemetry_enabled = false alone misses the load event and, with
several loaded, all but the first. To opt back in, setDATAZOO_DISABLE_TELEMETRY=0 (or false/no) yourself before anofox-
visualization loads.
Windows: the default is written to both the OS environment and the C
runtime (#348), so it also holds for any other anofox extension sharing the
same C runtime. An anofox extension loaded before anofox_visualization is
only reached through the best-effort SET anofox_telemetry_enabled = false
— load anofox_visualization first, or set the variable yourself.
The browser demo's DuckDB-Wasm builds send nothing. See
Telemetry of the anofox extensions.
License
This project is licensed under the Business Source License 1.1 (BSL 1.1).
Key Terms
- Usage Grant: free to use, modify, and distribute for development, testing, research, and internal use
- Production Use: hosted / embedded redistribution to third parties requires a commercial license until the Change Date
- Change Date: five years after first publication
- Change License: Mozilla Public License 2.0
See LICENSE for full terms.
Why BSL?
The BSL keeps the source open for development, research, and internal use, and
converts to a fully open licence over time — while protecting the project's
long-term viability. For commercial hosted/embedded use before the Change Date,
contact [email protected].
Contributing
Contributions are welcome:
- Fork the repository
- Create a feature branch
- Make your changes with tests (
cargo test;dashboard --checkfor example dashboards) - Submit a pull request
Areas for Contribution
- New chart kinds and roles
- Additional
design/*lint checks and the visual-review loop - Documentation, guides, and example dashboards
- Bug reports and fixes; performance work
Feedback
If a chart renders wrong, or anofox_render returns something you did not expect,
please open an issue.
Rendering depends on your data shape, roles and dimensions in ways we cannot
reproduce here, so a report with the spec you passed is the fastest path to a fix.
If it saved you time, a star on the repo helps other people find it.
The first time you load the extension in an interactive terminal each day, a small
banner says the same thing. It never prints when output is piped, in notebooks, or in
CI. Silence it with SET datazoo_banner = false; or DATAZOO_NO_BANNER=1.
Support
- Documentation: docs/
- Issues: GitHub Issues
- Discussions: GitHub Discussions
- Email: [email protected]
Citation
@software{anofox_visualization,
  title  = {Anofox Visualization: Charts & Dashboards for DuckDB from SQL},
  author = {DataZoo DE},
  year   = {2025},
  url    = {https://github.com/DataZooDE/anofox-visualization}
}
Acknowledgments
- DuckDB Team — the database and extension framework
- ggplot-rs — the grammar-of-graphics rendering engine
- Open Source Community — for contributions and feedback
© DataZoo GmbH.
Reviews (0)
Sign in to leave a review.
Leave a reviewNo results found