tempa
Health Uyari
- License — License: Apache-2.0
- Description — Repository has a description
- Active repo — Last push 0 days ago
- Low visibility — Only 5 GitHub stars
Code Uyari
- network request — Outbound network request in src/assets/js/30-modals.js
Permissions Gecti
- Permissions — No dangerous permissions requested
Bu listing icin henuz AI raporu yok.
A long-running agent harness for building software from ideas.

Tempa — Agentic Coding Automation Harness



Turn a spec into a working app — clarified, planned, implemented, and QA'd
automatically, while you do something else.
Turning a spec into working software usually means endless manual back-and-forth:
clarifying vague requirements, breaking the work into a plan, implementing it feature by
feature, and catching bugs before they pile up — one agent session at a time, babysat
from start to finish.
Tempa automates that entire loop. It drives an agentic coding CLI — Claude Code,
GitHub Copilot CLI, or OpenAI Codex CLI, your pick per stage — repeatedly and
unattended: clarifying your PRD until nothing critical is left ambiguous, drafting a plan
(epic → feature → task), implementing it, and running QA — start it once, walk away, and
come back to real progress instead of a blank terminal. It runs on whichever CLI's login
you already have (Claude, GitHub Copilot, or ChatGPT/OpenAI) — no separate per-token API
billing to provision or watch. See Choosing a CLI Backend below.
Official repo: github.com/daus95/tempa
Once set up, the recommended way to drive Tempa is the web dashboard
(tempa dashboard) — see Dashboard (Recommended) below. Every
dashboard action also has an equivalent CLI command (tempa <command>), for power users
or scripting.
Contents
- Quick Start
- Setup (One-Time Only)
- Choosing a CLI Backend
- Dashboard (Recommended)
- Command Line Interface (CLI)
- Further Reference
Quick Start
Already have Python 3 and an authenticated backend CLI installed (Claude Code, GitHub
Copilot CLI, or OpenAI Codex CLI — Claude Code is the default)? This is the fast path.
Missing one of those, or want the full explanation of each step? See
Setup (One-Time Only) below instead.
Download & extract — ⬇ Download tempa.zip
to a folder outside your project repo. Details:
Setup Step 2 — Download & Install.Open the dashboard — double-click
Open Dashboard.cmd(Windows) /Open Dashboard.command(macOS) /Open Dashboard.sh(Linux) in that folder.Point Tempa at your project: on the Home page, click Select Working Folder and
pick your project folder — no terminal needed. (Linux: needszenityorkdialog
installed for the picker dialog — both ship by default on most desktop distros; if
neither is installed, use the CLI fallback instead: from inside the extracted folder,
run./tempa init C:\repo\<your-repo>then reload the dashboard.)
Follow the dashboard's checklist — Upload Specification → Clarification → Start
Implementation. See Dashboard (Recommended).
Prefer the terminal for everything? See
Command Line Interface (CLI) for the full command-driven
workflow (tempa init, tempa clarify, tempa implement).
Setup (One-Time Only)
Done once per machine. Once this is done, the recommended way to do the recurring work
is the Dashboard section below — power users can use the CLI
Command Line Interface (CLI) section instead (its first step points
Tempa at your project).
Step 1 — Prerequisites
- Python 3 installed (
py/pythonon PATH). - At least one agentic coding CLI installed and on PATH — Tempa defaults every stage to
Claude Code (claude), but you can point any stage at GitHub Copilot CLI
(copilot) or OpenAI Codex CLI (codex) instead, or mix them. See
Choosing a CLI Backend below. The harness always runs its
chosen CLI in fully automated mode (no human confirmation) — Claude Code via--dangerously-skip-permissions, Copilot via--allow-all-tools, Codex via--dangerously-bypass-approvals-and-sandbox. - Already logged in / authenticated with whichever of those CLI(s) you plan to use.
Step 2 — Download & Install
Download the Tempa code as a ZIP file (no clone needed), then extract it to the folder you
want:
Put the extracted contents in a folder separate from, and outside, the repo you're going
to work on — don't put it inside your repo folder, so it doesn't get committed to your git
repo. Keep the whole folder together: the launcher puts src/ on the import path and the
modules import each other by name, so nothing works if they're separated. For example, if
your repo is at C:\repo\<your-repo>, place Tempa as a sibling folder, e.g. C:\tools\tempa
or C:\repo\tempa (not C:\repo\<your-repo>\tempa). Full layout of what's inside that
folder: docs/folders-and-paths.md.
Add that Tempa folder to your PATH so the tempa command works from anywhere:
- Windows: add the folder (e.g.
C:\tools\tempa) to your userPATH, then open a new
terminal.tempa <command>runstempa.cmd, which callstempa <command>internally. - macOS/Linux: add the folder to your
PATH(e.g. in~/.zshrc/~/.bashrc:export PATH="$HOME/tools/tempa:$PATH"), then open a new terminal.tempa <command>runs
thetempascript, which callspython3 tempa.py <command>internally — nochmodneeded,
the executable bit is already set in the repo.
Prefer not to touch PATH? Run it directly from inside the Tempa folder instead. Everytempa <command> in the rest of this README means one of these three — pick the line for your
setup:
tempa <command>            # PATH set (any OS)
./tempa.cmd <command>      # Windows, without PATH
./tempa <command>          # macOS/Linux, without PATH
Quickly check everything is ready before moving to the next step — it verifies the CLI backend
configured for the implement stage (Claude Code by default) can Write/Read/Delete a file:
tempa test                 # PATH set (any OS)
./tempa.cmd test           # Windows, without PATH
./tempa test               # macOS/Linux, without PATH
No terminal? Double-click to open the dashboard
If you found the Tempa folder in Windows Explorer / macOS Finder / a Linux file manager and
would rather not open a terminal at all, double-click the launcher for your OS instead of
running tempa dashboard:
| OS | File | Notes |
|---|---|---|
| Windows | Open Dashboard.cmd |
Double-click. A console window opens with the dashboard's log — that's normal, not an error. |
| macOS | Open Dashboard.command |
Double-click. First run: right-click → Open once (Gatekeeper blocks unsigned scripts on a plain double-click), then double-click normally afterwards. |
| Linux | Open Dashboard.sh |
Most file managers require marking it executable first — right-click → Properties → Permissions → Allow executing (or run chmod +x "Open Dashboard.sh" once from a terminal) — then double-click, or Run if prompted. |
Each one does exactly what tempa dashboard does and opens your browser to it. Keep the
window that opens alongside your browser open — that's the server; closing it stops the
dashboard. If Python isn't installed, the window explains that and waits so you can read it.
Choosing a CLI Backend
Tempa doesn't run its own model — it drives an existing agentic coding CLI on your machine.
Three are supported, and every stage (Clarification / Planning / Implementation) picks its
own independently — so, for example, Clarification can run on Claude Code while
Implementation runs on OpenAI Codex CLI:
| Backend | CLI | Auth |
|---|---|---|
| Claude Code (default) | claude |
Your Claude subscription login (claude → /login) |
| GitHub Copilot CLI | copilot |
Your GitHub Copilot login (copilot login) |
| OpenAI Codex CLI | codex |
Your ChatGPT/OpenAI login (codex login) |
Whichever you use must already be installed, on PATH, and logged in yourself — Tempa only
invokes it, it never manages credentials for you.
Set it per stage from the dashboard's Settings → AI Models tab (a dropdown next to each
stage's model field), or from the CLI:
tempa set-backend --clarify claude --plan copilot --implement codex
tempa show-backends
Each backend has its own model catalog, so changing a stage's backend usually means updating
that stage's model too (the dashboard's model field suggests options based on the backend
picked, but always accepts free text). Each stage also has an optional Reasoning Effort
setting, right next to the model field — its valid choices depend on the backend and model
picked (Codex varies per model; Claude/Copilot are uniform per backend), and Tempa rejects a
combination that CLI doesn't actually support:
tempa set-effort --implement high
tempa show-efforts
Full reference, including what happens to a resumed/interrupted session's history when a
stage's backend changes mid-epic and the exact reasoning-effort levels per backend/model:
see docs/ai-models.md.
Not sure which of the three are actually usable on this machine? The dashboard's Home page
and Settings → AI Models tab both show a live ✅/⬜ CLI backend availability checklist
— installed on PATH and able to write to the current workspace — with a Detect CLI
Backends button there to re-check after installing or logging into one. See
docs/cli-availability.md.
The Settings page is organized into five tabs: AI Models (backend/model/reasoning effort
per stage), Runs (run limits, retry waits, poll interval, whether Tempa commits the
workspace to git after each epic passes QA, and whether processes a session leaves running
are terminated when it ends), Guardrails (what
clarification findings may block Finalized Clarification and Start Implementation),
Notifications (email alerts) and Maintenance (updates, restart server). One Save
Settings button at the bottom writes every tab at once, and it stays visible while you
scroll — it tells you when there are unsaved changes, including on a tab you're not looking
at.
Dashboard (Recommended)
Prefer the terminal, or need to script Tempa? Every action below has a matching CLI
command — skip ahead to Command Line Interface (CLI).
The dashboard walks you through the same specification → clarification → implementation
flow as the CLI, but with buttons, inline file editing, and live progress instead of
memorizing commands and flags. Start it with:
tempa dashboard            # PATH set (any OS)
./tempa.cmd dashboard      # Windows, without PATH
./tempa dashboard          # macOS/Linux, without PATH
This opens http://127.0.0.1:<port>/ in your browser (Ctrl+C in the terminal stops the
server). If the project hasn't been set up yet, the Home page shows a
Select Working Folder button — click it to pick your project via a native dialog and
Tempa sets it up for you, no terminal involved. (Linux: needs zenity or kdialog
installed — see below. Without either, run tempa init <path> from the CLI once instead,
then reload the dashboard.)
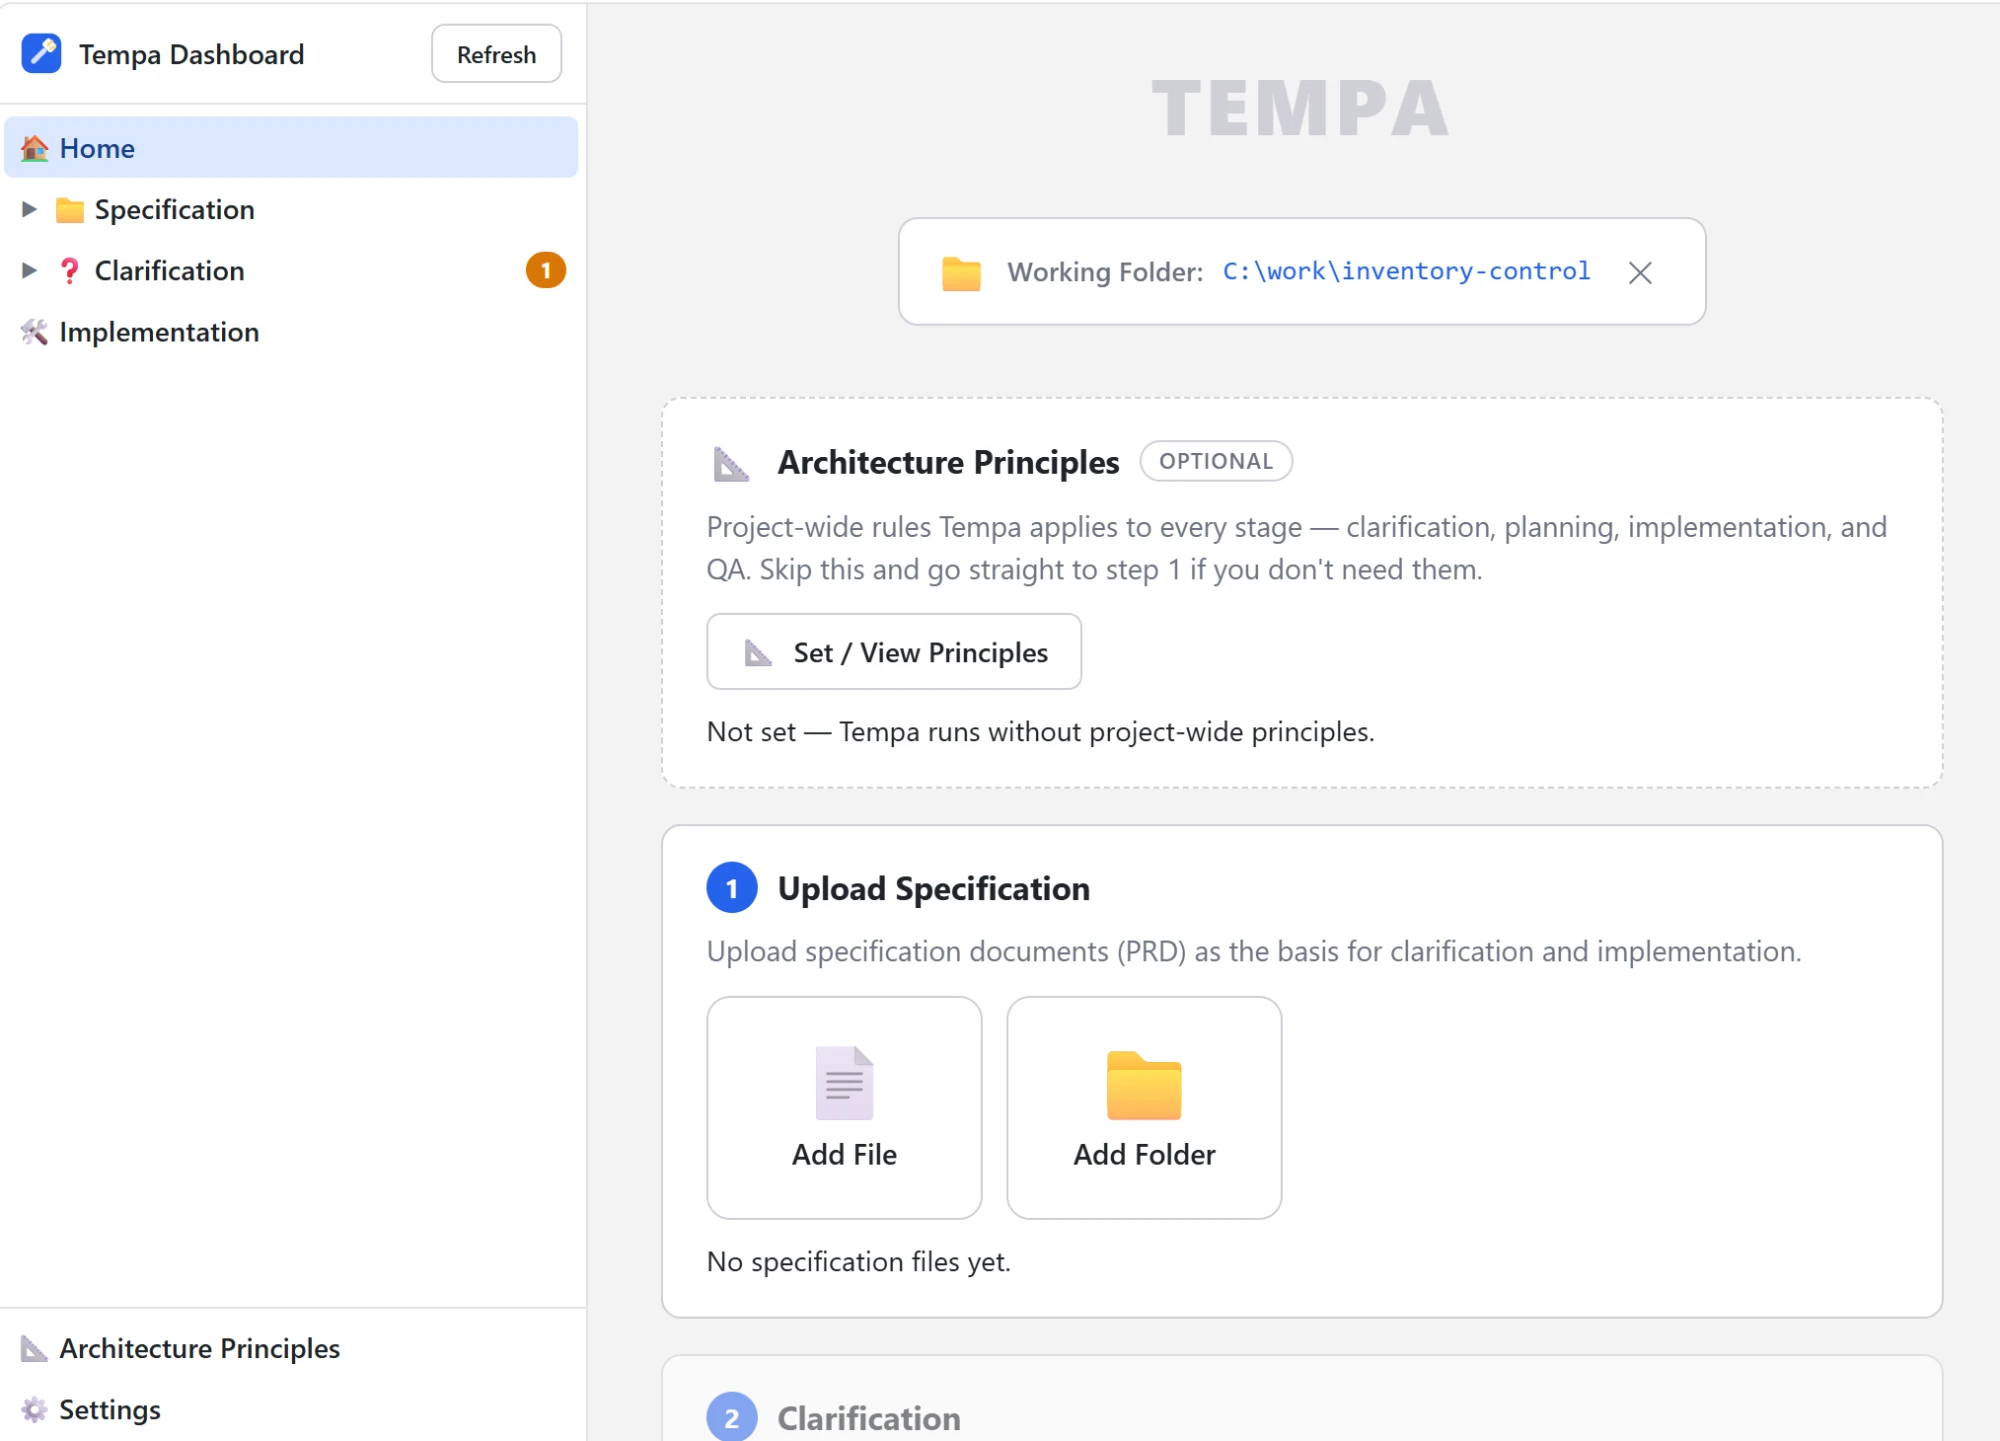
The Home page is a 3-step checklist; each step unlocks once the one before it is satisfied.
Above it sits one optional card you can ignore entirely:
┌╌╌╌╌╌╌╌╌╌╌╌╌╌╌╌╌╌╌╌╌╌╌╌╌╌╌╌┐
╎  Architecture Principles  ╎  (optional — skip straight to step 1)
└╌╌╌╌╌╌╌╌╌╌╌╌╌┬╌╌╌╌╌╌╌╌╌╌╌╌╌┘
              │
              ▼
┌───────────────────────────┐
│  1. Upload Specification  │
└─────────────┬─────────────┘
              │
              ▼
┌───────────────────────────┐
│  2. Clarification         │  (Start Clarification → answer → Apply Answers → repeat)
└─────────────┬─────────────┘
              │
              ▼
┌───────────────────────────┐
│  3. Start Implementation  │
└───────────────────────────┘
| Dashboard step | Equivalent CLI step |
|---|---|
Select Working Folder button (prerequisite, not shown above; Linux needs zenity/kdialog — see below) |
Step 1 — Initial Setup (tempa init <path>) |
| Step 1 — Upload Specification | Step 2 — Write the specification |
| Step 2 — Clarification | Step 3 — Answer clarifications (tempa clarify) |
| Step 3 — Start Implementation | Step 4 — Run implementation (tempa implement) |
Architecture Principles (optional)
Tempa runs your project through several separate agent sessions — clarification, planning,
implementation, QA, verification — potentially on different CLI backends (see
Choosing a CLI Backend) — and none of them remembers the previous
one. Architecture Principles is where you write the rules that should hold across all of
them: which database you
use, whether an ORM is allowed, how API errors are shaped, what has to be true before code counts
as done. Tempa prepends them to every prompt it sends, so the same rules stay in force
everywhere instead of each session falling back on generic defaults.
Click Set / View Principles on the card (or the sidebar entry) to open a free-form Markdown
editor, plus a Learn more page with worked examples and the mistakes to avoid. Saving an empty
box removes the principles again.
This is entirely optional — leave it empty and Tempa behaves exactly as it did before, with
nothing injected. Full reference: docs/architecture-principles.md.
Updates
Settings → Maintenance has an Updates card showing your installed version against the
latest published GitHub release. Click Check for Updates to refresh that comparison, and
— only when a newer release actually exists — Update Now to download and apply it in
place, no terminal needed. After a successful update, restart the running tempa dashboard/tempa implement process (not just reload this page) so it picks up the new
code; the dashboard tells you this explicitly once the update finishes. Full reference:
docs/updates.md.
Step 1 — Upload Specification
Click Add File or Add Folder to upload your PRD/spec documents straight from the
browser (they land in the same sources.prd folder tempa init created). Uploaded files
appear under Specification in the left sidebar — click one to View it as rendered
markdown, or switch to Edit and Save to change it right there, no separate editor
needed. ```mermaid blocks are drawn as actual diagrams in the viewer (with a Show source
toggle), so an ERD or a state machine in your PRD reads like one. Right-click a file or folder in the sidebar for Rename / Delete. You can upload
more than one file — Tempa reads all of them together during clarification and planning.
Only upload the new specification you want implemented here — not old/already-implemented
ones. Specifications for the existing system belong separately in the sources.docs
folder (default docs/), not here: plan drafting uses docs/ (and the code) as a reference
for "what already exists", so it doesn't duplicate work that's already done.
The new specification should ideally cover:
- Purpose of the application — what problem it solves, for whom.
- Business process — the workflow/steps the system needs to support.
- Data model — the main entities and their relationships.
- UI concept — a picture of the pages/interactions you want.
- Tech stack you want (language, framework, database, etc).
The more completely these five aspects are written up, the closer the resulting application
will match what you actually want. Full reference, with worked examples and common mistakes:
docs/writing-a-spec.md (also linked as What should go in here? →
next to Add File/Add Folder on the dashboard's Upload Specification step).
Not sure how to start, or just want to try Tempa out first? The examples/
folder has ready-to-use sample PRDs (from a simple client-side app to a full web app with a
database) — upload them here via Add File/Add Folder, or copy them straight into.tempa/specs/prd — see examples/README.md.
Step 2 — Clarification
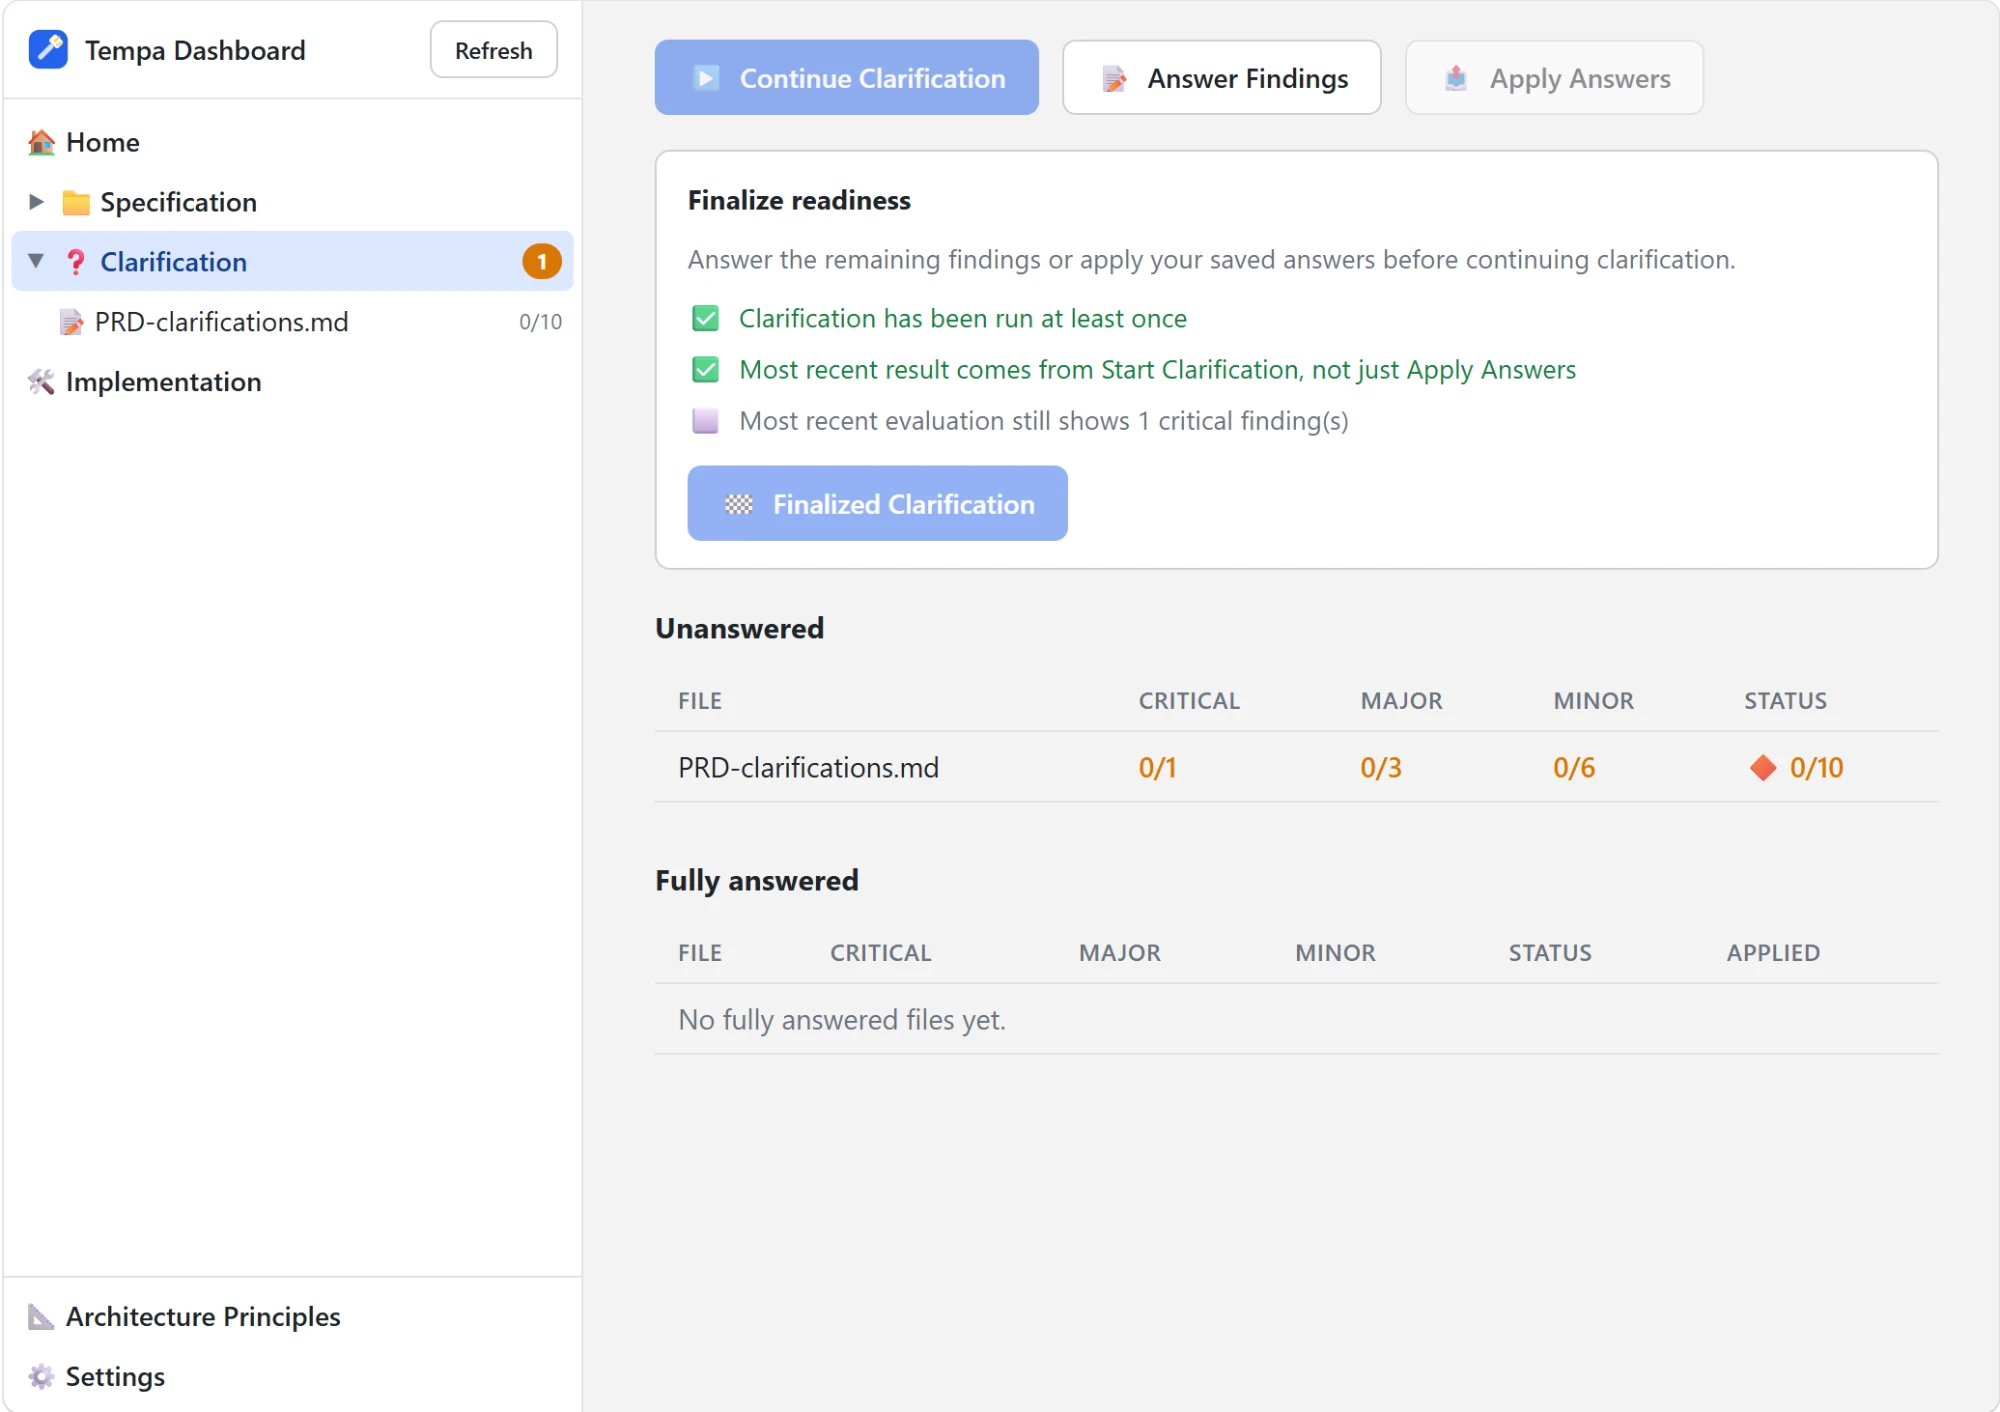
Start Clarification runs one evaluation pass and lists every finding (critical/major/
minor), grouped by file, under Clarification in the sidebar. Open a file to answer its
findings inline: for each finding, choose Follow the recommendation or I'll write my
own answer (a text box appears), then Save. Once clarification has run at least once,
the button relabels to Continue Clarification (with a hint explaining what's still
blocking it, if anything is) for the rest of this loop. While a run is in progress the button
swaps to Stop Now — click it (after a confirmation prompt) to cancel it early, the same
process-tree kill Step 3 uses. Its chevron offers Stop After Current Session instead: the
evaluate session finishes and records its findings, and nothing you've already paid tokens for
is thrown away. See Two ways to stop below.
You don't have to apply before continuing. Saved answers are carried into every
subsequent round as already-decided resolutions — the Pending resolutions card shows how
many are waiting — so the loop is simply evaluate → answer → evaluate, with no full PRD
rewrite in between. Only findings you haven't answered yet hold up the next round.
Apply Answers writes those resolutions into the PRD/spec whenever you want the documents
themselves brought up to date. It's required once, before Start Implementation in Step 3:
implementation reads the PRD, so decisions living only in a clarification file would be
invisible to it. It auto-chains through the backlog one file at a time until everything's
applied, so one click finishes the job; while it's running the button swaps to Stop Now,
with Stop After Current Session on its chevron — that one lets the apply session in flight
finish and stamp what it wrote, then skips the remaining files.
See docs/clarify-modes.md for the
details.
The page splits into an Overview tab (the Unanswered/Fully answered file tables below)
and a Log tab (raw console output for whichever run is in progress) — same pattern as the
Implementation page's Status/Log tabs (see Step 3 below). The run buttons and readiness
panels above them stay visible regardless of which tab is open, with a spinning status badge
next to the buttons showing live clarify/apply/finalize progress either way.
Answer manually during the early iterations (usually the first 3–4 rounds): early on,
the system doesn't yet have enough project context to guess your intent accurately — its
recommended answers can still be off. Important decisions (application purpose, business
process, tech stack, etc.) need your direct input first, so the PRD starts off pointed in
the right direction.
Finalized Clarification automates the rest of that loop (evaluate + answer, repeating
until clean, then one apply and one verification pass) — click it to let Tempa finish off any
remaining major/minor findings on its own. It only becomes clickable once the Finalize
readiness panel above it is fully satisfied (and no clarify run is already in progress):
- Clarification has been run at least once.
- The latest result came from Start Clarification itself, not just Apply Answers —
applying edits the PRD, not the finding record, so a fresh evaluation is what actually
confirms nothing critical is left. - That evaluation shows 0 critical findings.
- What backlog is left. Unanswered findings get filled in with their own recommendation
before the loop starts; anything already answered is carried into every round and written
into the PRD by the single apply at the end. This line is informational only, not part of
the gate above — a backlog isn't something you have to clean up by hand beforehand.
Settings → Guardrails tab → Allow finalizing with critical findings switch
(allow_finalize_with_critical in docs/config-json.md) waives all
three requirements above, not just the critical-findings one — with it on, Finalized
Clarification is clickable even before clarification has ever been run once, since its
own evaluate/answer/apply loop is what establishes and then resolves the finding set,
unsupervised.
When to switch to Finalize: after a few manual rounds, once you notice the system's
recommended answers over the last 2 iterations are already consistent/accurate with what you
intend (this usually starts showing around iteration 4 or 5) — by that point it has enough
context (from the PRD plus prior answers) that its recommendations can be trusted, and
continuing manually would just repeat the same outcome.
Finalize stops as soon as there are no more critical/major findings — some minor findings
may still remain, and that's fine: they'll be resolved anyway during implementation
(Step 3 below). So once it finishes, you can move straight on to implementation without
chasing down remaining minor findings.
This can take a while — Finalize repeats the evaluate → answer cycle on its own until
clean, which can mean several rounds depending on how much the PRD still needs resolving.
Switch to the Log tab to watch it live (running status plus streamed console output) so
you can tell it's still working rather than stuck. Finalized Clarification swaps to a
Stop Now button while it runs — click it (after a confirmation prompt) if you want to
cancel mid-way. Its chevron offers Stop After Current Round, which lets the round in
progress finish and exits from a clean, resumable boundary instead.
Running out of tokens doesn't break the run. If the configured backend's usage/session
limit is hit mid-way — during Start Clarification, Apply Answers, Finalized
Clarification, or Start Implementation in Step 3 below — the run doesn't fail. The
log reports that it's pausing ("this is not an error"), waits 30 minutes for the limit
to reset, then continues automatically — repeating for as long as the limit is still in
effect. Nothing is lost while it waits: answers, applied resolutions, and epic/feature
progress all live in files + config.json, so it picks up exactly where it left off rather
than starting over. This is built into tempa clarify/tempa implement themselves, so it
works the same way whether you're running them from the CLI or through the dashboard (which
just runs those same commands as a background process) — just leave it running. An
authentication failure is different — that one stops immediately, since only
re-authenticating can fix it.
Step 3 — Start Implementation
Once the most recent clarification evaluation satisfies the configured requirement,
Start Implementation unlocks (on the Home page, the Clarification overview, and the
Implementation section) — click it to run the same automated plan → implement → QA loop
as tempa implement. By default that requirement is no critical and no major findings,
but Settings → Guardrails tab → Start Implementation requires can relax it to no
critical findings (majors carried into implementation) or to no condition at all — seeimplementation_start_requirement in docs/config-json.md. Either
way, clarification must have been run at least once: a workspace with no clarification file
yet has zero findings simply from having nothing to count, which would otherwise satisfy
every level trivially. Every answer must also have been applied to the PRD — implementation
reads the PRD documents, so a decision that only exists in a clarification file would be
invisible to it. That condition holds at every setting level, including no condition; if
it's the only thing blocking, the button explains exactly that and Apply Answers clears
it. The requirement is enforced server-side too, not just by a greyed-out
button, so it holds for the dashboard regardless of what the page shows. The
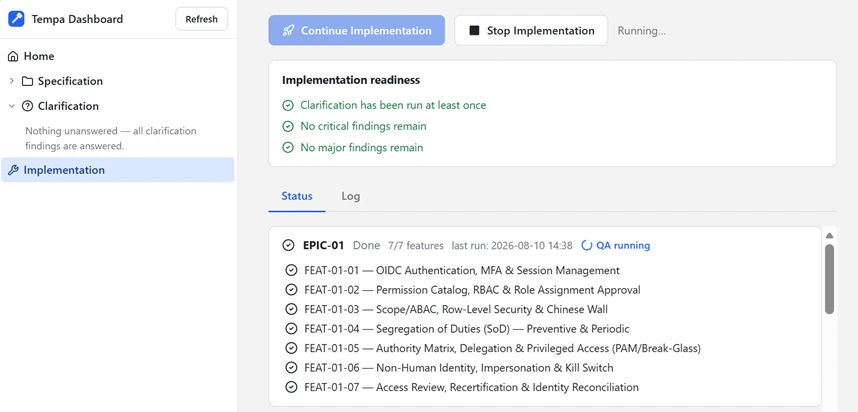
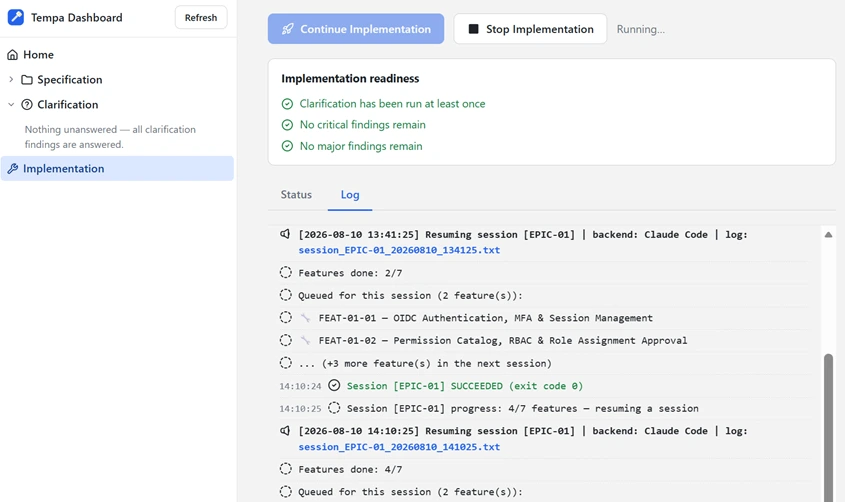
Implementation section's
Status tab shows live epic/feature progress and QA results; Log shows the raw
console output — any session_*.txt/qa_*.txt/process_*.txt filename it mentions is
clickable and opens that file in a viewer modal, see docs/logging.md;
Stop Now is available while it's running.
Two ways to stop
Every Stop button is a split button: the main half stops immediately, the chevron next to it
offers the patient option.
- Stop Now kills the runner and the backend CLI it spawned, right away. Whatever the agent
session in flight had worked out but not yet written is lost. Use it when you need the machine
back now. - Stop After Current Session (…Current Round for Finalized Clarification) leaves a
request instead. The session already running finishes and records its work as usual, and then
nothing new starts — so none of the tokens you've already spent are wasted, and the run resumes
from a clean boundary. While it's pending the status reads Stopping after current session…,
and the chevron offers Cancel Graceful Stop; Stop Now still works throughout, so asking
to stop politely never traps you into waiting.
Both are available from the terminal too, and it's the same request either way — tempa implement --stop-graceful stops a run you started from the dashboard, and the dashboard shows a request you
made in a terminal:
tempa implement --stop-graceful          # stop after the session in progress finishes
tempa implement --stop-graceful-cancel   # changed your mind
tempa clarify --stop-graceful            # same, for Apply Answers / Finalized Clarification
Commit after QA pass (on by default — Settings → Runs tab → "Version Control") has Tempagit commit the workspace right after each epic's QA verdict lands as a genuine pass, so a
long unattended run leaves a checkpoint per verified epic instead of one giant uncommitted
diff at the end. It's skipped silently (logged, not an error) if the workspace isn't a git
repository or there's nothing to commit; turn it off if you'd rather commit by hand. Seecommit_after_qa_pass in docs/config-json.md.
Terminate leftover processes (on by default — Settings → Runs tab → "Process Cleanup")
ends whatever a session left running when that session finishes — the dev server it started
to check its own work, a file watcher, a build daemon, a test runner — instead of leaving it
orphaned. Agent CLIs start long-running commands routinely and don't reliably stop them: in
one workspace a vite dev server was still holding its port 5.4 hours after the session that
started it had finished, alongside 15 idle build workers holding 1.9 GB between them. Each
session's CLI runs inside a container the operating system tears down with it — a Job Object
on Windows, a process group on Linux and macOS — so the session's whole process tree goes,
not just the CLI. It never asks what a process is, only who started it, so this works the
same whatever your project is built with. Anything genuinely detached (a Docker container, an
installed service) is out of scope. Turn it off only if you want a session's processes to
outlive it — nothing else will clean them up. See terminate_leftover_processes in
docs/config-json.md.
Once any epic has actually run, the button relabels itself to Continue Implementation —
the run resumes the existing plan rather than starting anything — and clicking it resets any
epic left in the failed state back to pending first (the same thingtempa implement --reset-failed does), then continues. Without that, a single failed epic
would make every click halt on the spot, since implement refuses to work past one. See
docs/start-implementation.md.
Clear All, under Settings → Maintenance → Danger Zone, deletes all plan/QA/log/clarification
results (your specification files are never touched) — useful for restarting the clarification
or implementation loop from scratch. This cannot be undone.
The ✕ next to the working-folder path (top of Home) detaches the current project (same
as tempa close-folder on the CLI) — no files are deleted, it just drops the link so you can
point Tempa at a different project next. The current project's config/history stays in its
own .tempa/ folder, ready to resume if you point Tempa back at it later.
The folder picker and "open in explorer" work on Windows and macOS out of the box. On Linux
they rely onzenity/kdialog(picker) andxdg-open(file manager) — all three ship by
default on most desktop distros, thoughxdg-openthere only opens the folder, it doesn't
force that window to the foreground the way Explorer/Finder do. Without any of those tools
installed, set the working folder withtempa init <path>(CLI) first, then use the
dashboard normally for the rest of the workflow — the ✕ icon works there too.
Command Line Interface (CLI)
Prerequisite: the Setup (One-Time Only) section above has been done. This is the
CLI/power-user path — the Dashboard above runs this exact same
workflow through buttons and inline forms instead.
┌───────────────────────────┐
│  1. Initial Setup         │
└─────────────┬─────────────┘
              │
              ▼
┌───────────────────────────┐
│  2. Write Specification   │
└─────────────┬─────────────┘
              │
              ▼
┌───────────────────────────┐
│  3. Answer Clarifications │  (loop: evaluate → answer → apply, until clean)
└─────────────┬─────────────┘
              │
              ▼
┌───────────────────────────┐
│  4. Run Implementation    │  (loop per epic: feature → QA → fixes)
└───────────────────────────┘
Step 1 — Initial Setup
Point Tempa at the project you want to work on with init, passing the (absolute) path
to your project folder:
tempa init C:\repo\<your-repo>
This command will:
- Make this project the active workspace, and save its config to
<your-repo>\.tempa\config.json(reused as-is if you've pointed Tempa at this project
before — otherwise created fresh). - Create the standard working folders in your project if they don't already exist — one of
them being thespecsfolder (kept inside.tempa/), where you'll place the specification
you want to work on.
Run this once per project. Safe to re-run — folders that already exist on disk are not
re-created, and their contents are never overwritten.
What you need to know at this point: put your new specification in the specs folder
(default: .tempa/specs/prd) inside that project. Full details on the working-folder
structure and AI model configuration are in
docs/folders-and-paths.md and
docs/ai-models.md — not required reading to get started.
Optionally, set your project's Architecture Principles — rules Tempa applies to every stage
that follows (see Architecture Principles above). They're
edited in the dashboard; from the CLI you can read the current value with:
tempa show-principles
Step 2 — Write the specification
Save it in the sources.prd folder (default .tempa/specs/prd) — and only that: the
new specification you want implemented. Don't put old/already-implemented specifications
here.
For what it should ideally cover, which specs belong in sources.docs instead, and
ready-to-use example PRDs to start from, see
Dashboard Step 1 — Upload Specification above — the
guidance is the same regardless of how you get the file there.
Step 3 — Answer clarifications (clarify)
The goal: the system asks about anything ambiguous/unclear in the PRD, you answer, and those
answers get applied back into the PRD — repeated until there are no more critical/major
findings. There are two ways to answer; both are used in sequence as part of the same flow,
not as alternatives to pick from. For when to use which, see
Dashboard Step 2 — Clarification above — the reasoning is the same
regardless of interface.
A. Answer manually
tempa clarify # evaluate: system writes questions + recommended answers to a file
Once the evaluation finishes, Tempa opens the clarification-answer web UI on the result
file so you can answer right there (add --noui to skip it). Clicking Save asks whether
to also start the next clarification round right away (Save & Clarify) or just save the
answers for now (plain Save) — either way they're carried into the next round; Save &
Clarify just skips the trip back to the overview to kick it off. Writing the answers into
the PRD itself is a separate step, done from the dashboard's Apply Answers button (see
Dashboard Step 2 — Clarification above) or tempa clarify --apply.
Prefer editing the markdown file by hand instead? That still works: edit the result file
yourself, then run tempa clarify --apply to apply it back into the PRD — run this way,
directly from a terminal, Tempa asks whether to run another clarification round right away
(y/N; only asked in an interactive terminal, non-interactive runs just exit). Re-open the
UI anytime with tempa answer — no file argument needed: it scanssources.clarifications for every result file and, as long as at least one still has an
unanswered finding, opens them all at once (one tab per file, badged complete/incomplete)
so you never have to hunt down which file still needs an answer.
B. Answer automatically (--finalize)
tempa clarify --finalize
Runs evaluate + answer + apply in a single automatic loop until clean, without you having to
answer one by one anymore.
Full reference for every mode (clarify manual, --auto-answer, --apply, --finalize):
see docs/clarify-modes.md.
Step 4 — Run implementation (implement)
tempa implement
Just run this. The system will (automatically, unattended): draft a plan if there's no task
yet → implement features one by one → run QA once an epic is done → fix any findings →
move on to the next epic, until everything is done.
A backend hiccup does not stop the run. If the AI provider's own API fails to process a
request because it is temporarily overloaded (Anthropic's transient 529 Overloaded),
Tempa treats it as a pause rather than a failure: it logs that it's waiting, sits out a
short delay (5 minutes by default), then retries the interrupted epic/QA automatically —
the same way it waits out a usage limit (30 minutes by default). Since the epic being
worked on is left resumable, the retry continues where it left off instead of starting the
epic over. These wait durations, along with the agent runner's poll interval, are
configurable from dashboard Settings → Runs tab → "Retries & Timing" card.
Before that retry resumes, Tempa also resets any epic the interrupted session left markedfailed in config.json back to pending — exactly what tempa implement --reset-failed
does by hand. This matters because failed is sticky and blocking: the runner deliberately
halts on a failed epic (Halted — session [x] at index i has failed), so without the reset
a single 529 could leave every later poll — and every later tempa implement run — failing
on that stale status even though nothing was actually broken. A real failure still stops
the runner and still keeps its failed status, so it stays visible for you to look at; in
that case fix the cause and run tempa implement --reset-failed yourself before continuing.
Nor does a backend CLI that finishes but never exits. If the CLI signals its turn is
complete but the process itself hangs afterward (e.g. stuck in its own cleanup), Tempa
force-terminates it after a 120-second grace period instead of waiting forever — and since
the epic/QA state already reflects everything that session did, this isn't treated as a
failure either; the run just resumes automatically. See
docs/start-implementation.md.
A plan that schedules an epic before something it actually depends on doesn't get stuck
either. If an epic keeps resuming without completing another feature, Tempa asks the
backend CLI which specific epic it's blocked on and, when it's safe to (the named epic
exists, isn't already done, and reordering it wouldn't just reverse an earlier move), moves
that dependency ahead of the stuck epic in the plan automatically — so the scheduler works on
the real blocker next instead of endlessly re-resuming an epic that can't proceed. When it
can't fix this on its own (most notably a genuine circular dependency between two epics), the
epic is marked failed with the session's own explanation shown right on the dashboard's
Status tab and in tempa status, for a human to resolve.
Full details (the --replan/--features flags, work priority, monitoring progress,
recovering from problems, manual verification): see
docs/start-implementation.md.
Further Reference
Not required reading to get started — see the Dashboard or Workflow above
first.
- Architecture — how Tempa's own codebase is put together (module map, CLI/dashboard
boundary), for anyone contributing to it: docs/architecture.md - Folder & Path Structure — what a working folder is,
workspace.*,sources.*:
docs/folders-and-paths.md - Writing a Specification — what a good PRD covers, worked examples, common mistakes:
docs/writing-a-spec.md - Architecture Principles — project-wide rules injected into every stage, how to write them:
docs/architecture-principles.md - AI Backend & Model per Stage — Claude Code / Copilot CLI / Codex CLI, why both are
differentiated per stage, default table, how to change them:
docs/ai-models.md - CLI Backend Availability — how the dashboard's ✅/⬜ readiness checklist (Home +
Settings → AI Models) is computed, what "ready" means, and the Detect CLI Backends button:
docs/cli-availability.md - Checking for Updates — how the Settings page's Maintenance tab (and the CLI equivalents)
check and apply new releases, and why a restart is required afterward:
docs/updates.md - Command Reference — full list of every command:
docs/command-reference.md config.jsonstructure — every key and what it does:
docs/config-json.md- Prompt templates (the
src/prompt/folder) — file list & how to customize harness behavior:
docs/prompt-templates.md - Logs & output — where logs for each session/stage live:
docs/logging.md
Yorumlar (0)
Yorum birakmak icin giris yap.
Yorum birakSonuc bulunamadi