ntoseye
Health Gecti
- License — License: MIT
- Description — Repository has a description
- Active repo — Last push 0 days ago
- Community trust — 152 GitHub stars
Code Basarisiz
- eval() — Dynamic code execution via eval() in commands/offense.py
- eval() — Dynamic code execution via eval() in examples/walk_modules.py
Permissions Gecti
- Permissions — No dangerous permissions requested
Bu listing icin henuz AI raporu yok.
Windows kernel debugger for Linux hosts running Windows under KVM/QEMU
ntoseye 

Windows kernel debugger for Linux hosts running Windows under KVM/QEMU. Essentially, WinDbg for Linux.
Features
- Command line interface
- WinDbg style commands
- Kernel debugging
- PDB fetching & parsing for offsets
- Breakpointing (kernel, usermode)
- Bugcheck analysis (decodes the bug check code, parameters, and faulting site on a guest crash)
- Three backends: Windows KD over a serial pipe (KDCOM, default), QEMU's
gdbstub, and passive memory introspection (see Choosing a backend) - Python SDK
- Custom commands
- MCP integration
Supported Windows
ntoseye currently only supports Windows 10 and 11 guests.
Disclaimer
ntoseye needs to download symbols and images to initialize required offsets, it will only download symbols from Microsoft's official symbol server. All files which will be read/written to will be located in $XDG_CONFIG_HOME/ntoseye, which includes the following subfolders:
commands/for custom scripted commandsimages/for binaries downloaded from the VMsymbols/for PDBs
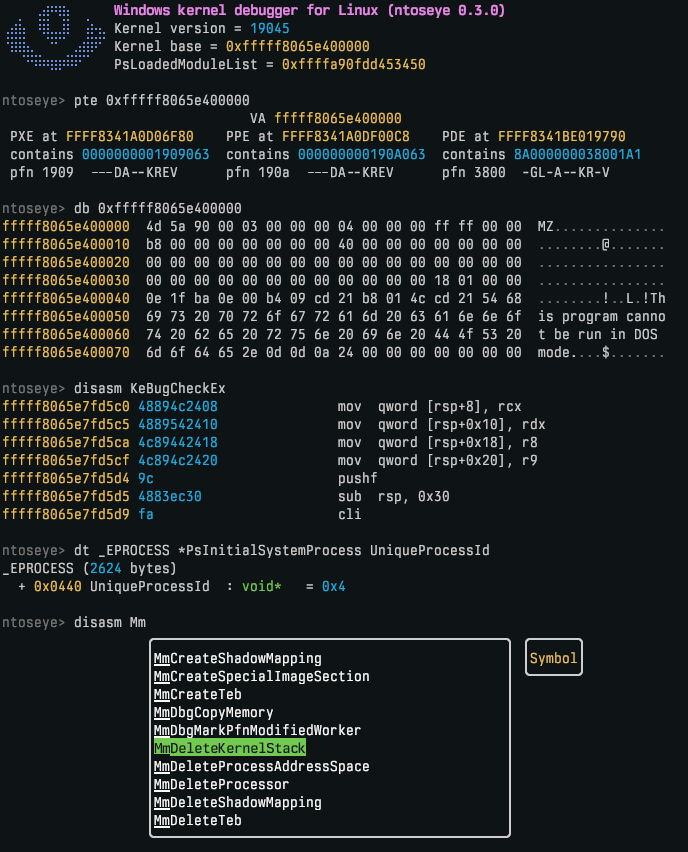
Preview
Installation
Install via shell script
curl --proto '=https' --tlsv1.2 -LsSf https://github.com/dmaivel/ntoseye/releases/latest/download/ntoseye-installer.sh | sh
Install via cargo
cargo install ntoseye
Building
git clone https://github.com/dmaivel/ntoseye.git
cd ntoseye
cargo build --release
The default build embeds Python for in-REPL custom commands, so it links libpython and needs the Python dev lib (python3-dev / python3-devel). To build without it:
cargo build --release --no-default-features --features cli,mcp
Usage
Quickstart
The default and recommended backend is kd (KDCOM), which runs Windows KD over a QEMU serial socket. For a libvirt/virt-manager guest, the fastest path is:
- Configure the VM transport with
ntoseye virsh: pick the domain, choose configure debug transports, thenkd. (Prefer editing the XML yourself? See VM configuration.) - In the guest, enable kernel debugging and reboot (Administrator PowerShell):
bcdedit /debug on bcdedit /dbgsettings serial debugport:1 baudrate:115200 Restart-Computer - On the host, relax ptrace scope so
ntoseyecan attach to QEMU (resets on reboot):echo 0 | sudo tee /proc/sys/kernel/yama/ptrace_scope - Start the VM, then run
ntoseye.
For guests that aren't configured for KD, see Choosing a backend for the gdb and memory alternatives.
The debugger is self-documented: run ntoseye --help for command-line arguments, and press tab in the REPL for completions and descriptions of commands, symbols, and types.
Choosing a backend
ntoseye can talk to the guest three ways. Pick with --backend kd (default), --backend gdb, or --backend memory.
kd (default) |
gdb |
memory |
|
|---|---|---|---|
| Transport | Windows KD over a serial pipe (KDCOM) | QEMU's gdbstub |
None; /dev/kvm memory introspection only |
| Requires in-guest configuration | Yes (bcdedit /debug on; anti-debug code, PatchGuard, and some Windows behaviour change once enabled) |
No (guest is unaware it's being debugged) | No |
| Requires host VM configuration | Yes (serial socket) | Yes (-s -S) |
No |
| Execution control | Yes | Yes | No |
| Kernel breakpoints | Yes | Yes | No |
| Usermode breakpoints | Yes | No | No |
| Kernel breakpoint mechanism | DbgKdWriteBreakPointApi |
gdb Z0 packets |
No |
See VM configuration for the host-side setup of each backend.
VM configuration
Manual host-side setup for each backend. libvirt/virt-manager users can do most of this automatically with ntoseye virsh (see Quickstart); ntoseye virsh can also remove ntoseye-managed debug transports later.
GDBSTUB
Fallback backend for guests that are not configured for Windows KD. Expose QEMU's gdbstub on 127.0.0.1:1234 by passing -s -S, then run with --backend gdb.
[!NOTE]
Do not enable kernel debug mode (bcdedit /debug on) in the guest when using thegdbbackend. That setting is only for thekdbackend, and thegdbbackend's whole advantage is that the guest is unaware it's being debugged. With debug mode on, the kernel changes behaviour (anti-debug code, PatchGuard) and expects a KD debugger to service breaks, while nothing on thegdbside answers the KD transport, so the guest can hang onDbgBreakPoint/exceptions. Leave debug mode off.
QEMU
Append -s -S to the qemu command.
virt-manager
Add the following to the XML configuration:
<domain xmlns:qemu="http://libvirt.org/schemas/domain/qemu/1.0" type="kvm">
  ...
  <qemu:commandline>
    <qemu:arg value="-s"/>
    <qemu:arg value="-S"/>
  </qemu:commandline>
</domain>
KDCOM
Default backend. In the guest, enable kernel debugging (run as Administrator, then reboot):
bcdedit /debug on
bcdedit /dbgsettings serial debugport:1 baudrate:115200
Use debugport:2 instead of :1 if the KD chardev ends up as COM2 (see the virt-manager subsection below).
QEMU
Add a Unix-socket chardev and route a serial port to it:
-chardev socket,id=kd,path=/tmp/ntoseye-kd.sock,server=on,wait=off -serial chardev:kd
Then connect: ntoseye.
The initial KD handshake timeout is 8 seconds by default. For unusually slow guests, override it with NTOSEYE_KD_TIMEOUT=<seconds>.
virt-manager
[!WARNING]
virt-manager auto-adds a<serial>console device on every VM, which
claims COM1. Either replace that device with one pointing at the KD socket
(KD becomes COM1, usedebugport:1), or leave it and add the KD chardev
viaqemu:commandline(KD becomes COM2, usedebugport:2).
Option A (recommended): replace the auto-added serial. KD is COM1, debugport:1 is correct.
<serial type="unix">
  <source mode="bind" path="/tmp/ntoseye-kd.sock"/>
  <target type="isa-serial" port="0"/>
</serial>
Option B: keep the auto-added serial and append the KD chardev via qemu:commandline. If KD is COM2, use debugport:2.
<domain xmlns:qemu="http://libvirt.org/schemas/domain/qemu/1.0" type="kvm">
  ...
  <qemu:commandline>
    <qemu:arg value="-chardev"/>
    <qemu:arg value="socket,id=kd,path=/tmp/ntoseye-kd.sock,server=on,wait=off"/>
    <qemu:arg value="-serial"/>
    <qemu:arg value="chardev:kd"/>
  </qemu:commandline>
</domain>
Memory
Passive backend for guests where you only want /dev/kvm memory introspection. It requires no guest or VM debug transport configuration:
ntoseye --backend memory
Execution control, registers, execution-context selection, breakpoints, debug output, bugcheck stops, and reload detection are unavailable in this mode. Run capabilities in the REPL for the exact backend feature matrix.
Recommended guest tweaks
Although not required, disabling memory paging and compression in the guest avoids memory-related issues. This only needs to be done once per Windows installation (Administrator PowerShell):
Get-CimInstance Win32_ComputerSystem | Set-CimInstance -Property @{ AutomaticManagedPagefile = $false }
Get-CimInstance Win32_PageFileSetting | Remove-CimInstance
Disable-MMAgent -MemoryCompression
Restart-Computer
Python SDK
Drive the debugger from Python with the ntoseye module: the same introspection and run-control surface as the REPL (memory/struct reads, expression eval, symbol/type lookup, disassembly, backtraces, breakpoints, execution control, process enumeration), with Python owning the loop. The wheel is self-contained, so this needs neither the ntoseye CLI nor a build with the embedded interpreter.
Install via pip
pip install ntoseye
Usage
import ntoseye

# defaults to backend="kd", connect="/tmp/ntoseye-kd.sock"
dbg = ntoseye.attach()

for proc in dbg.processes():  # _EPROCESS cursors
    print(proc.UniqueProcessId, proc.ImageFileName, hex(proc.addr))

fun = dbg.eval("nt!KeBugCheckEx")
print(hex(fun), dbg.read(fun, 16).hex())
The module is a native extension built with maturin; see ntoseye-py/README.md for build info and examples/ for standalone scripts.
Custom commands
In addition to the standalone Python SDK, ntoseye can run Python commands inside the live REPL; the same SDK, but bound to the session you're already debugging rather than a separate attach. This requires a build with the embedded interpreter (which is enabled by default).
Drop any *.py file in $XDG_CONFIG_HOME/ntoseye/commands/; they're auto-loaded at REPL startup. Run reload in the REPL to pick up edits without restarting.
Custom commands need no pip install ntoseye as the module is served by the embedded interpreter. However, it may be worth installing to get LSP completions and type diagnostics while you write them.
import ntoseye.repl as repl

# repl.Process is the completion type for processes, so the user can make use of `> hide ..<TAB>`
@repl.command("hide", "Unlink a process.\n(usage: hide <pid|name>)", target=repl.Process)
def hide(dbg: repl.Debugger, target=None):
    p = dbg.process(target)
    ...
See commands/ for more examples.
MCP integration
ntoseye can run as an MCP server, exposing the debugger as tools to MCP clients. It reads the top-level --backend/--connect flags to choose how to attach, so the VM and its debug transport must be set up exactly as for the REPL (see Choosing a backend). Only one consumer of the VM can run at a time.
[!IMPORTANT]
The server attaches on launch, so bring up the guest and its debug transport before starting the client.
stdio (default)
The MCP client launches ntoseye mcp as a subprocess and talks to it over stdin/stdout. Most desktop MCP clients are configured with a JSON file listing the command to spawn:
{
  "mcpServers": {
    "ntoseye": {
      "command": "ntoseye",
      "args": ["mcp"]
    }
  }
}
Top-level flags go before the mcp subcommand, e.g. to pin the backend and socket:
{
  "mcpServers": {
    "ntoseye": {
      "command": "ntoseye",
      "args": ["--backend", "kd", "--connect", "/tmp/ntoseye-kd.sock", "mcp"]
    }
  }
}
Use an absolute path for command (e.g. ../target/release/ntoseye) if ntoseye isn't within PATH.
Streamable HTTP
For web MCP clients that connect over the network instead of spawning a subprocess, use --http:
ntoseye mcp --http 127.0.0.1:8080
The service is mounted at http://127.0.0.1:8080/mcp. HTTP binds are loopback-only by default, since the tool surface includes execution control and guest writes; pass --unsafe-http to bind a non-loopback address and expose those tools to the network (only on trusted hosts).
Credits
Functionality regarding initialization of guest information was written with the help of the following sources:
Yorumlar (0)
Yorum birakmak icin giris yap.
Yorum birakSonuc bulunamadi