dunetrace
Health Gecti
- License — License: NOASSERTION
- Description — Repository has a description
- Active repo — Last push 0 days ago
- Community trust — 43 GitHub stars
Code Basarisiz
- rm -rf — Recursive force deletion command in .github/workflows/publish.yml
- network request — Outbound network request in dashboard/graph.jsx
- process.env — Environment variable access in packages/mcp-server/dunetrace_mcp/server.py
- network request — Outbound network request in packages/mcp-server/dunetrace_mcp/server.py
Permissions Gecti
- Permissions — No dangerous permissions requested
Bu listing icin henuz AI raporu yok.
Real-time monitoring of your production agents. No raw content transmitted.
Dunetrace

Real-time monitoring for production AI agents. Catches failures before your users do.

![]()
![]()

The problem
AI agents fail in ways that look fine from the outside.
Your API returns 200. Your logs are clean. But the agent just called the same tool 12 times in a row, burned $10 in tokens, and gave the user a wrong answer or no answer at all. The user didn't get a response. You didn't get an alert.
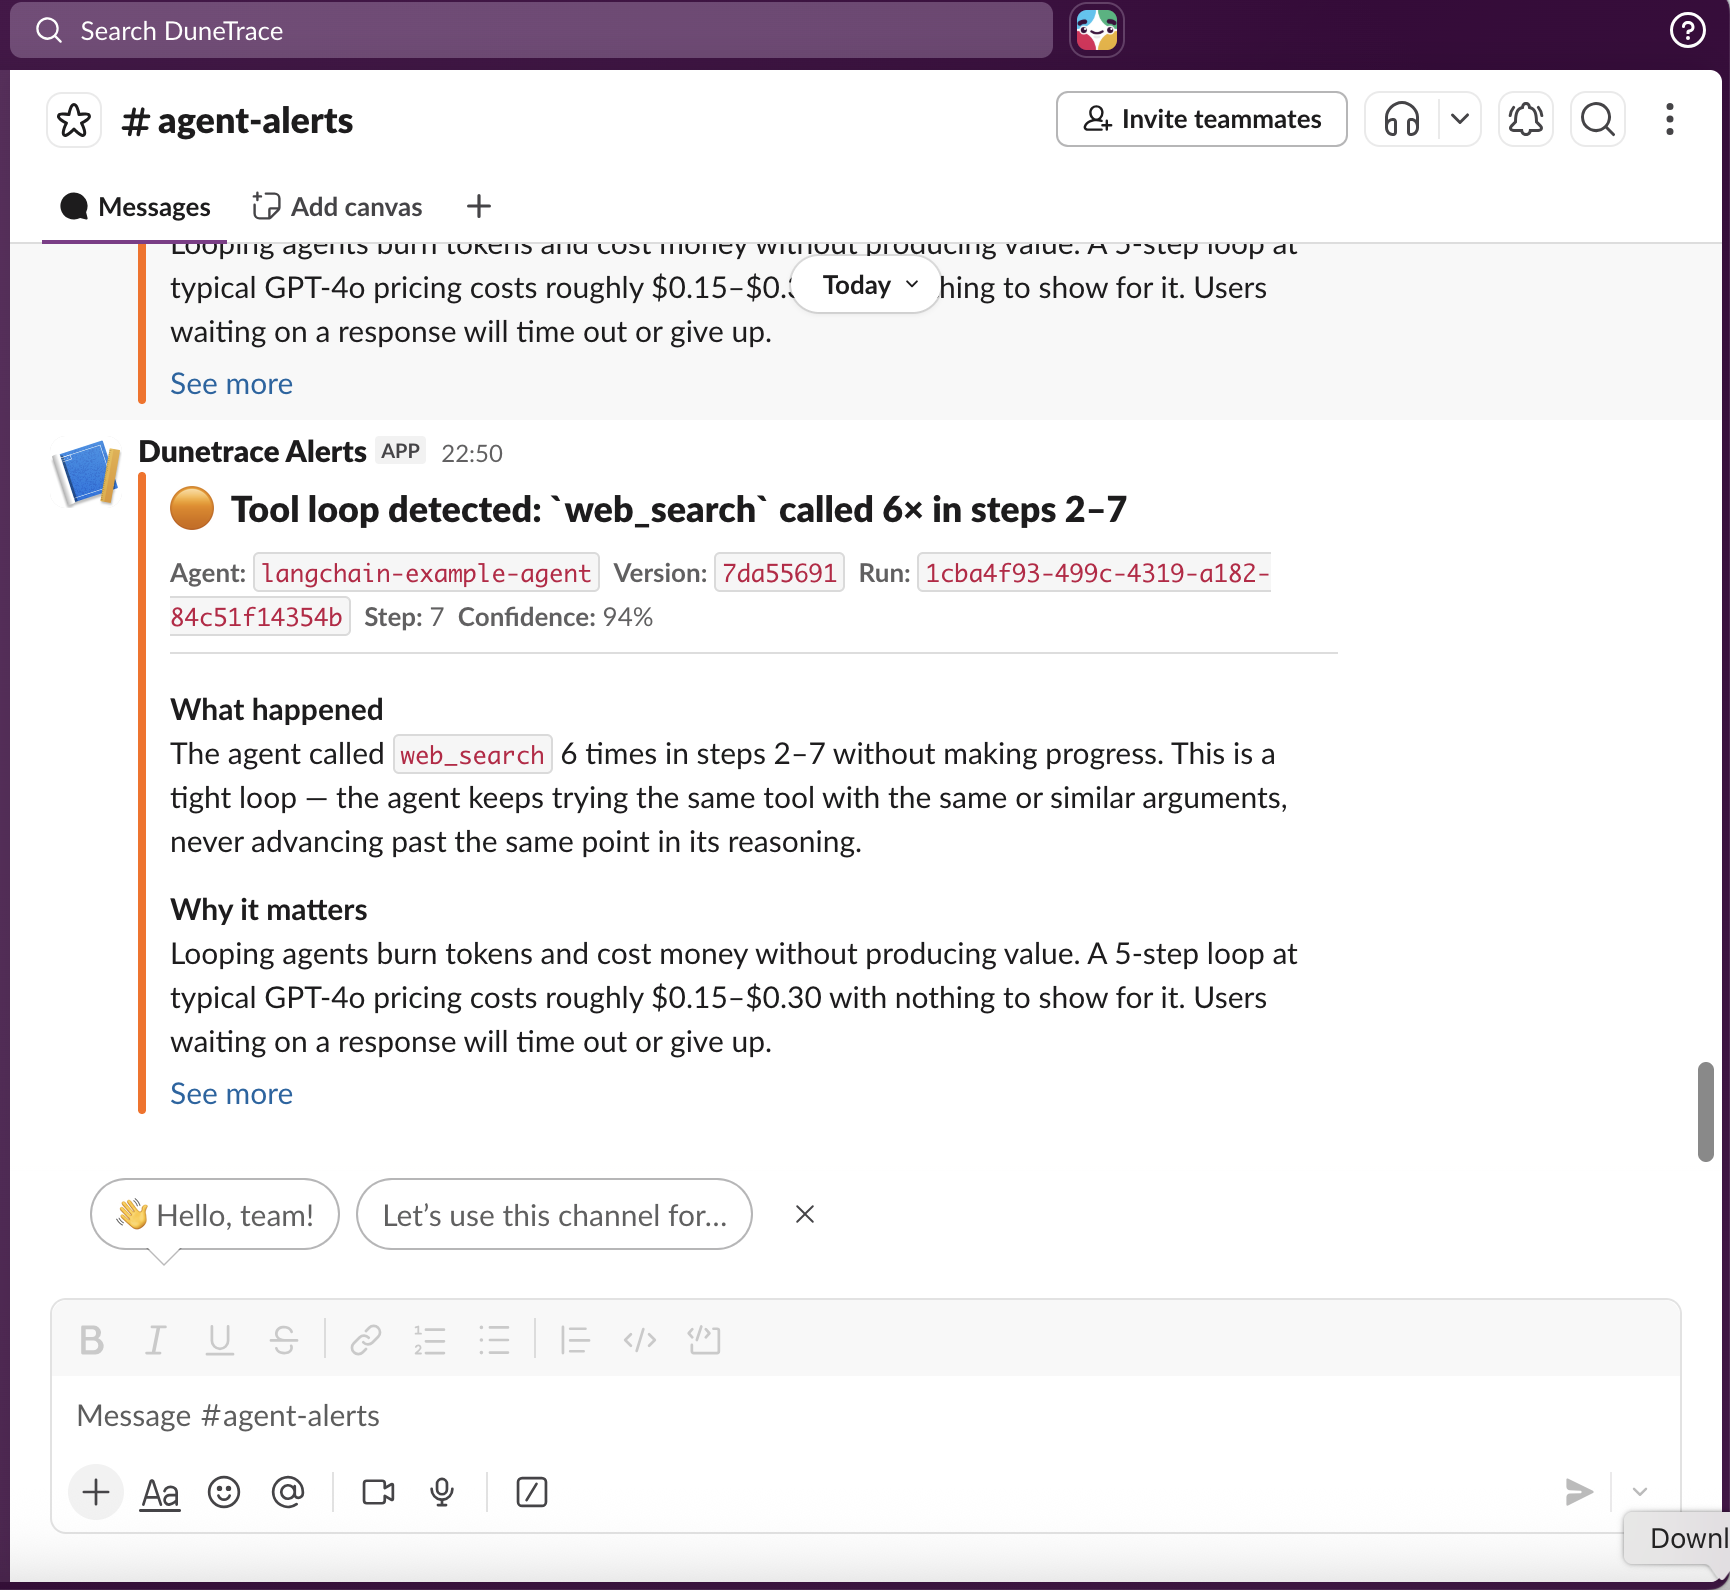
Langfuse and similar tools answer "what happened?" after you already know something broke.
Dunetrace answers a different question: is something breaking right now? and fires a Slack alert within 15 seconds of the run completing.
What it does
Monitor - watches every run as it completes: tool calls, LLM calls, latency, token usage, retrieval results.
Detect - 17 structural detectors run automatically. No LLM, no configuration. Catches tool loops, retry storms, context bloat, runaway cost, slow sessions, goal abandonment, and more.
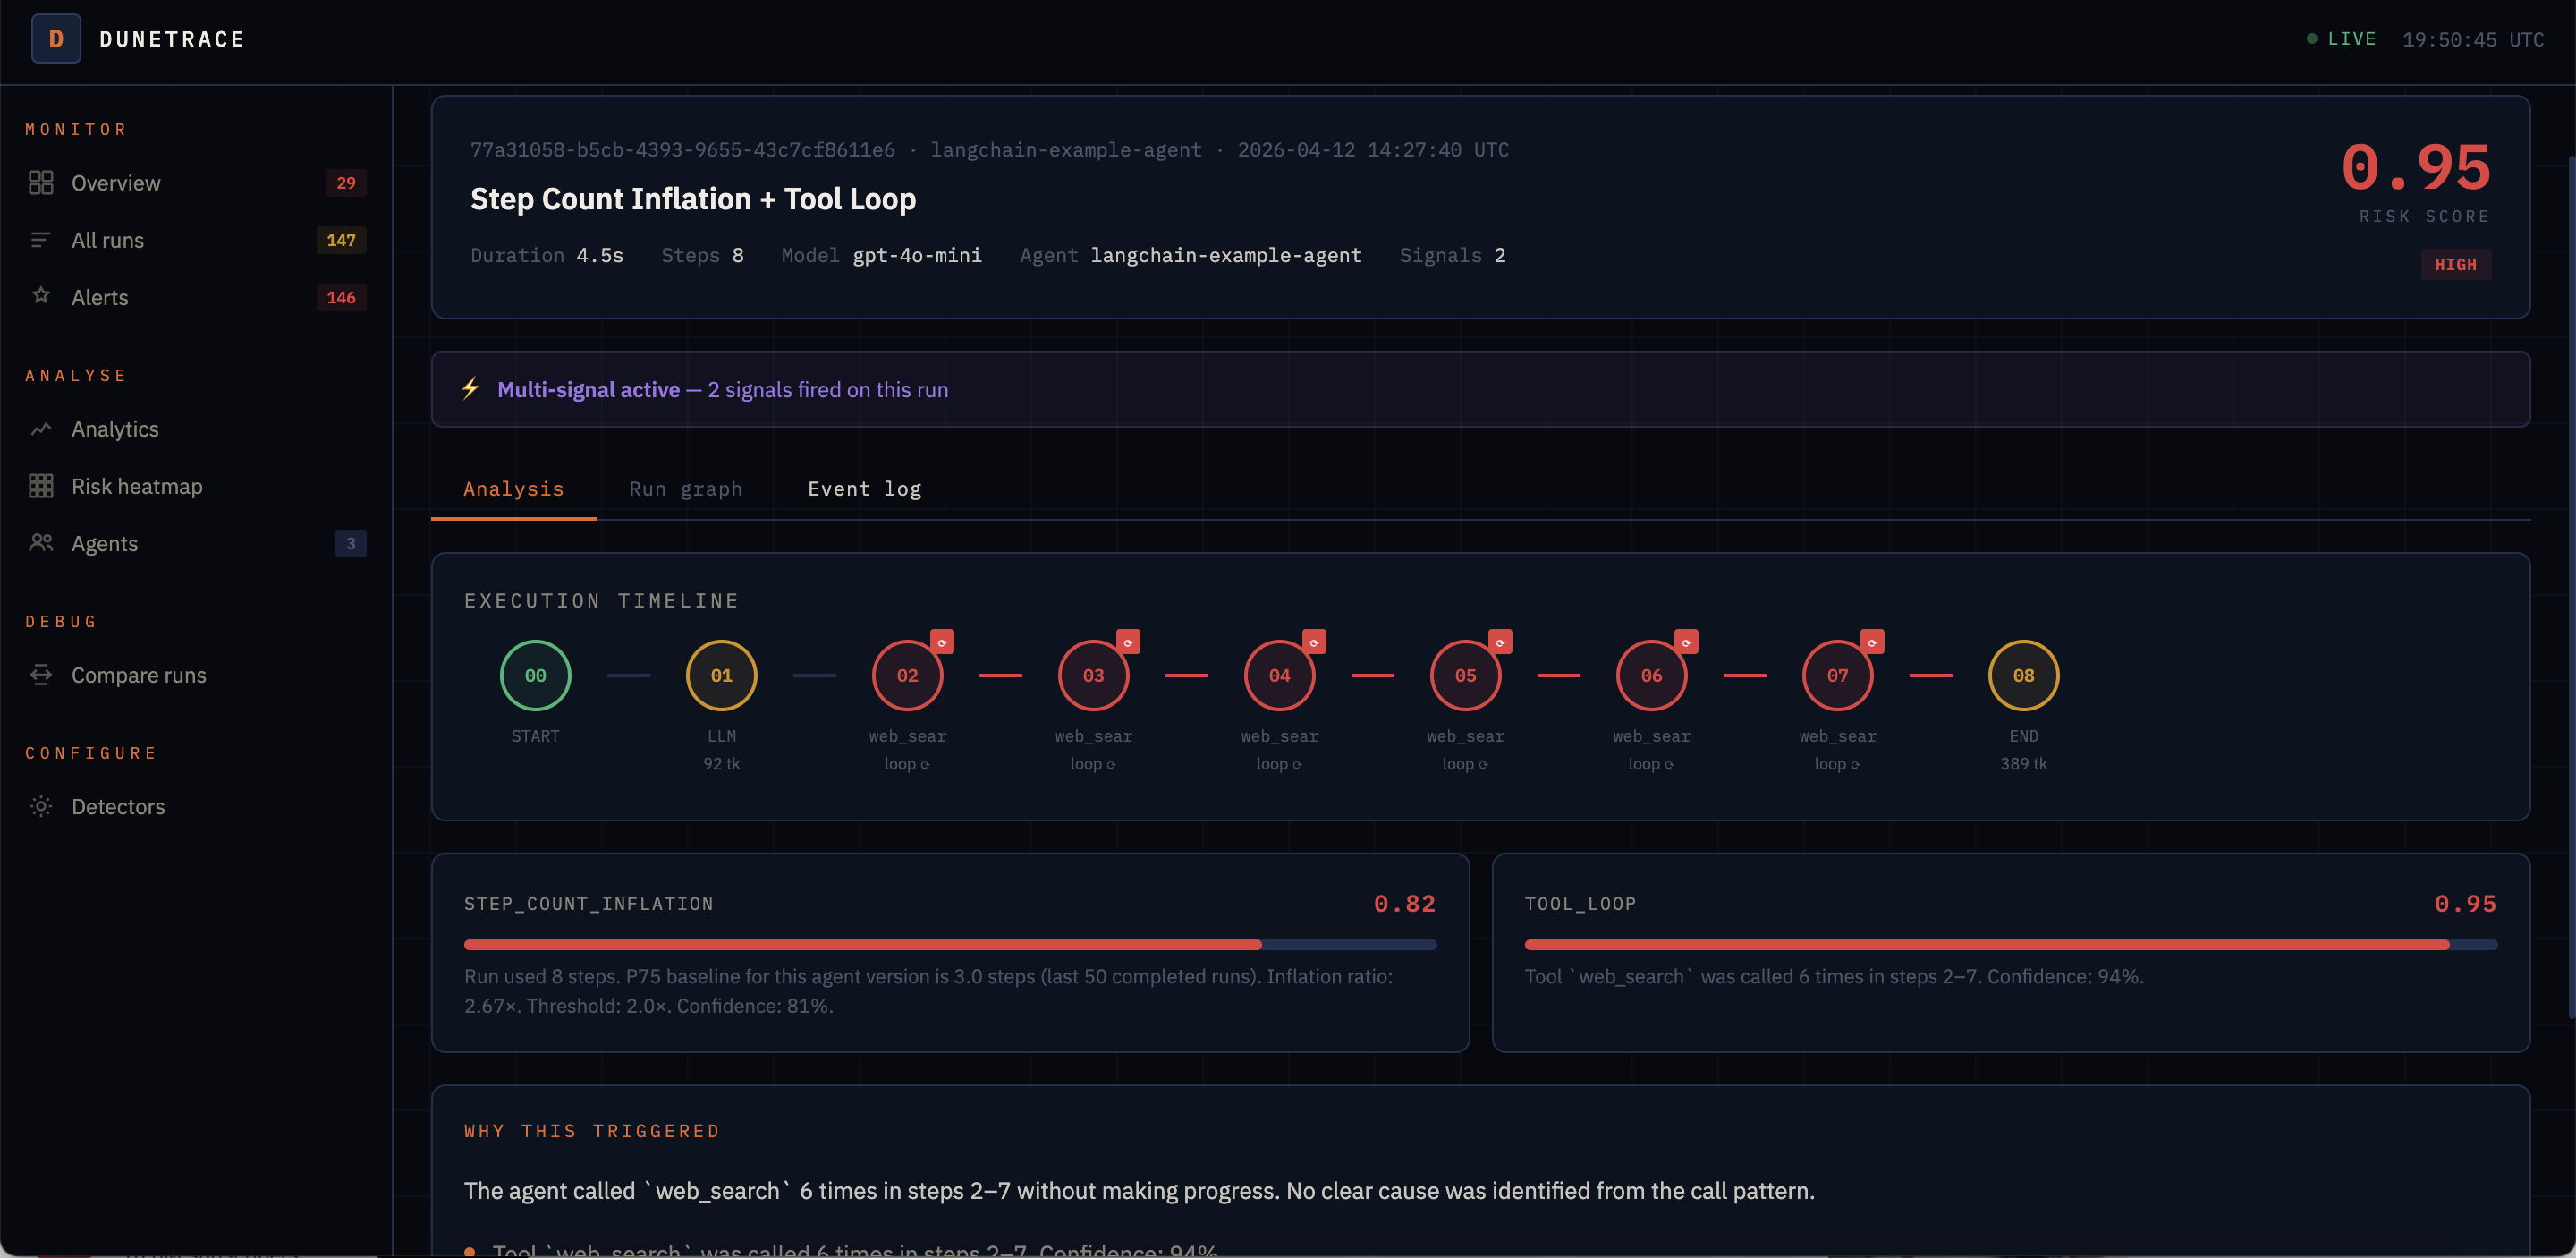
Diagnose - each alert includes a plain-English explanation: what happened, why it matters, and a concrete fix. If you use Langfuse, click Explain + to get an LLM root-cause analysis against the actual trace.
Fix - one click to apply a prompt fix via Langfuse, or open a GitHub PR with a code change. Fix effectiveness is tracked automatically.
Why it's different
| Dunetrace | Langfuse / LangSmith | |
|---|---|---|
| When it fires | Within 15s of run completion | You query it after you notice a problem |
| What it watches | Structural failure patterns | Raw trace data |
| Alert channel | Slack / webhook / Dashboard | Dashboard only |
| Fix path | One-click prompt apply or GitHub PR | Manual |
Dunetrace is not a replacement for tracing tools, it's the layer that tells you when to look.
Quick Start
1. Start the backend
git clone https://github.com/dunetrace/dunetrace
cd dunetrace && cp .env.example .env && docker compose build && docker compose up -d
2. Install the SDK
Python
pip install dunetrace
pip install 'dunetrace[langchain]'          # LangChain / LangGraph
pip install 'dunetrace[langchain,langfuse]' # + Langfuse deep analysis
pip install dunetrace-mcp                   # MCP server for Claude Code / Cursor
Node.js / TypeScript
npm install dunetrace # zero runtime dependencies, Node 18+
3. Instrument your agent
Python
from dunetrace import Dunetrace

dt = Dunetrace()

@dt.tool
def web_search(query: str) -> list: ...

@dt.trace
def my_agent(question: str) -> str:
    return web_search(question)[0]
TypeScript / Node.js
import { Dunetrace } from "dunetrace";

const dt = new Dunetrace();

await dt.run("my-agent", { model: "gpt-4o", tools: ["search"] }, async (run) => {
  run.llmCalled("gpt-4o", 150);
  // ... call your LLM ...
  run.llmResponded({ finishReason: "stop", completionTokens: 80 });
  run.toolCalled("search", { query });
  // ... call your tool ...
  run.toolResponded("search", true, 256, 120);
  run.finalAnswer();
});
Examples
To verify signals fire end-to-end, run the built-in failure scenarios:
cd packages/sdk-py

python examples/basic_agent.py                          # No LLM calls
SCENARIO=tool_loop python examples/langchain_agent.py   # TOOL_LOOP via LangChain
SCENARIO=failures python examples/decorator_agent.py    # TOOL_LOOP, RETRY_STORM, RAG_EMPTY_RETRIEVAL
SCENARIO=tool_loop python examples/langfuse_agent.py    # TOOL_LOOP + Langfuse explain
Open the dashboard: http://localhost:3000
| URL | |
|---|---|
| Dashboard | http://localhost:3000 |
| API + docs | http://localhost:8002/docs |
| Ingest (SDK) | http://localhost:8001 |
Detectors
17 detectors run on every completed run, no configuration required.
| Signal | What it catches |
|---|---|
TOOL_LOOP |
Same tool called repeatedly with identical args |
COST_SPIKE |
Total token consumption unusually high vs per-agent baseline |
SESSION_LATENCY |
Wall-clock run time anomalously long vs per-agent baseline |
CONTEXT_BLOAT |
Prompt tokens growing unsustainably across LLM calls |
RETRY_STORM |
Tool failing, agent retrying it repeatedly |
CASCADING_TOOL_FAILURE |
Multiple different tools failing in sequence |
STEP_COUNT_INFLATION |
Far more steps than the agent's baseline |
SLOW_STEP |
Single step latency well above threshold |
GOAL_ABANDONMENT |
Agent stopped using tools before finishing |
REASONING_STALL |
Too many LLM calls per tool call — agent deliberating in circles |
LLM_TRUNCATION_LOOP |
Model output truncated repeatedly |
CONTEXT_BLOAT |
Prompt token count growing unsustainably |
TOOL_THRASHING |
Oscillating between two tools, unable to commit |
TOOL_AVOIDANCE |
Agent answered without using any tools |
RAG_EMPTY_RETRIEVAL |
Retrieval returned nothing, agent answered anyway |
EMPTY_LLM_RESPONSE |
Model returned an empty response |
FIRST_STEP_FAILURE |
Failed on the first step — config or setup issue |
PROMPT_INJECTION_SIGNAL |
Input matched adversarial injection patterns |
Each alert includes: what fired, why it matters, a concrete fix, and a rate context line (first occurrence / recurring / systemic).
Dashboard
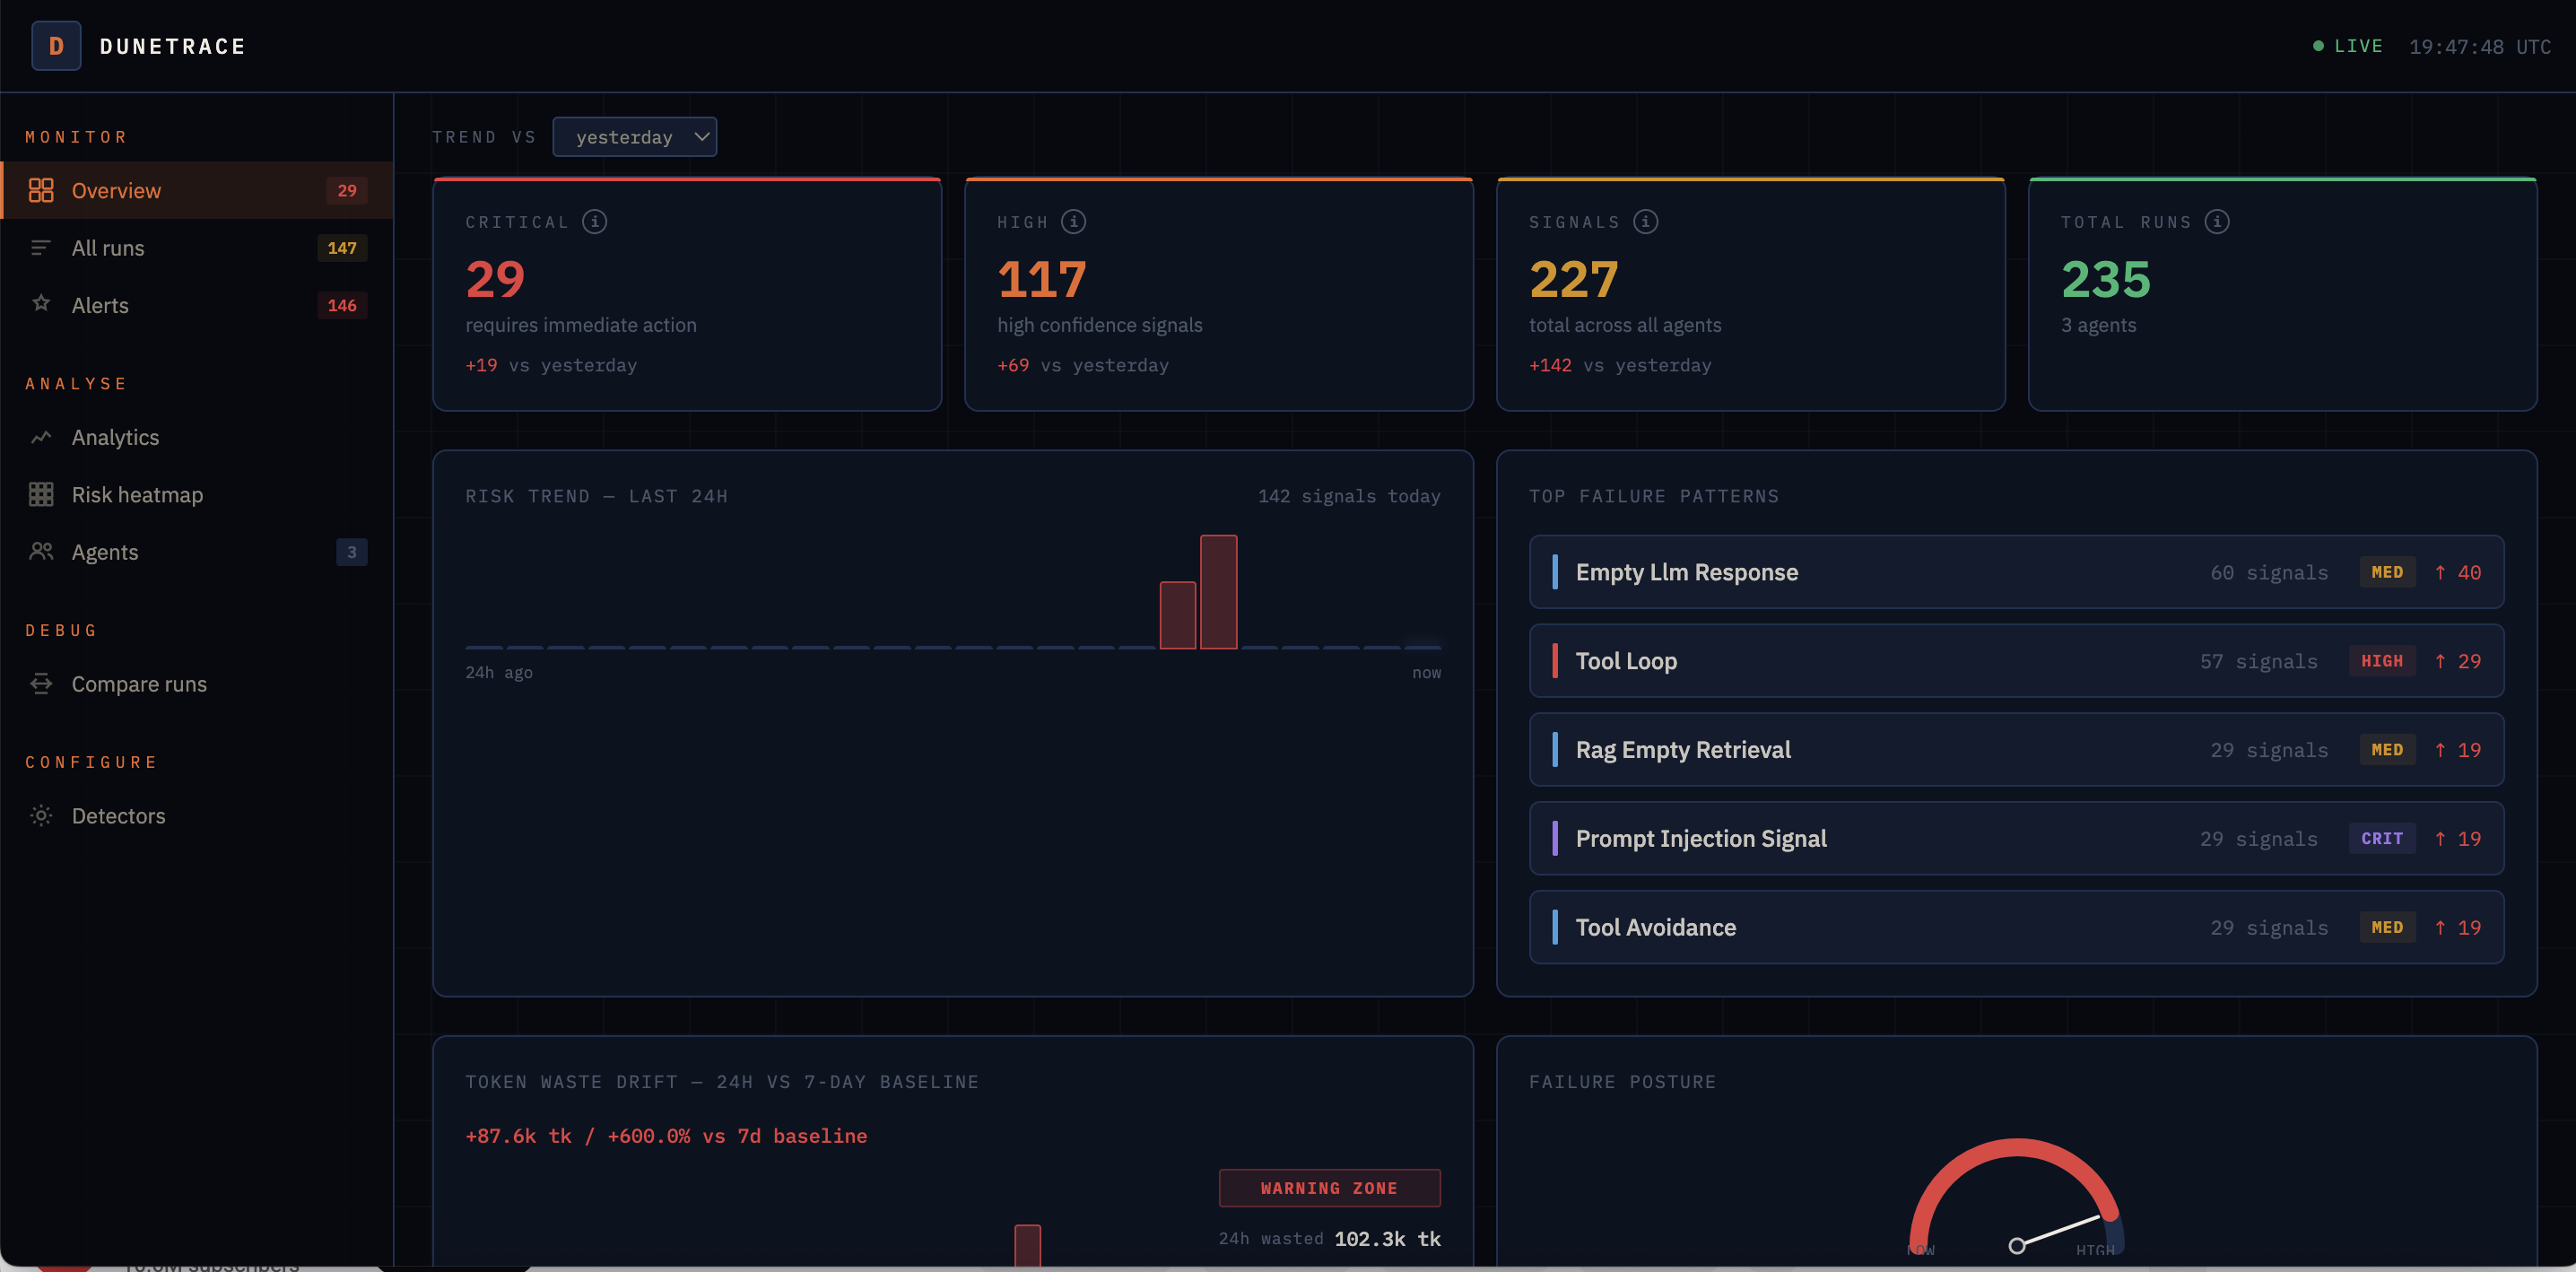
Live at http://localhost:3000. Auto-refreshes every 15s.
Alerts
Slack and generic webhook (PagerDuty, Linear, custom).
SLACK_WEBHOOK_URL=https://hooks.slack.com/services/...
SLACK_MIN_SEVERITY=LOW   # LOW | MEDIUM | HIGH | CRITICAL
A weekly digest (Monday 9am UTC) summarises top failure types, most-affected agents, and systemic patterns. Enable with DIGEST_ENABLED=true.
Diagnose with Langfuse
Connect Langfuse to get LLM-powered root-cause analysis on any signal.
Click Explain + on any alert in the dashboard. Dunetrace fetches the full trace, extracts the system prompt, and asks an LLM for the specific root cause and fix.
- Prompt fixes (tool loops, goal abandonment, etc.)
— Apply via Langfuse creates a new prompt version in one click. - Code/infra fixes (context bloat, slow steps, cost spikes, etc.)
— Open PR on GitHub creates a draft PR with a LLM-generated unified diff.
Fix effectiveness is tracked: the dashboard shows whether recurrence dropped after a fix was applied.
Policies
Runtime guardrails that fire mid-run — before a failure propagates.
dt.add_policy(
    name="cap tool calls",
    condition={"trigger": "tool_call_count", "operator": "gt", "value": 5},
    action={"type": "stop"},
)
dt.add_policy(
    name="cost cap",
    condition={"trigger": "cost_usd", "operator": "gt", "value": 0.50},
    action={"type": "switch_model", "params": {"model": "gpt-4o-mini"}},
)
Policies can also be created in the dashboard and are fetched automatically by the SDK (60s TTL).
→ docs/integrations.md#policies
Deploy markers
Correlate failure spikes with releases.
dt.mark_deploy("my-agent", version="v1.4.2", commit="abc1234", env="production")
The dashboard overlays blue dashed lines at each deploy boundary so you can immediately see whether a spike started before or after a release.
MCP server
Query agent signals directly from Claude Code, Cursor, or Codex — without leaving your editor.
pip install dunetrace-mcp
Ten tools that cover the full diagnostic workflow:
| Tool | What you can ask |
|---|---|
list_agents |
"Which agents are monitored and how healthy are they?" |
get_agent_signals |
"What failures did my agent have today?" |
get_agent_health |
"Show me the health score breakdown for my agent." |
get_signal_detail |
"Show me signal #42 with full evidence and fix code." |
get_agent_patterns |
"Is this failure systemic or a one-off?" |
get_run_detail |
"Walk me through run abc123 step by step." |
get_agent_runs |
"List recent runs for my agent with their status." |
search_signals |
"Show me all CRITICAL signals in the last 24 hours." |
summarize_agent |
"Give me a one-shot diagnosis of my agent." |
get_instrumentation_guide |
"How do I instrument my LangChain agent?" |
Claude Code — already registered in ~/.claude.json after pip install dunetrace-mcp. Restart Claude Code to load.
Cursor — add .cursor/mcp.json to your project root:
{
  "mcpServers": {
    "dunetrace": {
      "command": "dunetrace-mcp",
      "env": {
        "DUNETRACE_API_URL": "http://localhost:8002",
        "DUNETRACE_API_KEY": "dt_dev_test"
      }
    }
  }
}
Codex / SSE clients — python -c "from dunetrace_mcp.server import mcp; mcp.run(transport='sse')" (listens on :8000).
All MCP responses expose only hashed metadata — no raw prompts, arguments, or model outputs.
Privacy
No raw content ever leaves your agent process. Every prompt, tool argument, and model output is SHA-256 hashed before transmission.
Architecture
Agent Code
  └─► Dunetrace SDK        (hashes content → ingest events)
        └─► Ingest API      (POST /v1/ingest → Postgres)
                ├─► Detector       (poll → 17 detectors → signals)
                ├─► Alerts         (poll → explain → Slack / webhook)
                └─► Customer API   (runs, signals, explanations → dashboard)
Integrations
- Custom Python agent
- LangChain / LangGraph
- CrewAI
- AutoGen (Microsoft)
- TypeScript / JavaScript — npm package
- Langfuse, FastAPI, Flask, OpenTelemetry, Loki
- MCP server (Claude Code, Cursor, Codex)
Running tests
make test
Requirements
- Python 3.11+
- Node.js 18+ (TypeScript SDK)
- Docker + Docker Compose
Contributing
Fork, branch, change, test, PR. For larger changes (new detectors, architecture changes), open an issue first.
Star us ⭐
Contact
License
Yorumlar (0)
Yorum birakmak icin giris yap.
Yorum birakSonuc bulunamadi