tokenbill
Health Gecti
- License — License: MIT
- Description — Repository has a description
- Active repo — Last push 0 days ago
- Community trust — 11 GitHub stars
Code Basarisiz
- fs module — File system access in .github/workflows/ci.yml
- exec() — Shell command execution in scripts/render-svg.ts
- exec() — Shell command execution in scripts/sync-pricing.ts
- network request — Outbound network request in scripts/sync-pricing.ts
- exec() — Shell command execution in src/adapters/claude-code.ts
Permissions Gecti
- Permissions — No dangerous permissions requested
Bu listing icin henuz AI raporu yok.
Itemized cost breakdown for your Claude Code sessions. Reads local logs, no network, no config
tokenbill
Where did my AI budget go?
Claude Code sessions cost real money and you get zero visibility into why.tokenbill reads the session logs already on your disk and gives you the bill,
itemized. No network calls, no config, no account.
$ npx tokenbill

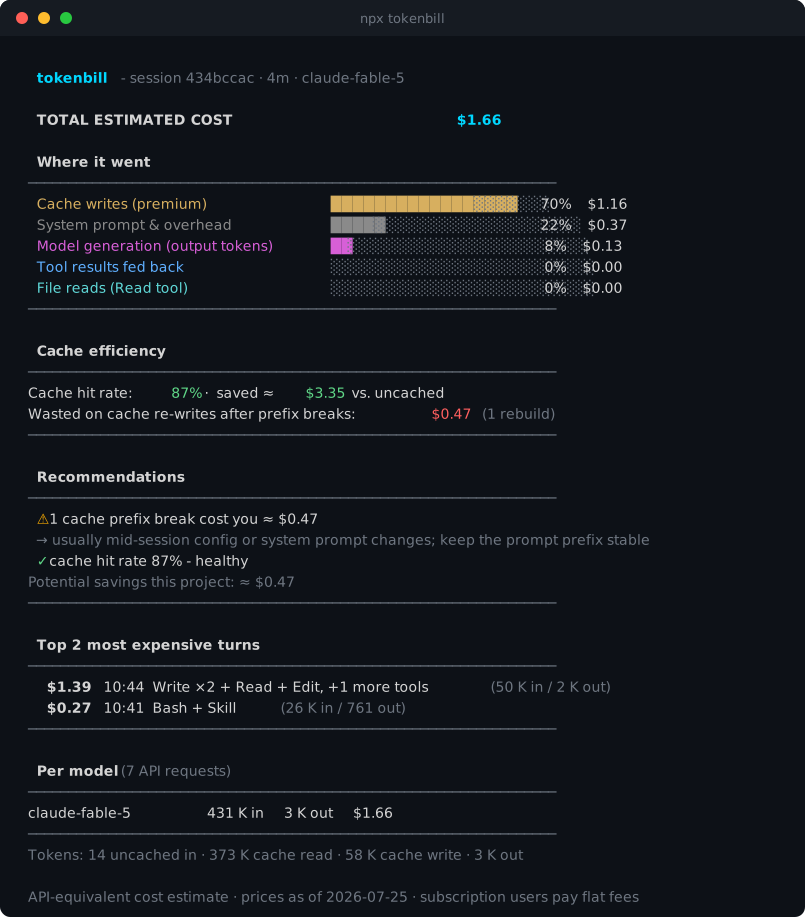
  tokenbill - session 1d6eedb6 · 29m · claude-fable-5

  TOTAL ESTIMATED COST                              $32.25

  Where it went
  ──────────────────────────────────────────────────────────────────
  System prompt & overhead           ████████████████░░░░░░░░  65%   $21.04
  Context compaction                 █████░░░░░░░░░░░░░░░░░░░  20%    $6.29
  Model generation (output tokens)   ██░░░░░░░░░░░░░░░░░░░░░░   9%    $3.04
  Cache writes (premium)             █░░░░░░░░░░░░░░░░░░░░░░░   5%    $1.66
  ──────────────────────────────────────────────────────────────────

  Cache efficiency
  ──────────────────────────────────────────────────────────────────
  Cache hit rate: 98%  ·  saved ≈ $191 vs. uncached
  Wasted on cache re-writes after prefix breaks: $3.14 (1 rebuild)
  ──────────────────────────────────────────────────────────────────

  Recommendations
  ──────────────────────────────────────────────────────────────────
  ⚠ 1 cache prefix break cost you ≈ $3.14
    → usually mid-session config or system prompt changes; keep the prompt prefix stable
  ✓ cache hit rate 98% - healthy
  Potential savings this project: ≈ $3.14
  ──────────────────────────────────────────────────────────────────
(Real output from a real session - yes, that half-hour cost $32 in API-equivalent terms, and $21 of it was re-reading the system prompt from cache on every request.)
Install & run
cd your-project && npx tokenbill   # every Claude Code session of this project, aggregated
npx tokenbill <project-dir>        # same, for any project (source dir or log dir both work)
npx tokenbill <session.jsonl>      # deep-dive report for one specific session
Run it from a project directory and you get the full bill for that project -
per-session totals, combined categories, and the most expensive moments across
all sessions. Run it anywhere else and it falls back to your most recent
session. Zero configuration either way.
Options:
--json            machine-readable output (schemaVersion 2)
--since <date>    include sessions starting on or after YYYY-MM-DD (UTC)
--html [file]     shareable single-file HTML report (default: tokenbill-report.html)
--md [file]       GitHub Markdown report to stdout or a .md file (PR comments, job summaries)
--top <n>         number of expensive turns to show (default 10)
--budget <usd>    exit 2 if the total exceeds this amount (for CI)
--pricing <file>  override the built-in price table with your own JSON
--redact          hide your prompt text (turns show tool activity instead)
--no-color        disable colored output (NO_COLOR env also respected)
Share card
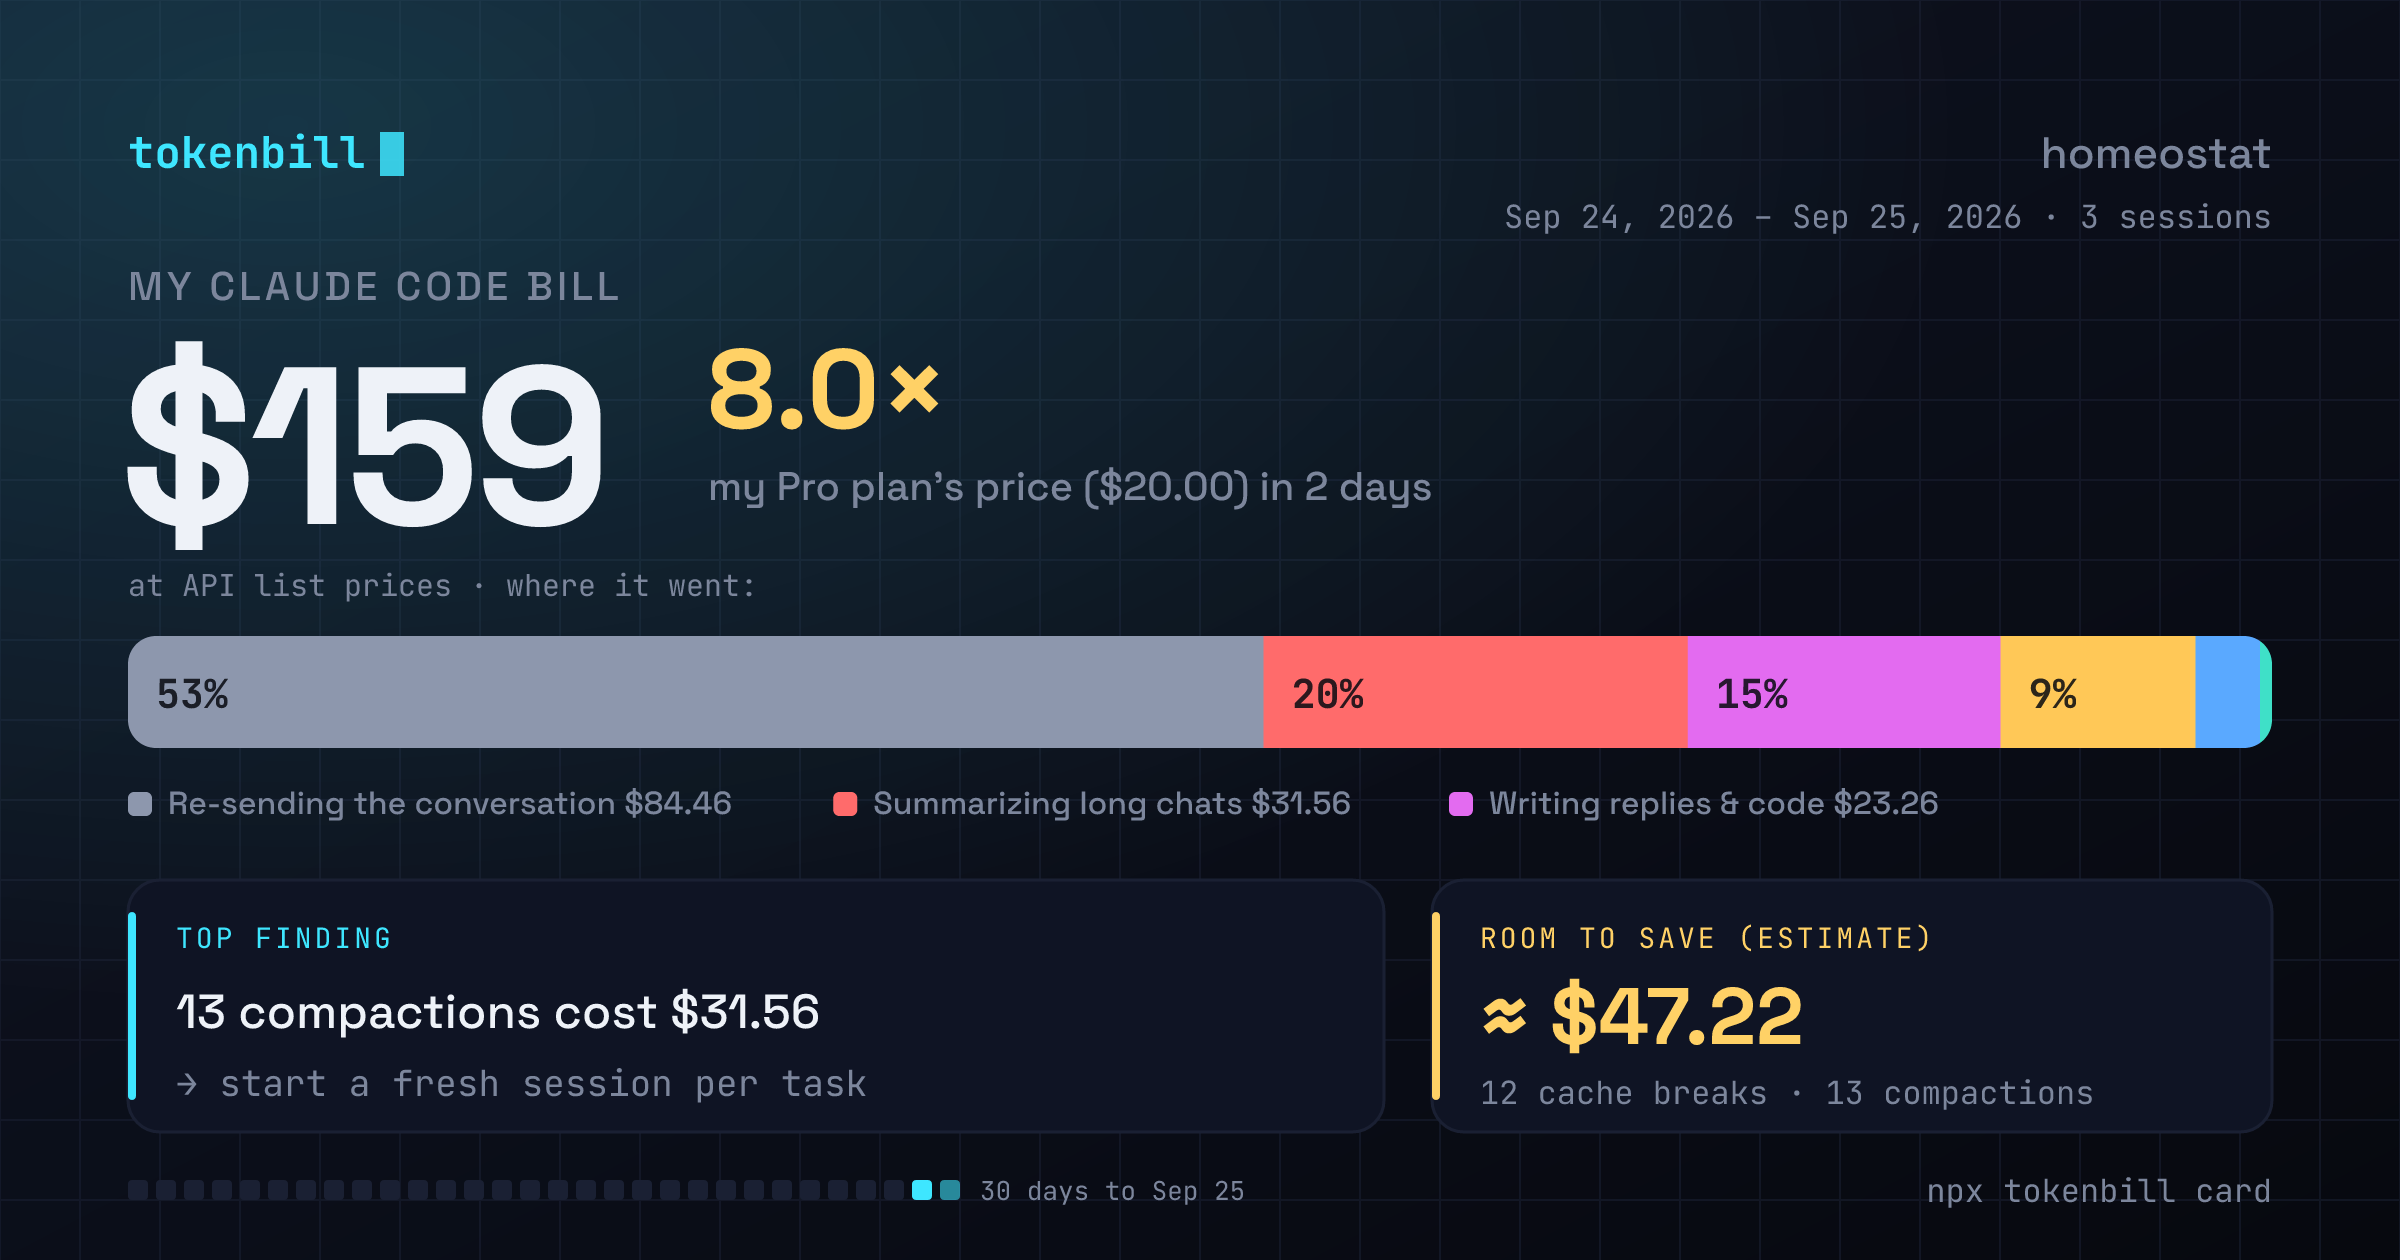
tokenbill card turns the same numbers into one image with the 1200×630
layout X, Reddit and LinkedIn use for link previews. The PNG is rendered at 2×
(2400×1260) so it stays sharp on high-density screens; the SVG is 1200×630.
npx tokenbill card                  # this project → tokenbill-card.png
npx tokenbill card --all            # every project
npx tokenbill card --plan max5      # adds "N× my plan's price" (last 30 days)
npx tokenbill card --out card.svg   # vector instead of PNG
The card shows the total, a single spectrum band of where every dollar went,
the prompt that cost the most in one turn, and the estimated savings the
report's recommendations point to (cache breaks, compactions, heavy file
reads). That figure is a heuristic estimate, not money proven lost: some
compactions are unavoidable on long tasks. It also prints a ready-to-paste
caption.
The card at the top of this page was made withtokenbill card --redact --plan max5 --since 2026-09-24 on a real project.
--plan takes pro, max5, max20 or a monthly dollar amount. Without--since the card covers the last 30 days and compares against one month's
fee; with --since the fee is prorated to that window. When your sessions
cover fewer days than the month, the card says so ("in 2 days").
The card quotes your priciest prompt. Add --redact to hide it: the card
then leads with its costliest finding and the one change that helps
("13 compactions cost $31.56 → start a fresh session per task"). Rendering happens locally with bundled open-source fonts
(Space Grotesk, JetBrains Mono); no browser is needed. If the PNG renderer
has no prebuilt binary for your platform, the card is written as SVG.
Live cost in your Claude Code status line
tokenbill statusline reads the JSON Claude Code pipes to status line commands
and prints one line: this session's cost, today's spend across the project,
cache hit rate, and a warning when a cache prefix break cost you money.
tokenbill $4.12 · today $18.30 · cache 97% · ⚠ 1 prefix break ($3.14)
Install it globally (npx would add its startup time to every refresh), then
point ~/.claude/settings.json at it:
npm i -g tokenbill
{ "statusLine": { "type": "command", "command": "tokenbill statusline" } }
It only parses session files modified today, writes nothing to disk, and never
fails loudly: on any error it prints tokenbill - and exits 0.
GitHub Action and budget guard
--budget still prints the full report, then exits 2 if you're over.
Exit codes: 0 ok, 1 error, 2 budget exceeded.
CI runners have no ~/.claude, so point tokenbill at logs you commit to the
repo or download as an artifact. The bundled action writes the Markdown report
to the job summary and applies the guard:
- uses: emrehangorgec/[email protected]
  with:
    path: .agent-logs          # a Claude Code log dir or a single .jsonl
    budget: 25                 # optional: fail the job above $25
Or call the CLI directly:
- run: npx tokenbill .agent-logs --md --redact >> "$GITHUB_STEP_SUMMARY"
- run: npx tokenbill .agent-logs --budget 25
Spend across all projects
npx tokenbill --all
npx tokenbill --all --html all-projects.html
npx tokenbill --all --json
npx tokenbill --all --budget 100
--all combines every session under ~/.claude/projects into one report:
total estimated cost, per-session totals, model breakdown, daily spend trend,
and the most expensive turns across projects. Subagent logs are included through
their parent session, so they are not counted again as separate sessions.
Markdown output and the budget guard work too. The budget applies to the entire
recorded history, not a monthly allowance. You cannot combine --all with a
session or project path.
What it tells you
Filter by session start date, including the specified day at midnight UTC:
npx tokenbill --since 2026-10-01
npx tokenbill --all --since 2026-10-01 --json
This includes each matching session in full, even if it spans multiple days.
Sessions without a recorded start time are excluded when filtering. If no
sessions match, the command exits with code 1 and an explanatory message.
- Total estimated cost - token usage from the logs × current per-token prices, deduplicated per API request, priced per model (mixed-model sessions work), cache reads at 0.1×, cache writes at their 5-minute (1.25×) or 1-hour (2×) premium, plus per-request server tool charges.
- Where it went - output generation vs. tool results vs. file reads vs. system overhead vs. cache-write premiums vs. context compaction vs. server tools, attributed by an incremental-delta heuristic. Categories always sum exactly to the total.
- Server tools - web searches billed per request ($10 per 1,000), counted alongside the token costs they generate. Web fetch has no per-request charge, so it shows its call count and contributes only the tokens the fetched content adds.
- Compaction events - when your context got summarized mid-session, what it cost, and how many tokens of history were dropped.
- Cache efficiency - hit rate, dollars saved vs. running uncached, and dollars wasted on mid-session cache rebuilds (the signature of a broken prompt prefix).
- Top expensive turns - the moments that actually burned the budget, labeled with the prompt you typed and what the agent did in response (
--redactkeeps only the latter). - Recommendations - actionable findings with dollar impact: cache prefix breaks, file-read-heavy sessions, expensive compactions, low hit rates, plus an honest "potential savings" estimate.
- Daily spend trend - a sparkline and per-day breakdown of the last 14 days (project reports), so you can see spend habits over time.
- Markdown report -
--mdrenders the same report as GitHub tables for PR comments and job summaries. - Shareable HTML report -
--htmlwrites the whole report as one self-contained dark-theme HTML file (no external requests, sortable turn table) you can open, screenshot, or send to your team.
Honest caveats
- The dollar figure is an API-equivalent estimate. If you're on a Claude subscription (Pro/Max), you pay a flat fee - this number tells you what your usage would cost at API rates, which is still the right signal for spotting waste.
- Category attribution is a documented heuristic, not exact accounting.
- Prices change. The table ships with an
asOfdate (printed in every report footer) and is refreshed withnpm run pricing:sync- see CONTRIBUTING.md. Rates have effective dates, so a session is priced at the rate it was actually billed at - including promotional windows like Sonnet 5's introductory $2/$10.--pricingstill overrides everything without waiting for a release. - A model with no published rate is flagged, not guessed at: it's priced at fallback Sonnet rates and the report marks it (
~unknown model, sonnet rates). - Fast mode (
usage.speed) is priced at its premium and the batch service tier at its discount. Priority tier is billed as standard - if you use it, the total is understated. - Server tool pricing assumes the standard published rates. Errored web searches aren't billed by the API and don't appear in the logs as charged requests, so they're not counted here either.
Privacy
tokenbill never makes a network call. It reads local files and prints text,
or writes the report or card file you asked for. Reports quote your prompts to
make expensive turns recognizable; that text stays on your machine unless you
share the output, and --redact removes it before you do. The test fixtures in this repo are anonymized (same-length placeholder text; structure, token counts and tool names preserved) via scripts/anonymize.ts.
That holds even for pricing: scripts/sync-pricing.ts is run manually to refresh the table, and its output is committed as source. The published package contains dist and the card fonts only, so there is no fetch path at runtime, no cache directory, and nothing to opt out of.
Supported agents
Claude Code today. The parser is an adapter interface (src/adapters/) - Codex/Cursor/Aider adapters are welcome contributions.
Development
npm install
npm test          # vitest: unit + golden-file snapshot tests
npm run build     # tsc → dist/
npm run dev       # tsx src/cli.ts
npm run demo      # regenerate assets/demo.svg from fixtures/basic.jsonl

npm run pricing:sync    # refresh the price table from upstream (the only network call)
npm run pricing:audit   # validate the shipped table offline
Type-checking is three projects, and CI runs all three - tsx and vitest both
transpile without checking, so the scripts and the test suite are only covered by
their own configs:
npx tsc --noEmit                          # src/ (the build project)
npx tsc --noEmit -p scripts/tsconfig.json # dev scripts
npx tsc --noEmit -p test/tsconfig.json    # test suite
See CONTRIBUTING.md before touching prices -src/cost/prices.generated.ts is generated, and hand-curated facts belong insrc/cost/pricing.overrides.json. CONTRIBUTING.md also covers
adapter contributions.
Licensed under the MIT License.
Yorumlar (0)
Yorum birakmak icin giris yap.
Yorum birakSonuc bulunamadi