clawtrace
Health Uyari
- No license — Repository has no license file
- Description — Repository has a description
- Active repo — Last push 0 days ago
- Community trust — 11 GitHub stars
Code Uyari
- process.env — Environment variable access in packages/clawtrace-ui/drizzle.config.ts
Permissions Gecti
- Permissions — No dangerous permissions requested
This agent acts as an observability and debugging plugin for OpenClaw agents. It records your agent runs as a tree of spans so you can visually inspect token usage, execution timelines, and tool calls to optimize performance and reduce costs.
Security Assessment
Overall risk: Low. The tool does not request any inherently dangerous permissions or execute arbitrary shell commands. It reads standard environment variables (specifically found in the UI's database configuration file), which is a normal and expected practice for an application to connect to its local storage. There are no hardcoded secrets in the codebase, meaning your sensitive credentials remain safe provided you manage your `.env` files properly. The dashboard does require network requests to display data locally or via their web interface.
Quality Assessment
The project is actively maintained, with its most recent code push occurring today. It has a small but present user base, indicated by 11 GitHub stars. There is a minor administrative discrepancy: the README displays an Apache 2.0 badge, but the automated scan detected that the actual license file is missing from the repository root. This is a common oversight in newer projects but is something the maintainers should fix. Otherwise, the repository includes a description, clear documentation, and structured code.
Verdict
Safe to use, though you should be aware of the technically unlicensed code state until the maintainers add the official file.
Make your OpenClaw agents better, cheaper, and faster.
![]()
clawtrace.ai · Docs · Ask Tracy
My OpenClaw agent burned ~40× its normal token budget in under an hour.
Root cause: it was appending ~1,500 messages of history to every LLM call. By the time I noticed, it had already spent a few dollars on what should have been a 3-cent task.
I couldn't see it from logs. OpenClaw logs flatten everything into a wall of JSON. The loop was invisible.
Built after that incident.
ClawTrace records every agent run as a tree of spans and lets you inspect it.
openclaw plugins install @epsilla/clawtrace
openclaw clawtrace setup
openclaw gateway restart
Then open clawtrace.ai. Your next run appears automatically.
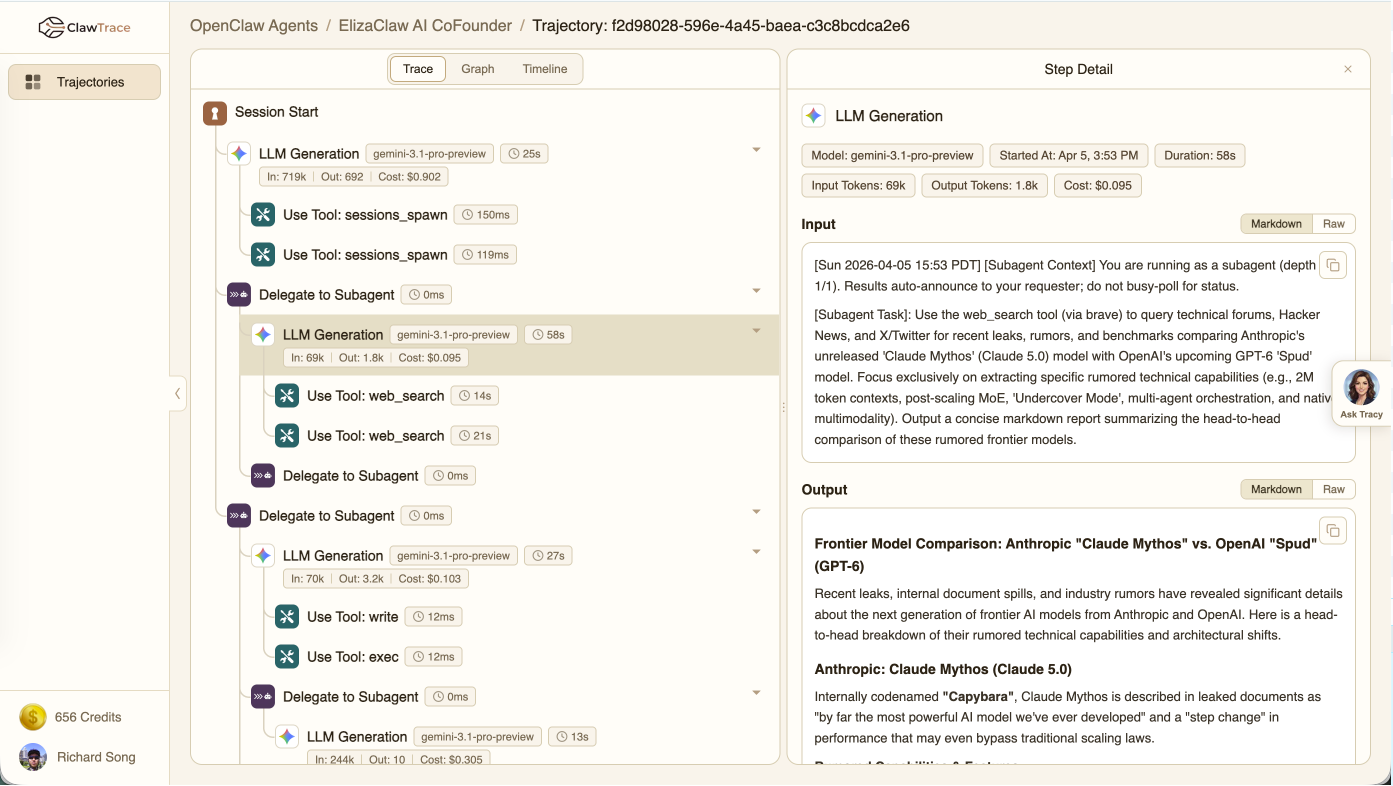
What it shows
- Token usage per step — see exactly which LLM call ate your budget
- Tool calls and retries — spot loops before they compound
- Execution timeline — Gantt chart of every span, parallel and sequential
- Full input/output — click any step to see what went in and what came back
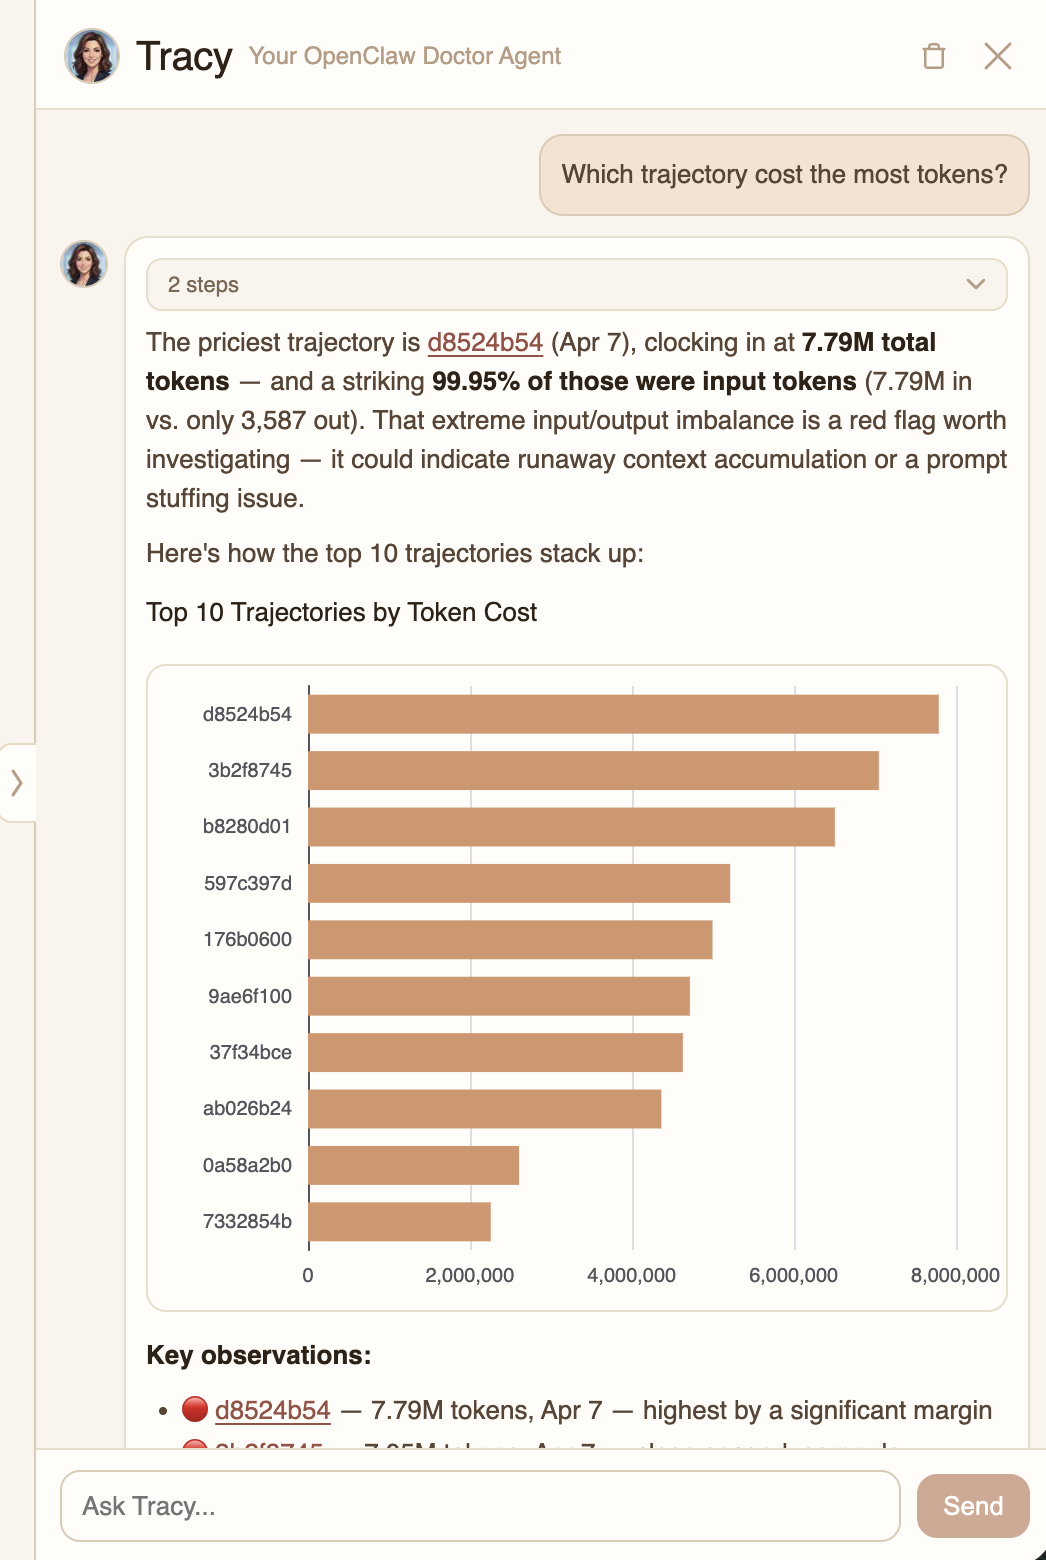
Ask Tracy
You can also ask questions in plain English. Tracy is an AI analyst wired directly to your trajectory graph. She runs live Cypher queries against your data, generates charts, and tells you specifically what to fix.
"Why did my last run cost so much?"
"Which tool is failing most often?"
"Is my context window growing across sessions?"
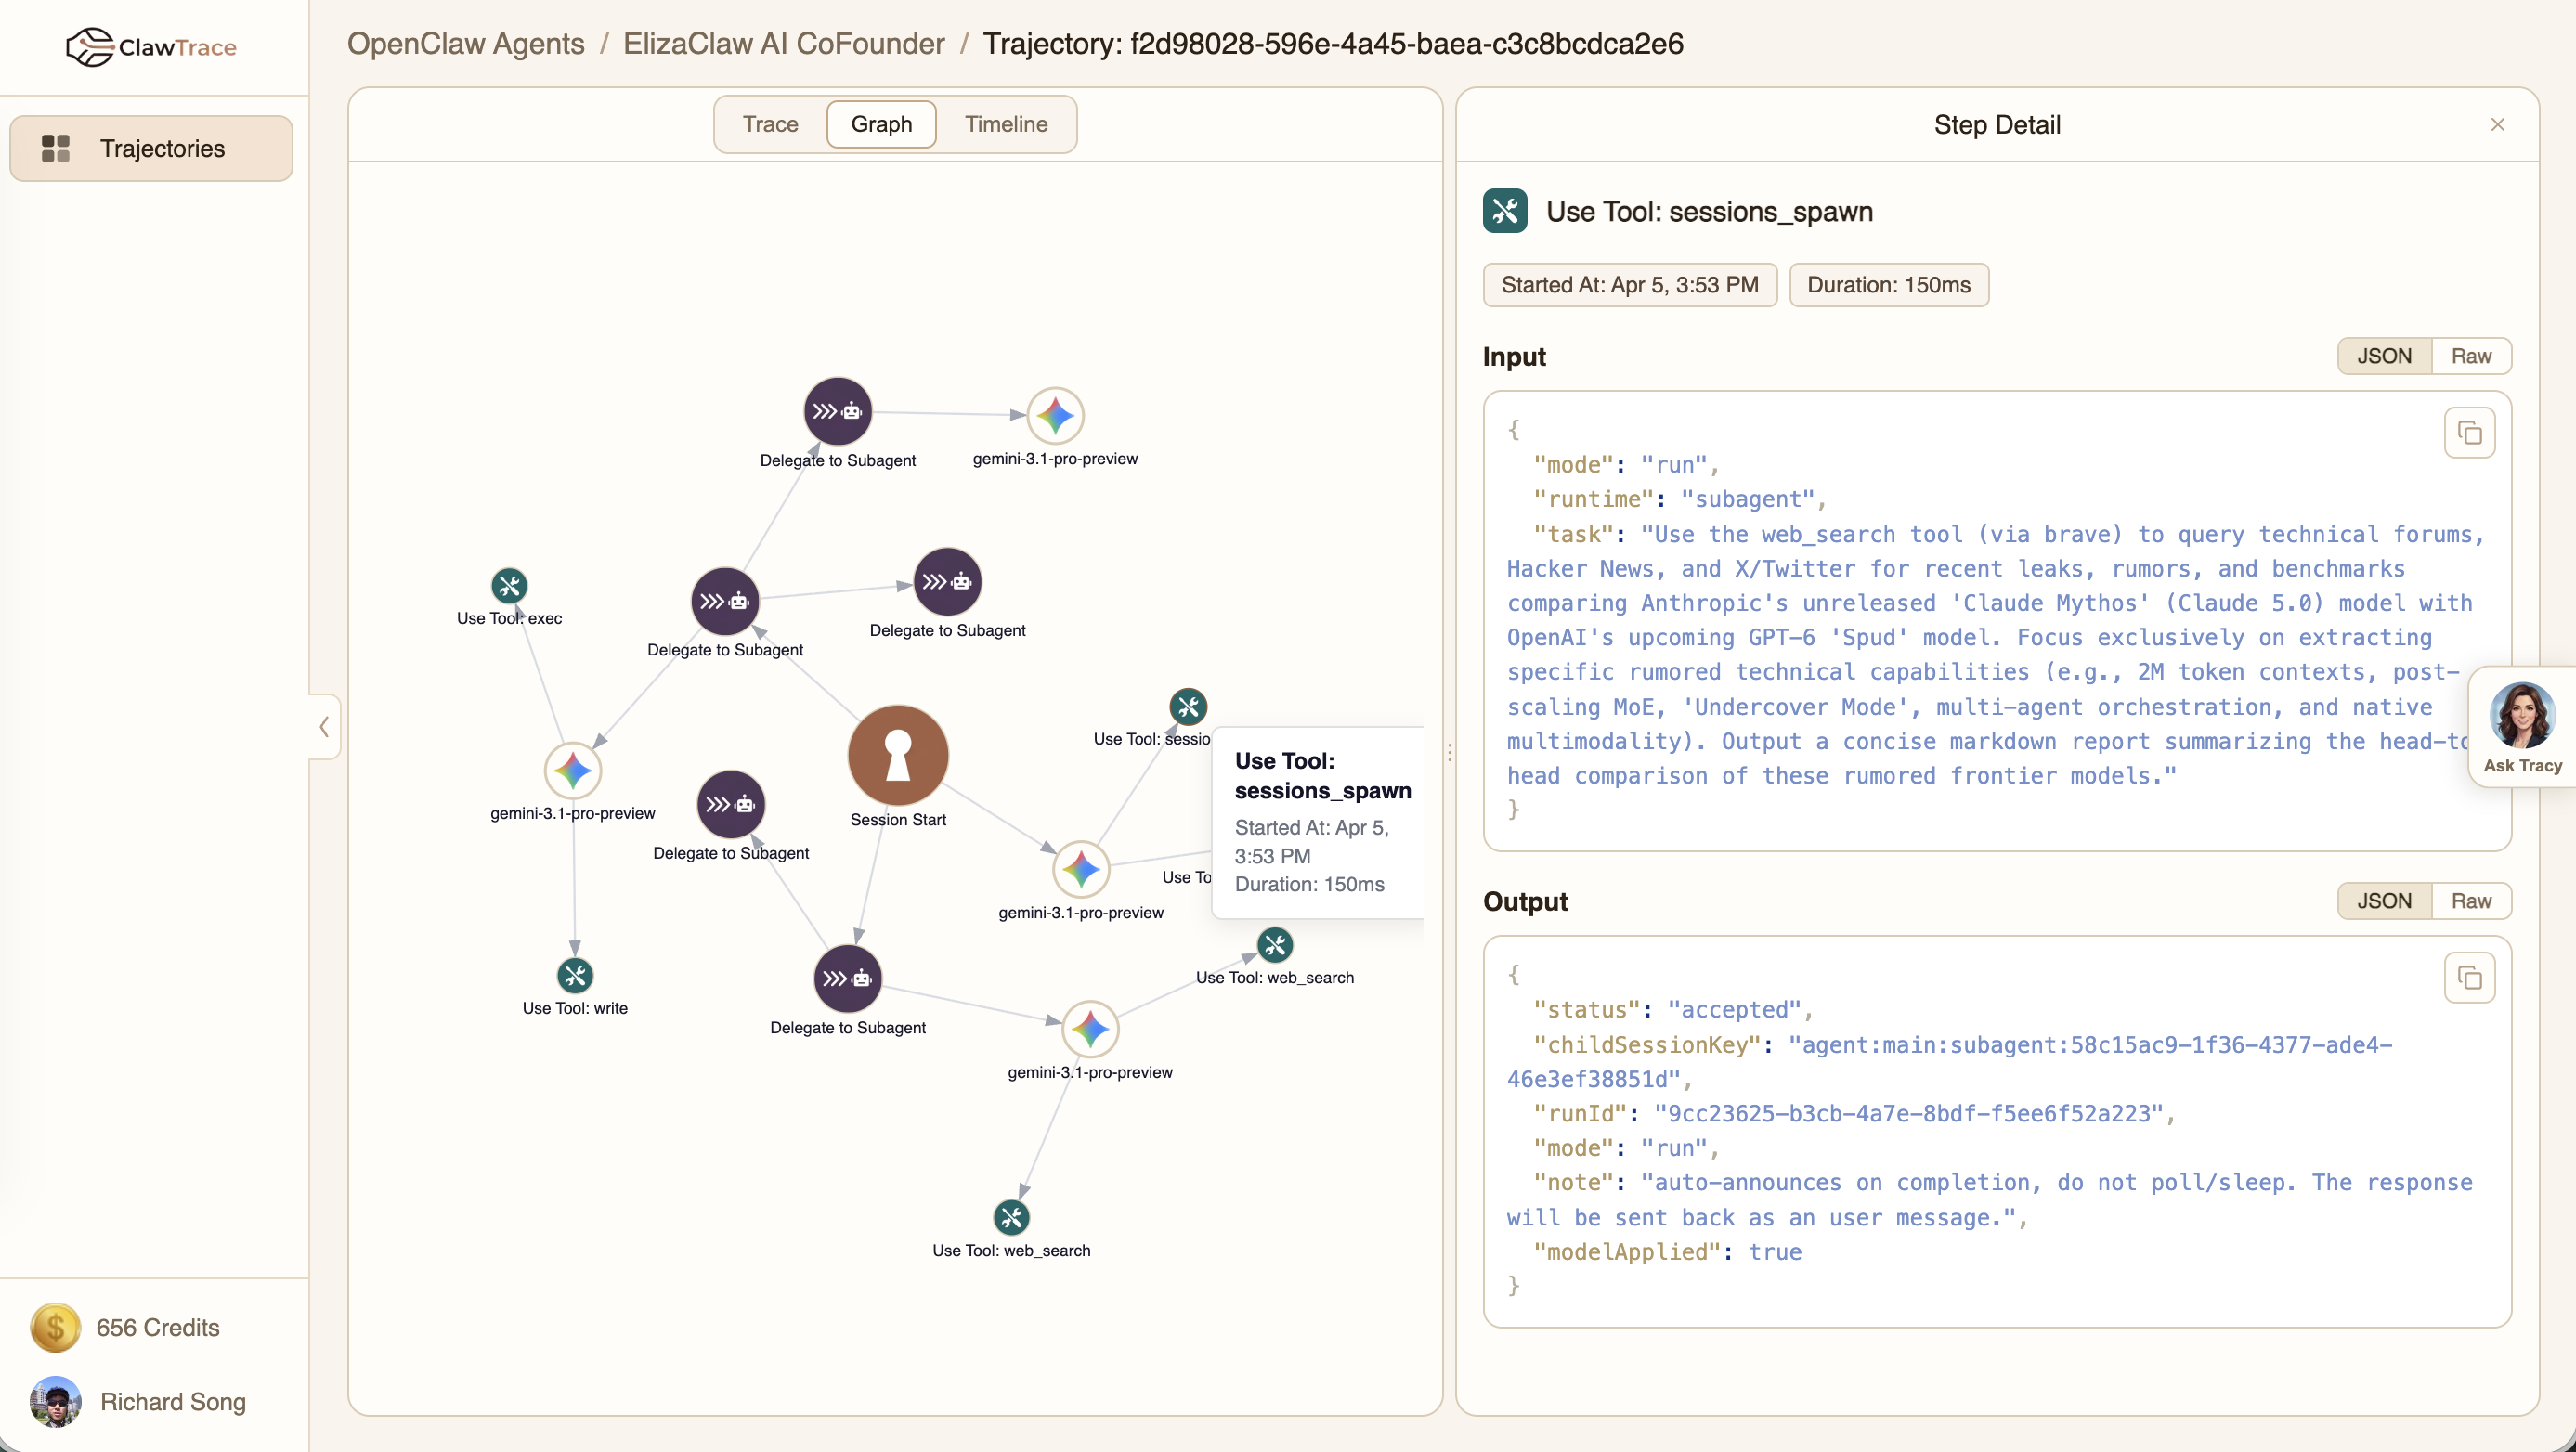
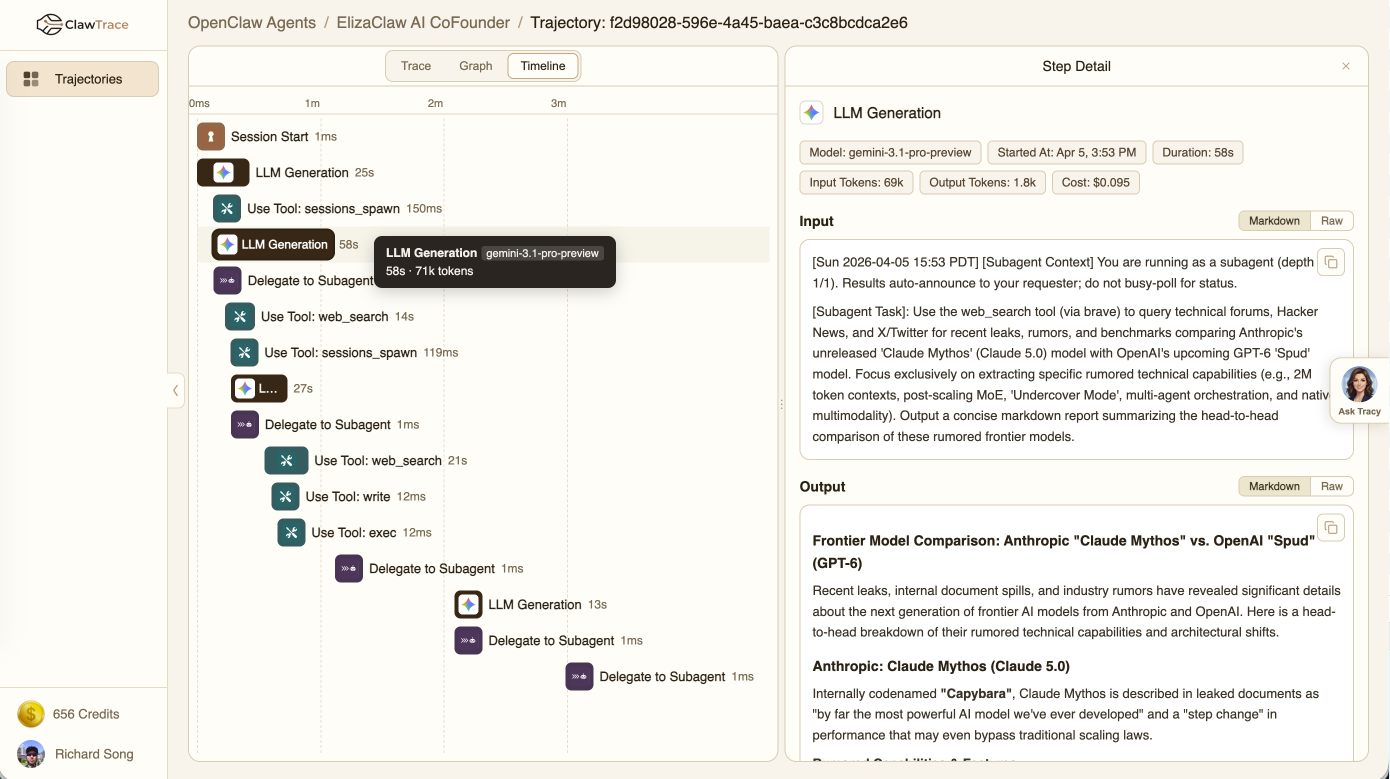
Three views per trace
Every trajectory has three views — click any node/span/bar to open step detail with full payloads, token counts, duration, cost, and errors.
Execution path — collapsible tree, parent-child relationships, per-node cost badges
Call graph — force-directed diagram of every agent, model, and tool in the run
Timeline — Gantt chart showing where time actually went
Getting started
1. Install the plugin on your OpenClaw agent
openclaw plugins install @epsilla/clawtrace
2. Authenticate
openclaw clawtrace setup
Paste your observe key from clawtrace.ai when prompted. 200 free credits, no credit card.
3. Restart the gateway
openclaw gateway restart
Done. Every run now streams to ClawTrace automatically.
Self-evolving agents
The plugin also exposes a /v1/evolve/ask endpoint so your agent can query Tracy about its own trajectories. Install the ClawTrace Self-Evolve skill and your agent will periodically check its own cost and failure patterns, apply fixes, and log what it changed.
openclaw skills install clawtrace-self-evolve
Architecture
graph TB
    subgraph Agent Runtime
        OC[OpenClaw Agent]
        PLG["@epsilla/clawtrace plugin<br/>8 hook types"]
    end

    subgraph Ingest Layer
        ING[Ingest Service<br/>FastAPI + Cloud Storage]
    end

    subgraph Data Lake
        RAW[Raw JSON Events<br/>Azure Blob / GCS / S3]
        DBX[Databricks Lakeflow<br/>SQL Pipeline]
        ICE[Iceberg Silver Tables<br/>events_all, pg_traces,<br/>pg_spans, pg_agents]
    end

    subgraph Graph Layer
        PG[PuppyGraph<br/>Cypher over Delta Lake]
    end

    subgraph Backend Services
        API[Backend API<br/>FastAPI + asyncpg]
        PAY[Payment Service<br/>Credits + Stripe]
        MCP[Tracy MCP Server<br/>Cypher queries]
    end

    subgraph AI Layer
        TRACY[Tracy Agent<br/>Anthropic Managed Harness<br/>Claude Sonnet 4.6]
    end

    subgraph Frontend
        UI[ClawTrace UI<br/>Next.js 15 + React 19]
        DOCS[Documentation<br/>Server-rendered Markdown]
    end

    subgraph External
        NEON[(Neon PostgreSQL<br/>Users, API Keys,<br/>Credits, Sessions)]
        STRIPE[Stripe<br/>Payments]
    end

    OC --> PLG
    PLG -->|"POST /v1/traces/events"| ING
    ING --> RAW
    RAW --> DBX
    DBX --> ICE
    ICE --> PG

    PG -->|Cypher| API
    PG -->|Cypher| MCP

    API --> NEON
    PAY --> NEON
    PAY --> STRIPE

    MCP -->|tool results| TRACY
    TRACY -->|SSE stream| API

    UI -->|REST API| API
    UI -->|SSE| API
    API -->|deficit check| PAY
Data flow
- Capture — The plugin intercepts 8 OpenClaw hook types:
session_start,session_end,llm_input,llm_output,before_tool_call,after_tool_call,subagent_spawning,subagent_ended - Ingest — Events are batched and POSTed to the ingest service, which writes partitioned JSON to cloud storage (
tenant={id}/agent={id}/dt=YYYY-MM-DD/hr=HH/) - Transform — Databricks Lakeflow SQL pipeline materializes raw events into 8 Iceberg silver tables every 3 minutes
- Query — PuppyGraph virtualizes the Delta Lake tables as a Cypher-queryable graph (Tenant → Agent → Trace → Span with CHILD_OF edges)
- Serve — Backend API runs Cypher queries; Tracy's MCP server gives the AI analyst direct graph access
- Display — Next.js UI renders trace trees, call graphs, timelines, and Tracy's streamed responses with inline ECharts
Graph schema
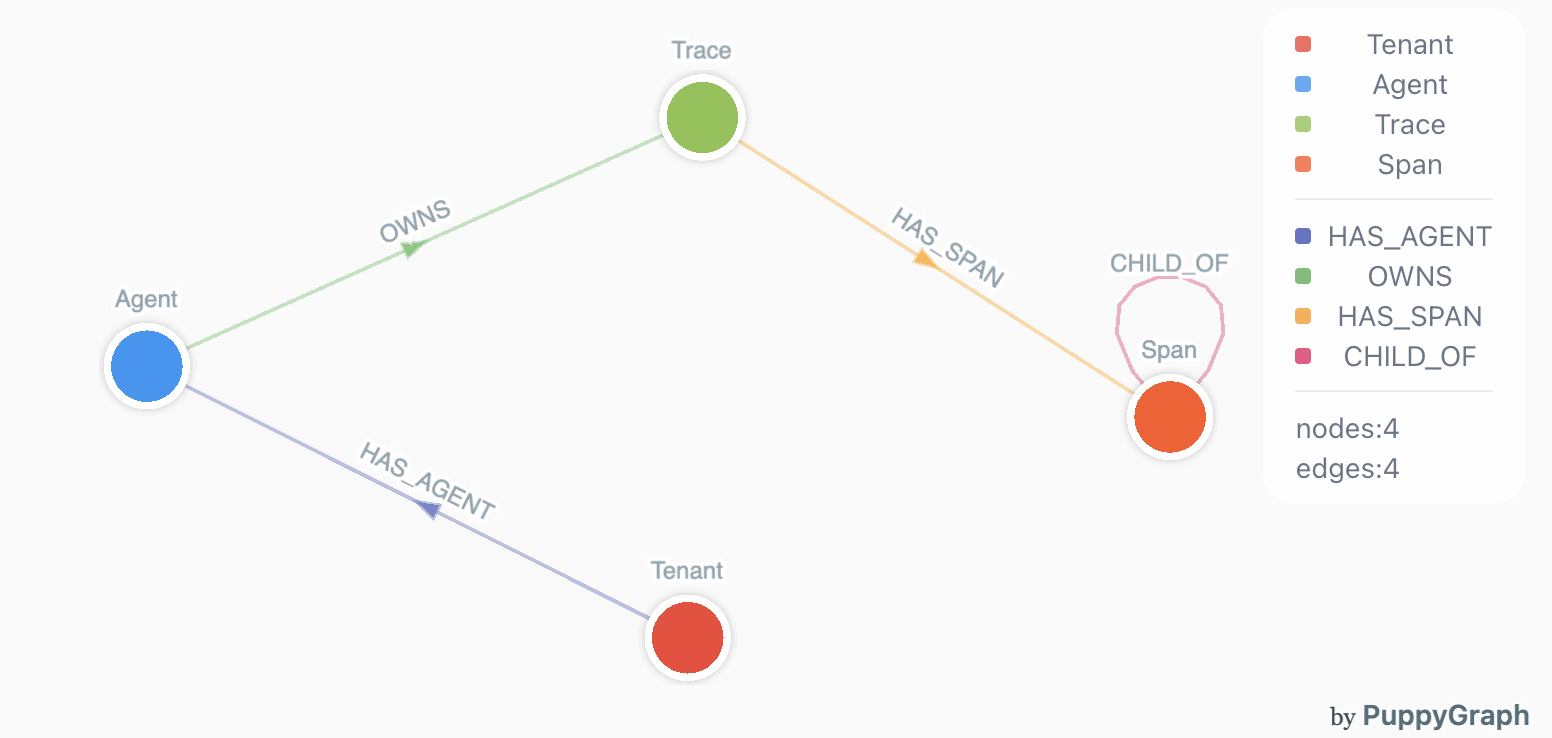
4 vertex types (Tenant, Agent, Trace, Span), 4 edge types (HAS_AGENT, OWNS, HAS_SPAN, CHILD_OF). Agent execution data is naturally a graph; ClawTrace models it that way so Tracy can traverse it with Cypher instead of joining flat tables.
Monorepo structure
clawtrace/
├── packages/clawtrace-ui/        Next.js 15 frontend (App Router, React 19, Drizzle ORM)
├── services/clawtrace-backend/   FastAPI backend (PuppyGraph, JWT auth, Tracy chat)
├── services/clawtrace-ingest/    FastAPI ingest (multi-tenant, cloud-agnostic storage)
├── services/clawtrace-payment/   FastAPI billing (consumption credits, Stripe, notifications)
├── plugins/clawtrace/            @epsilla/clawtrace npm plugin for OpenClaw
├── sql/databricks/               Lakeflow SQL pipeline (silver tables + billing tables)
└── puppygraph/                   PuppyGraph schema configuration
Tech stack
| Layer | Technology |
|---|---|
| Frontend | Next.js 15, React 19, CSS Modules, ECharts, react-markdown |
| Backend | FastAPI, asyncpg, httpx, Pydantic Settings |
| Database | Neon PostgreSQL (users, credits, sessions), Drizzle ORM |
| Data Lake | Azure Blob Storage, Databricks, Delta Lake, Iceberg |
| Graph | PuppyGraph (Cypher over Delta Lake) |
| AI | Anthropic Managed Agents (Claude Sonnet 4.6), MCP protocol |
| Billing | Stripe, consumption-based credits |
| Deployment | Vercel (UI), Docker + Kubernetes (services) |
Model pricing
Cost estimates cover 80+ models with cache-aware pricing (fresh input, cached input, cache write, output calculated separately):
Western: OpenAI (GPT-5.x, GPT-4.x, o-series), Anthropic (Claude Opus/Sonnet/Haiku), Google (Gemini 3.x/2.x/1.5), DeepSeek (V3, R1), Mistral
Chinese: Alibaba Qwen (3.x Max/Plus/Flash), Zhipu GLM, Moonshot Kimi, Baidu ERNIE, MiniMax
Open source: Llama 4/3.x, Mixtral, Stepfun
Roadmap
- Rubric-based evaluation — define quality rubrics, auto-score trajectories, catch regressions before deployment
- A/B testing — run agent variants side by side, compare cost/quality/speed, promote winners
- Version control — track agent config changes, roll back, audit
- Self-evolving agents — agents that learn from their own trajectory data to cut costs and fix failure patterns automatically
Development
Frontend
cd packages/clawtrace-ui
npm install
npm run dev          # localhost:3000
npm run typecheck
Backend
cd services/clawtrace-backend
python -m venv .venv && source .venv/bin/activate
pip install -r requirements.txt
cp .env.example .env
uvicorn app.main:app --reload --port 8082
Ingest
cd services/clawtrace-ingest
python -m venv .venv && source .venv/bin/activate
pip install -r requirements.txt
cp .env.example .env
uvicorn app.main:app --reload --port 8080
Plugin
cd plugins/clawtrace
npm install
npm test
Inspirations
Inspired by and builds on openclaw-tracing, a reference implementation for tracing OpenClaw executions.
License
Apache 2.0. See LICENSE for details.
Yorumlar (0)
Yorum birakmak icin giris yap.
Yorum birakSonuc bulunamadi