token-meter
Health Warn
- License — License: MIT
- Description — Repository has a description
- Active repo — Last push 0 days ago
- Low visibility — Only 6 GitHub stars
Code Fail
- rm -rf — Recursive force deletion command in test_meter.py
Permissions Pass
- Permissions — No dangerous permissions requested
No AI report is available for this listing yet.
Get insights into token usage for Claude code and Codex sessions with a dashboard and menu bar widget for mac
Token Meter
A local, live cost and activity dashboard for Claude and Codex, across their
CLI and desktop agent apps.
Token Meter follows the newest local agent log on your machine, parses
usage as it lands, and streams updates to a localhost dashboard. It is meant for
the moment when a long agent run is still active and you need to know whether it
is productive, expensive, stuck, or filling context.
Local-only. Python standard library only. No API keys. No telemetry leaves your
machine.
Features
- Live log cost: shows the running log/thread cost as entries are written,
with a hover breakdown for uncached input, cached input, cache writes, and
output tokens. - Token split: separates input, output, thinking, and tool-result tokens so
you can tell whether cost is coming from model output, cached context, or
tool payloads. - Auto-following: tracks the newest Claude Code CLI, Claude Desktop
Agent/Cowork, Codex CLI, or Codex desktop app log across local projects
without requiring a command per run. - Execution trace: normalizes messages, reasoning, tool calls, tool results,
usage events, coordination events, and completion events into one timeline. - Tool and MCP usage: groups tools by namespace, call count, returned-token
volume, and execution so large tool outputs are easy to spot. - Efficiency signals: highlights reasoning share, tool/retrieval bloat,
coordination tax, cost per task, context pressure, and spend anomalies. - Global view: summarizes local spend across logs, model mix, provider mix,
trend, anomalies, review priorities, expensive logs, and trace-backed tool
waste across sessions. - Daily summary: attributes spend to recorded local days, with active logs,
projects, runtime mix, highest-cost logs, and tool-result quality. - Learn view: provides a practical Token Meter review workflow with direct
links to each view and a searchable glossary of dashboard terms. - Global tool-waste evidence: ranks tools and MCP namespaces by returned
tokens, flags oversized results, exact immediate repeats, and structured
errors, and shows a 14-day result-token trend. - Tools & Skills view: inventories trace-observed tools, discovered MCP
servers, and installed Codex/Claude skills with runtime, source, state, use,
returned tokens, and last-use evidence. - Actionable capability optimization: measures only removable MCP servers
and configured skill packs, groups child functions/skills under their real
disable control, and excludes default or read-only tools from utilization and
removal recommendations. - Capability controls: when Ghost CLI is available, MCP servers can be
enabled or disabled for Codex and Claude. Plugin-managed skill rows can enable
or disable their containing skill pack; runtime-owned tools remain read-only.
A confirmed bulk action can disable the exact current unused review candidates
while rejecting built-in, runtime, used, or stale controls. Changes apply to
future sessions after the IDE or agent restarts. - Alerts and notifications: can notify on budget crossings, execution cost
spikes, and notable log insights. - macOS menu bar companion: shows a compact live status item backed by the
same local dashboard endpoint, with actions to open the full dashboard and a
five-session chooser that can pin one Claude or Codex run instead of flipping
between concurrently active traces. - Local-only operation: reads local JSONL logs and local capability
configuration and sends no telemetry. Configuration changes happen only from
an explicit dashboard action.
Requirements
- Python 3.8 or newer. The macOS package first tries
/usr/bin/python3, then
Homebrew and userpython3installs. - Claude Code CLI, Codex CLI, Claude Desktop Agent/Cowork, and/or the Codex
desktop app if you want live log data. - Ghost CLI on
PATHonly if you want to enable or disable MCP servers from the
Tools & Skills dashboard. Analytics and recommendations work without it. - macOS with the Swift toolchain, usually from Xcode Command Line Tools, when
running from source. The macOS package includes a prebuilt menu bar binary. curl, used by the helper scripts.
The web dashboard has no third-party Python packages. meter.py uses only the
Python standard library. Dashboard-only mode is available for development,
troubleshooting, and non-macOS use, but the normal experience includes the menu
bar companion.
Quick Start
Choose one install path.
Option 1: Install The macOS Package
This is the easiest path for most macOS users. We are not using GitHub Releases
yet, so open the repository's dist/ folder, download the latestTokenMeter-*.pkg there, then open it with Finder. The installer may ask for an
administrator password because it installs under/Library/Application Support.
If you have a local clone, you can open the checked-in package from the
repository root:
open dist/TokenMeter-0.1.0.pkg
The installer:
- installs Token Meter to
/Library/Application Support/Token Meter - installs a per-user LaunchAgent at
~/Library/LaunchAgents/com.token-meter.menubar.plist - starts the local Python server
- launches the prebuilt menu bar widget
- writes runtime logs to
~/Library/Logs/Token Meter
After install, open the full dashboard at:
http://localhost:8722
If no supported Claude or Codex logs exist yet, the dashboard will show an
empty state. Start a CLI or desktop agent run, then refresh or leave the
dashboard open; Token Meter will follow the newest local log automatically.
Check that the local server is healthy:
curl http://127.0.0.1:8722/health
Package users do not need the Swift toolchain. They do need Python 3.8 or newer
available as /usr/bin/python3, /opt/homebrew/bin/python3,/usr/local/bin/python3, or on PATH as python3.
To update, download the newer .pkg from dist/ and install it the same way.
The postinstall hook refreshes the installed files and restarts the Token Meter
LaunchAgent.
To uninstall a package install:
sudo "/Library/Application Support/Token Meter/bin/uninstall-token-meter"
Local unsigned packages can trigger macOS security prompts. Public distribution
should use a Developer ID signed and notarized package.
Option 2: Traditional Source Method
Use this path for development, local changes, or non-package installs:
git clone https://github.com/Galileo-Agent-Labs/token-meter.git
cd token-meter
./scripts/start-token-meter
The menu bar item starts automatically from that script. Open the full
dashboard at:
http://localhost:8722
Check that the local server is healthy:
curl http://127.0.0.1:8722/health
Stop the foreground server with Ctrl-C in the terminal that started it.
For source installs that should start automatically, see Launch At Login.
Build The macOS Installer Package
Maintainers can build a local installer package:
./packaging/build-pkg
The package is written to dist/TokenMeter-0.1.0.pkg by default. For the
repeatable build checklist and verification commands, seepackaging/BUILD_RECIPE.md.
For a signed package, set the signing identities while building:
TOKEN_METER_CODESIGN_IDENTITY="Developer ID Application: Your Name" \
TOKEN_METER_INSTALLER_SIGN_IDENTITY="Developer ID Installer: Your Name" \
./packaging/build-pkg
Public distribution should also be notarized with Apple.
Launch At Login
For source installs, install a macOS login item that starts both the local
server and the menu bar companion:
./scripts/install-launch-agent
Remove it:
./scripts/uninstall-launch-agent
Dashboard-Only Mode
For development, troubleshooting, or non-macOS use, run only the local web
dashboard:
python3 meter.py
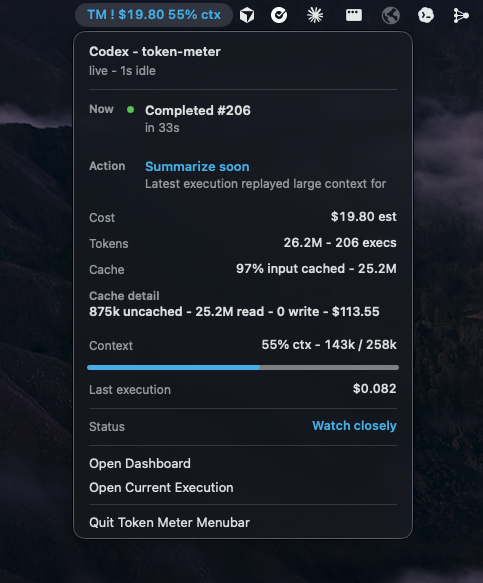
The menu bar companion polls the local /menubar endpoint and shows compact
status for the active log. Its Recent sessions section labels each entry as
Claude or Codex, uses the session title or project as an identifier, and keeps a
selected pin in macOS preferences. Choose Follow Latest to resume automatic
tracking. It does not parse logs directly.
How It Finds Logs
Token Meter reads local log stores:
Claude Code CLI:          ~/.claude/projects/*/*.jsonl
Claude Desktop metadata:  ~/Library/Application Support/{Claude,Claude-3p}/{claude-code-sessions,local-agent-mode-sessions}/**/local_*.json
Claude Desktop Agent:     ~/Library/Application Support/{Claude,Claude-3p}/local-agent-mode-sessions/**/.claude/projects/*/*.jsonl
Codex CLI + desktop app:   ~/.codex/sessions/YYYY/MM/DD/rollout-*.jsonl
Claude Desktop metadata contains the Desktop title, project directory, model,
and a cliSessionId. Token Meter joins that id to the authoritative Claude
trace under ~/.claude/projects, so Desktop sessions use the same validated
cost, token, tool, and execution parser without appearing twice. They are
labeled Claude Desktop in Current and Global views.
Token Meter scans both the standard Claude data root and the enterpriseClaude-3p root. Agent/Cowork sessions without a workspace are joined to their
nested JSONL and labeled No project. A regular Claude Desktop cloud
conversation still is not written to the local agent JSONL store, so its tokens
and tool calls cannot be attributed reliably.
Codex CLI and the Codex desktop app use the same local session store, so Token
Meter discovers both through ~/.codex/sessions.
It picks the newest source by modification time and recomputes state whenever
that source changes.
The Global tab keeps spend/model/trend cards visible, then uses three subtabs:Logs first, Global insights, and Capability evidence. Clicking a log opens
it as a frozen view at /sessions/<session-id>#summary, so refreshing or
sharing that local URL restores the same log. Clicking the top-level Current
tab or Back to live always removes the session path and returns to the active
newest log.
Dashboard tabs are addressable routes. The menu bar opens #summary for Open
Dashboard, #daily for Open Daily Brief, #activity for Open Trace, and#capabilities for Tools & Skills.
Current-session panels keep their panel name in the hash, while Global subtabs
use #global-logs, #global-insights, and #global-evidence.
What The Dashboard Shows
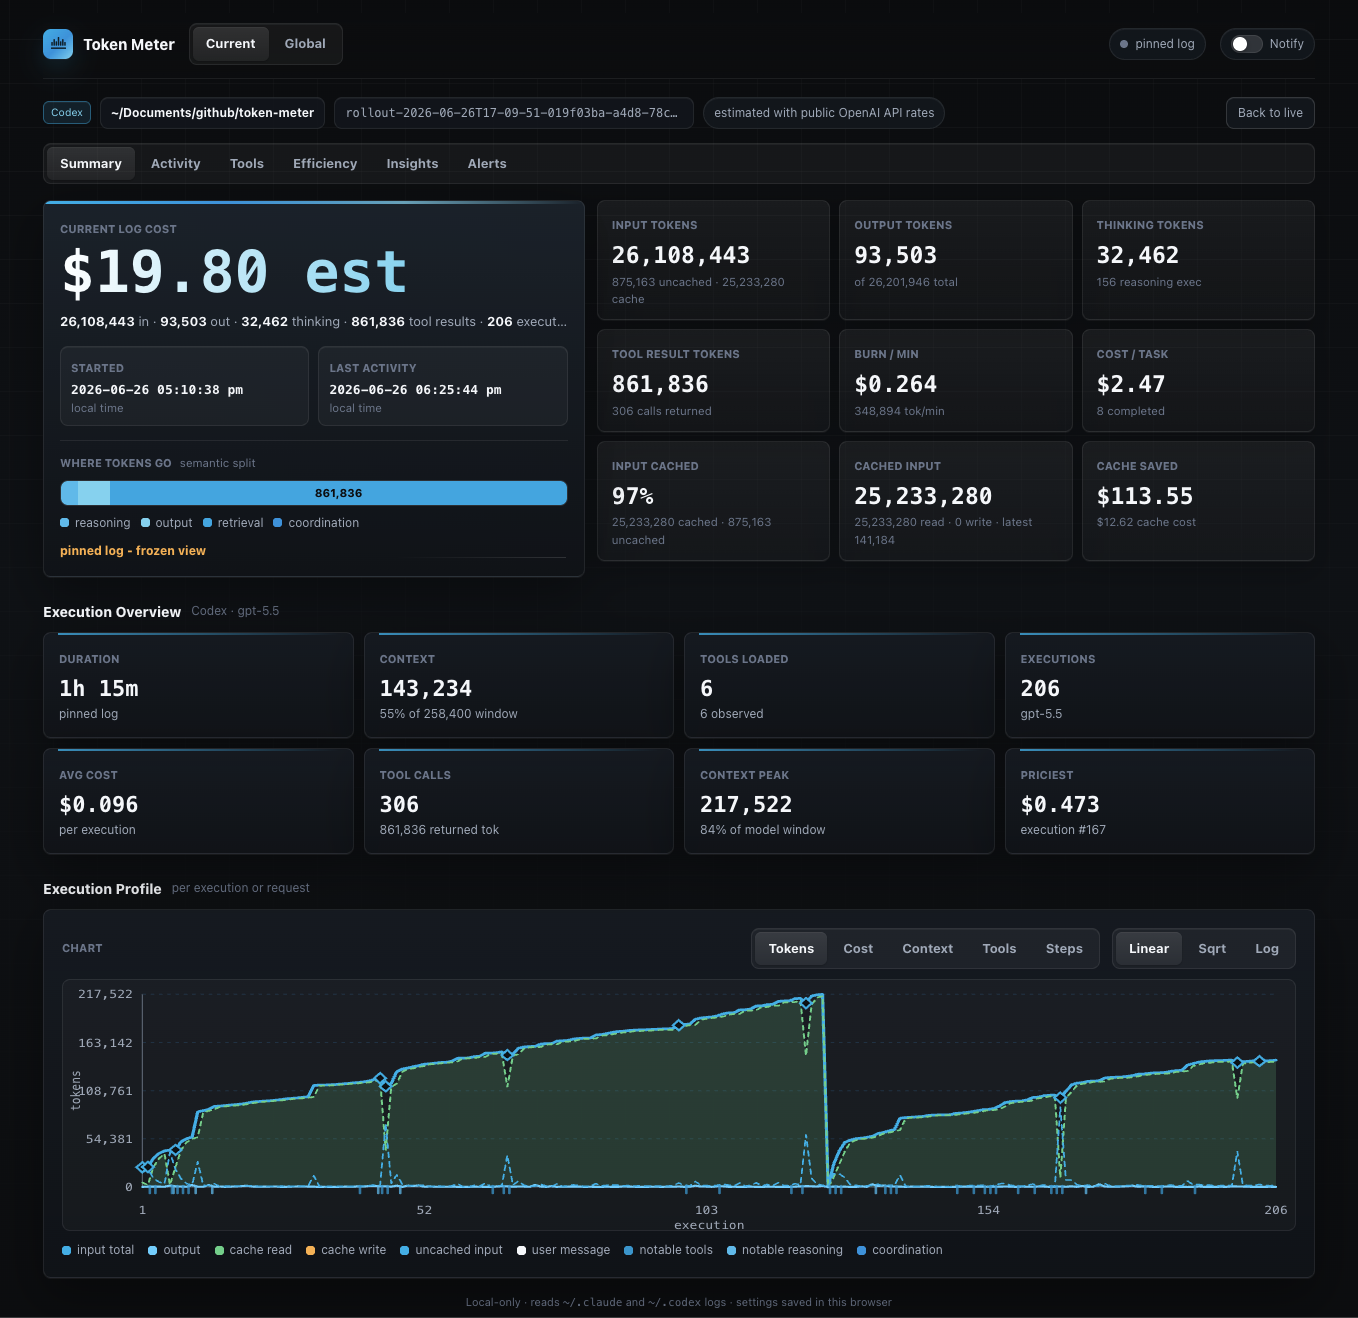
The Current tab includes:
- Summary: live cost, tokens, active execution duration, burn rate per active
minute, cache behavior, context pressure, per-execution input/output
trajectory, session tool activity, optional capability use, and measured
avoidable eager context. Idle gaps are excluded from duration and burn rate. - Activity: normalized event trace for messages, reasoning, tool calls, tool
results, usage, coordination, and completion. - Tools: tool and MCP usage by namespace and execution.
- Insights: plain-language log signals.
- Alerts: a per-session budget that starts at $10 for every new session, plus
execution-spike events.
The Global tab includes:
- Total spend across supported local Claude and Codex logs.
- Provider and model mix.
- 14-day spend trend with anomaly markers.
- An Overview-first subtab with today, runtime/model mix, review priorities, and
the highest-cost logs, followed by a searchable Logs subtab. - A Global insights subtab with trace-observed tool-result totals and tokens
flagged by oversized, exact-repeat, or structured-error rules, ranked
payloads, and a 14-day result-token trend. - A Capability evidence subtab with project concentration, last use, failures,
recommendations, and server-level MCP evidence. - MCP state changes live in the Tools & Skills tab.
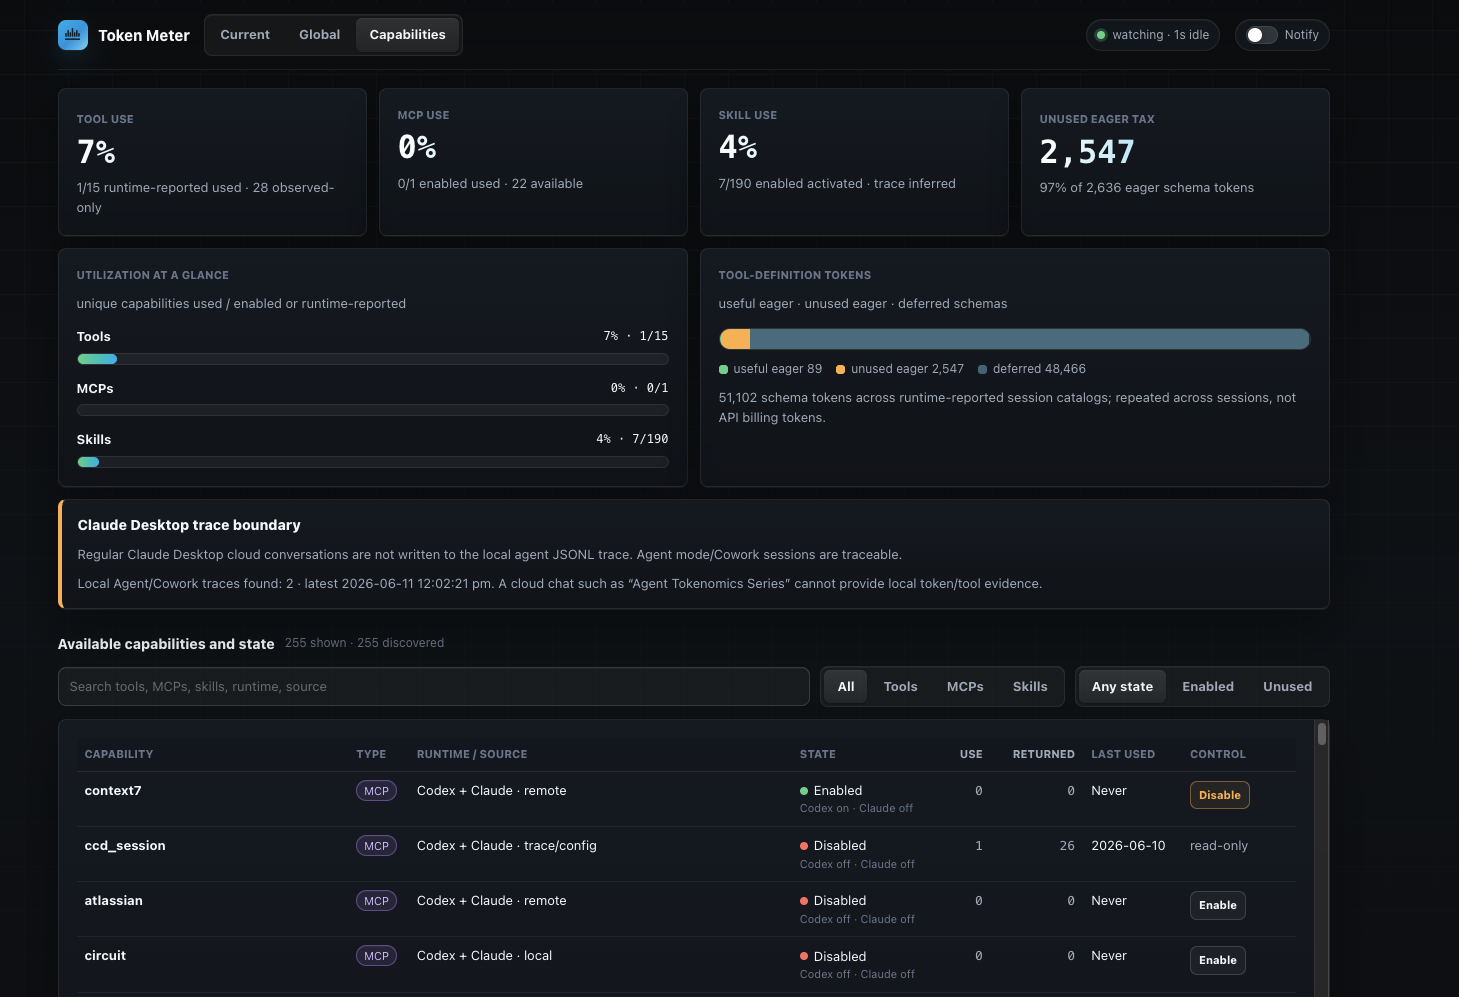
The Tools & Skills tab includes:
- Prominent counts for enabled removable groups, groups used across scanned
logs, review candidates, and measured avoidable eager context. Default tools,
standalone skills, and built-in/runtime skill packs are excluded. - An optimization insight that explains the removable MCP servers and skill
packs needing review and can filter the inventory to those candidates. - A tool-definition chart separating useful eager, unused eager, and deferred
schema tokens across session catalogs. - Searchable Tools, MCPs, and Skills inventory with sortable runtime, source,
state, observed calls/activations, returned tokens, last use, and control
columns. Skill identifiers include runtime and origin or plugin pack so
same-named built-in and user-installed skills remain distinct. - MCP enable/disable actions through fixed
ghost mcp all add/removeargument
vectors and skill-pack enable/disable actions for configured Codex and Claude
plugins. Disable all unused confirms and submits only the exact current
review-candidate IDs. Individual runtime-owned tools and standalone skills are
read-only.
To use it, open Tools & Skills in the dashboard or choose Open Tools &
Skills from the macOS menu bar companion. Start with the optimization insight
to review enabled removable groups with no observed use. Then search or filter
the inventory by Tools, MCPs, Skills, Enabled, Unused, or Review candidates.
The Use, Returned, and Last used columns provide the trace evidence for
deciding what to keep or disable. Deferred and default/read-only tools remain
visible as evidence but are not labeled removable waste.
Rows with an available control can be enabled or disabled after confirmation.
Pack changes name the exact runtime control and affected skills, then read the
persisted Codex or Claude enabled value back before reporting success. MCP
controls require Ghost CLI on PATH; restart Codex, Claude, or the relevant IDE
after a change so it applies to new sessions. A read-only row is observed by
Token Meter but cannot be changed from the dashboard.
Token Meter does not claim that every flagged token was billed waste. Returned
tokens are estimated from trace-visible text, embedded image/base64 bytes are
excluded, and a token is counted once in the flagged total even when it matches
multiple rules.
Cost Notes
Claude costs are computed from the local CLAUDE_PRICE table in meter.py.
Codex costs are computed from the local OPENAI_PRICE table and are shown as
estimates because Codex subscription billing can differ from public API-rate
accounting.
Pre-flight estimation is out of scope. Token Meter reads logs after usage is
recorded, so it shows cost as it accrues rather than predicting the next
execution.
Privacy
Token Meter binds to 127.0.0.1 and serves only a local browser dashboard. It
does not send logs, prompts, responses, project paths, token counts, or
costs to any external service.
The dashboard can display local project paths, tool names, and trace metadata.
Do not expose the localhost page publicly unless you are comfortable sharing
that information.
The Tools & Skills table can invoke ghost mcp all add/remove <server> after an
in-dashboard action. The server name is validated and passed as a fixed
subprocess argument; Token Meter does not run arbitrary dashboard-provided shell
text. Plugin-pack actions validate the exact discovered runtime control, update
only its enabled state in the local Codex or Claude configuration, and verify
the persisted value before refreshing the table. Restart Codex, Claude, or the
IDE after a successful capability change.
Troubleshooting
Port 8722 is already in use
Find the process:
lsof -nP -iTCP:8722 -sTCP:LISTEN
Stop the existing Token Meter process, or edit PORT in meter.py.
The dashboard says no logs were found
Confirm that at least one of these directories exists and contains JSONL logs:
ls ~/.claude/projects
ls ~/.codex/sessions
Then run a supported Claude or Codex CLI/desktop agent task and reload the
dashboard.
Claude Desktop projects appear as Claude Code
Confirm Desktop metadata exists:
find "$HOME/Library/Application Support/Claude/claude-code-sessions" -name 'local_*.json'
Each metadata record must contain a cliSessionId matching a JSONL filename
under ~/.claude/projects. Restart the source-tree Token Meter server after an
upgrade; an older installed server will not include the Desktop attribution
join.
A Claude Desktop cloud conversation does not appear
Regular cloud chats do not produce the local agent JSONL that contains usage
and tool evidence. Start the task in Claude Desktop Agent mode/Cowork if you
need trace-backed Token Meter metrics. The Tools & Skills tab reports how many
local Agent/Cowork traces it found and the latest one it can attribute.
The dashboard says page.html is missing
Token Meter serves the UI from page.html. Use a full repository clone and run
from the clone:
git clone https://github.com/Galileo-Agent-Labs/token-meter.git
cd token-meter
./scripts/start-token-meter
If you copied meter.py somewhere else, copy page.html into that same folder
too, or start the server from the repository root.
If you already started Token Meter from the wrong directory, the old server may
still be running. Stop the process listening on port 8722, then start again:
lsof -nP -iTCP:8722 -sTCP:LISTEN
kill <PID>
./scripts/start-token-meter
Browser notifications do not appear
Use the notification toggle in the top-right of the dashboard. If notifications
were previously blocked for localhost, clear the block in browser site
settings and toggle notifications again.
The menu bar companion will not build
Check that swiftc is available:
swiftc --version
On macOS, install the Xcode Command Line Tools if needed:
xcode-select --install
Validate
Run these checks from the repository root:
PYTHONPYCACHEPREFIX=/private/tmp/token-meter-pycache python3 -m py_compile meter.py
swiftc menubar/TokenMeterMenuBar.swift -o /private/tmp/token-meter-menubar
TOKEN_METER_MENUBAR_SMOKE=1 /private/tmp/token-meter-menubar
node -e "const fs=require('fs'); const html=fs.readFileSync('page.html','utf8'); const m=html.match(/<script>([\\s\\S]*)<\\/script>/); new Function(m[1]); console.log('js ok')"
python3 -c 'import meter; st=meter.recompute(meter.newest_source()); print(st["provider"], st["turns"], len(st["trace"]), st["tools"]["total_calls"])'
The final command requires at least one supported local Claude or Codex log.
Repository Layout
.
|-- meter.py                         # local HTTP server, log parsers, pricing, SSE
|-- page.html                        # single-file dashboard UI
|-- images/
|   |-- dashboard.png                # README dashboard screenshot
|   `-- menu-bar-widget.png          # README menu bar screenshot
|-- menubar/
|   `-- TokenMeterMenuBar.swift      # native macOS menu bar companion
|-- packaging/
|   |-- build-pkg                    # builds a macOS installer package
|   |-- payload/bin/                 # scripts installed by the package
|   `-- scripts/postinstall          # package install hook
|-- scripts/
|   |-- run-menubar                  # build and run the menu bar companion
|   |-- start-token-meter            # start server if needed, then menu bar
|   |-- install-launch-agent         # install macOS login item
|   `-- uninstall-launch-agent       # remove macOS login item
|-- REQUIREMENTS.md                  # product rationale and historical notes
|-- CONTRIBUTING.md
|-- SECURITY.md
|-- LICENSE
`-- README.md
Before Publishing On GitHub
Commit the app source, scripts, images, public docs, and the distributable
installer package:
README.md
LICENSE
meter.py
page.html
images/dashboard.png
images/menu-bar-widget.png
menubar/TokenMeterMenuBar.swift
packaging/
scripts/
REQUIREMENTS.md
CONTRIBUTING.md
SECURITY.md
dist/TokenMeter-*.pkg
.gitignore
Do not commit local runtime artifacts such as .DS_Store, *.log,__pycache__/, or .build/. The included .gitignore covers those files.
Keep dist/ limited to package files that users should download.
License
MIT. See LICENSE.
Reviews (0)
Sign in to leave a review.
Leave a reviewNo results found