deep-learning-stock-prediction
Health Gecti
- License — License: MIT
- Description — Repository has a description
- Active repo — Last push 0 days ago
- Community trust — 19 GitHub stars
Code Gecti
- Code scan — Scanned 8 files during light audit, no dangerous patterns found
Permissions Gecti
- Permissions — No dangerous permissions requested
Bu listing icin henuz AI raporu yok.
This project uses machine learning models (Linear Regression and LSTM) to analyze and forecast stock market prices. It retrieves stock data from Yahoo Finance, performs exploratory data analysis (EDA), processes and engineers features, and predicts future prices. The project includes model evaluation metrics
📊 Yahoo Finance Stock Market Analysis (AAPL, MSFT, AMZN, TSLA)
🚀 Introduction
Stock market prediction is a crucial area in financial analysis. Prices of stocks are influenced by various factors, such as market trends, economic indicators, and investor sentiment. This project focuses on analyzing and forecasting stock prices of Apple (AAPL), Microsoft (MSFT), Amazon (AMZN), and Tesla (TSLA) using deep learning.
Using Yahoo Finance data, we apply Exploratory Data Analysis (EDA), Feature Engineering, Preprocessing, and Long Short-Term Memory (LSTM) Regression modeling to predict stock prices.
The notebook file and update other models are available at: Kaggle Notebook
🎯 Objectives
✅ Retrieve stock market data using yfinance 📈
✅ Perform EDA to visualize trends & correlations 📊
✅ Extracting features like RSI, MACD,Bollinger Bands, Moving Averages vs.
✅ Preprocess the data for deep learning (normalization, handling missing values)
✅ Implement an LSTM and Linear Regression models for stock price forecasting 🧠
✅ Evaluate predictions using RMSE, and MAE scores
✅ Compare actual vs. predicted stock prices 📉
🏗️ Project Workflow
🔹 Step 1: Data Collection (Yahoo Finance API)
🔹 Step 2: Exploratory Data Analysis (EDA)
🔹 Step 3: Feature Engineering (Technical Indicators)
🔹 Step 4: Data Preprocessing (Normalization, Reshaping)
🔹 Step 5: LSTM & Linear Regression Models Training & Prediction
🔹 Step 6: Model Evaluation (Error Metrics)
🔹 Step 7: Results & Visualization
⚙️ Installation & Setup
📌 1. Clone the Repository
git clone https://github.com/gamzeakkurt/deep-learning-stock-prediction.git
cd deep-learning-stock-prediction
📌 2. Install Dependencies
pip install -r requirements.txt
📌 3. Run the Python
python main.py
Open main.py and execute the code.
To run the full analysis and forecasting pipeline, execute the main.py file. This will sequentially:
- Load stock data from Yahoo Finance
- Perform exploratory data analysis (EDA)
- Process data with feature engineering and normalization
- Train and evaluate a Linear Regression model
- Train and evaluate an LSTM model
- Forecast future stock prices
- Visualize results and save predictions
📦 Dependencies
The project requires the following libraries:
yfinance
quantstats
ta
PyPortfolioOpt
pandas==1.3.5
numpy
matplotlib
seaborn
scikit-learn
tensorflow
keras
plotly
You can install them using:
pip install yfinance quantstats ta PyPortfolioOpt pandas numpy matplotlib seaborn scikit-learn tensorflow keras plotly
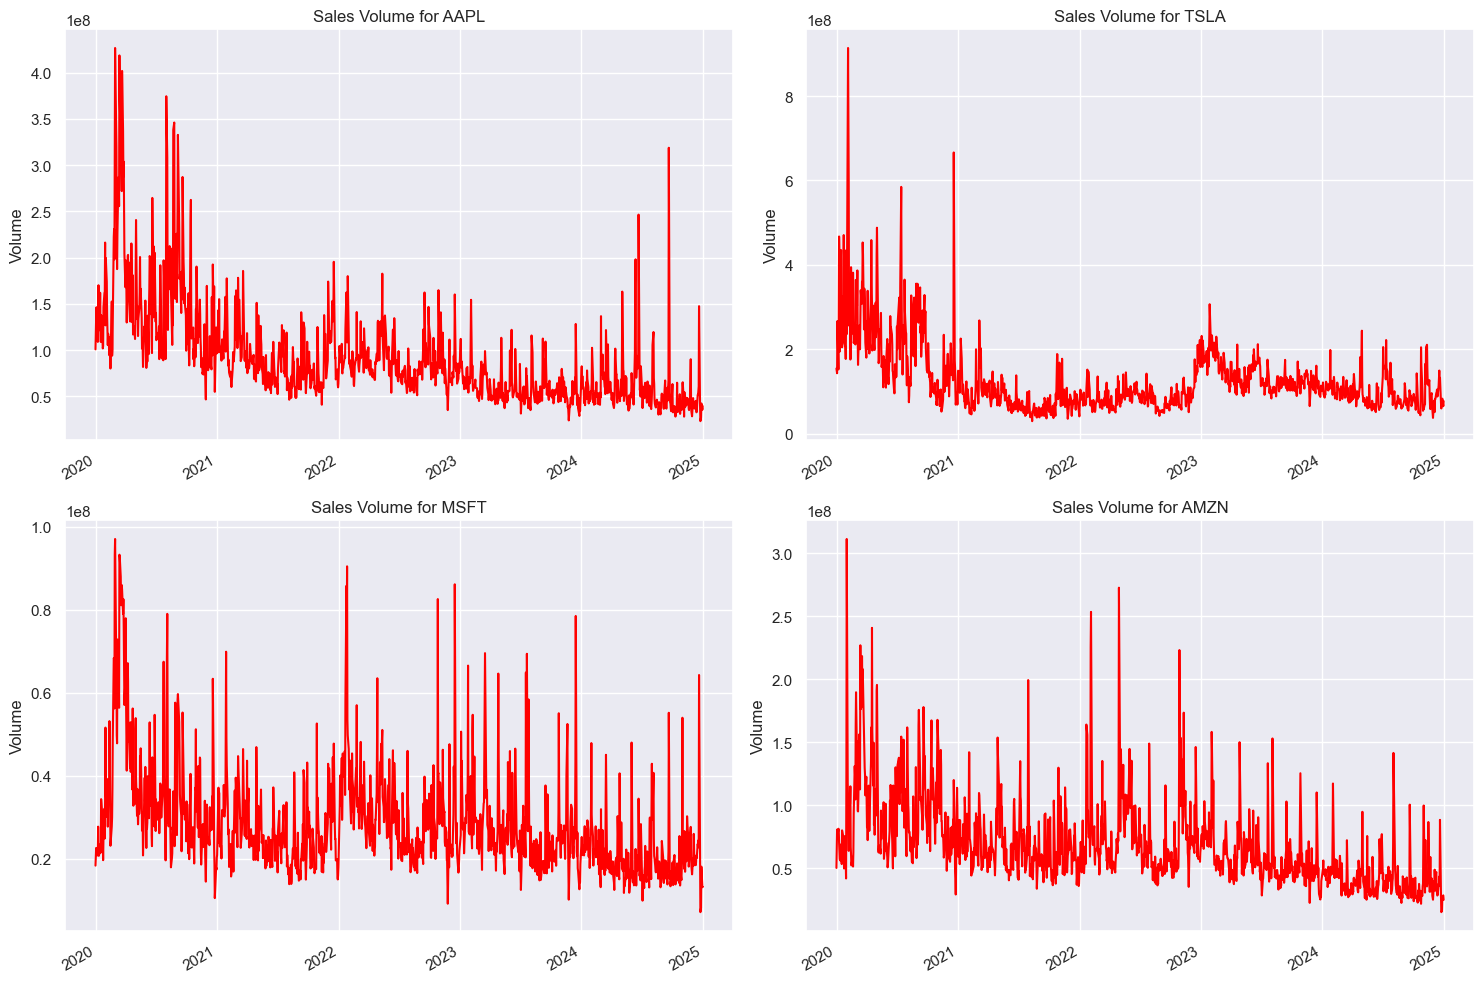
📊 Exploratory Data Analysis (EDA)
✅ Stock Price Trends: Visualize historical stock prices over time
✅ Moving Averages & Indicators: Compute SMA, EMA, RSI, and MACD
✅ Correlation Analysis: Analyze relationships between different stocks
🔍 Example Visualization:
🏗️ LSTM Model Architecture
The BiLSTM (Bidirectional Long Short-Term Memory) model used for stock price prediction follows the architecture below:
Model Overview
Input Shape:
(n_timesteps, 18)
The input consists of sequences withn_timesteps(time steps) and 18 features for each time step.LSTM Layers:
- 3 stacked Bidirectional LSTM layers with 64 units each.
The bidirectional nature allows the model to learn from both past and future data points.
- 3 stacked Bidirectional LSTM layers with 64 units each.
Fully Connected Layer (Dense Layer):
A Dense layer with 32 units and ReLU activation to learn complex patterns from the LSTM outputs.Output Layer:
A final Dense layer with 1 unit to predict the 'Close' price of the stock.
Model Parameters
Activation Function:
- Hidden layers: ReLU activation
- Output layer: Linear activation
Optimizer:
Adam optimizer for efficient training and learning.Loss Function:
Huber loss for robust training, balancing between Mean Squared Error (MSE) and Mean Absolute Error (MAE).
This architecture is designed to effectively capture complex patterns in time-series data, particularly for stock price forecasting.
📈 Results & Evaluation
The model is evaluated using the following metrics:
📌 Root Mean Square Error (RMSE)
📌 Mean Absolute Error (MAE)
🔍 Example Prediction Plot:

📄 Additional Information
All details regarding the code, including visualization, results, and interpretation, are available in the 'YahooFinanceStockMarketAnalysis-Report.pdf' document. You can download it for an in-depth understanding of the analysis and forecasting process.
📌 Future Improvements
🔹 Hyperparameter Optimization: We will fine-tune model parameters to enhance predictive
accuracy and reduce errors.
🔹 Model Comparison: In addition to LSTM, we will evaluate and compare performance with
ARIMA, XGBoost, and CNN models to identify the most effective approach.
🔹 Feature Expansion: We plan to incorporate additional financial indicators and external
factors (e.g., market sentiment, economic trends) to improve model robustness.
🔹 Hybrid Model Approach: Combining LSTM with ARIMA, XGBoost, and CNN to
leverage both deep learning and traditional statistical methods for improved performance.
📜 License
This project is licensed under the MIT License.
🔍 Keywords
#yahoofinance #finance #economics #deeplearning #stockprediction #machinelearning #eda
📬 Contact
For any questions or suggestions, feel free to reach out.
Yorumlar (0)
Yorum birakmak icin giris yap.
Yorum birakSonuc bulunamadi