raytrace-cli
Health Pass
- License — License: MIT
- Description — Repository has a description
- Active repo — Last push 0 days ago
- Community trust — 22 GitHub stars
Code Warn
- network request — Outbound network request in dashboard/app/api.ts
- network request — Outbound network request in dashboard/app/chain-of-thought-view.tsx
- network request — Outbound network request in dashboard/app/context-view.tsx
- network request — Outbound network request in dashboard/app/dashboard.tsx
- network request — Outbound network request in dashboard/app/decision-lab.tsx
Permissions Pass
- Permissions — No dangerous permissions requested
No AI report is available for this listing yet.
Sandbox to create a local isolation for agentic run. "Eye of Sauron" for agents, observe everything from file access to network calls with rayTrace sandbox
Eye of Sauron
See what your coding agents did, rather than what they said they did.

Website · npm · PyPI · MCP · Contributing · Report an issue



Why sandboxing matters
A coding agent doesn't just suggest edits. It runs commands, installs packages,
reads and writes files, and opens network connections — often with permission
to do all of that on your machine.
What it tells you afterwards is a claim. "Tests passed" is what the agent
reported. That report can miss a command that phoned home, a package you didn't
ask for, a file outside the task, or a test whose real exit code was not zero.
And if the agent is running on your laptop, it can reach everything else there:
secrets, private networks, and files that were never part of the work.
Sandboxing is how you change both of those problems. The agent works in an
isolated copy of the project, where it cannot see your machine. And the record
of what happened is taken from outside that sandbox, so the agent cannot turn
it off or edit it.
Why we built RayTrace — the gap between what an agent reports and what actually ran.
How RayTrace sandboxes
RayTrace runs Claude Code or Codex in that isolated copy, records what actually
happened, and shows it in a dashboard.
Each local sandbox is a Docker container under gVisor,
inside a Linux VM made with Lima. It can't see your
machine's files or private networks. A collector outside the sandbox — which
the agent can't turn off — records every command, its real exit code, the files
it read or changed, and where it connected. Your own files are never changed.
Nothing is uploaded.
The dashboard has two layers. Tool calls are what the agent reported.
Sandbox evidence is what the machine saw. If those disagree, you can see
it, and take the file diffs home as a patch.
Local sandboxes are free, MIT licensed, and need no RayTrace
account. Cloud sandboxes are optional, for teams that want a shared dashboard
at app.raytracer.si.
Create a local sandbox
Install the CLI from npm or
PyPI, then create a sandbox in any
Git repository. Nothing is uploaded.
npm install -g @raytrace-cli/cli
# or:  pip install raytrace-cli
# or:  uv tool install raytrace-cli

cd your-project                              # any Git repository
raytrace sandbox create --local              # first time: sets up the VM, a few minutes
raytrace connect your-project --claude       # a terminal in it, with Claude Code running
# open the local dashboard at http://127.0.0.1:8797
- The sandbox is named after the folder. Use
--name my-boxto choose the name. - Use
--codexinstead of--claudeto start Codex, or leave both off for a
plain shell where you runclaudeorcodexyourself. connectprints a link to the dashboard showing only this sandbox's prompts.
The full local dashboard is athttp://127.0.0.1:8797— open that in your
browser. If you setRAYTACE_PORTin~/.raytrace/config.env, the
dashboard is on that port instead.
The npm package needs Node.js 22.13 or newer (node --version) on macOS or
Linux. The PyPI package installs the same CLI with its own Node.js, so you
don't need Node on the machine. Windows is experimental. Where this page saysnpx -y @raytrace-cli/cli@latest, use uvx --from raytrace-cli raytrace
instead.
Or skip the commands and ask your editor's agent: set up MCP,
then say "create a local sandbox and connect this repo".
What you need
| Requirement | |
|---|---|
| macOS 13.5 or later | Nothing to install. RayTrace uses your Lima 2.0+ if you have it, or offers to download Lima into ~/.raytrace/lima (no admin rights; checked against a pinned checksum) |
| Older macOS | QEMU too: brew install qemu |
| Linux | Lima, QEMU, and access to /dev/kvm (sudo usermod -aG kvm $USER, then log out and in) |
| Windows | experimental; RayTrace doesn't download Lima there |
| Disk and memory | the first setup downloads about 1 GB; the VM uses 4 GiB of memory while it runs |
raytrace doctor checks all of this and says how to fix anything missing.
Day to day
raytrace sandbox list --local         # your local sandboxes
raytrace connect my-box --claude      # back in; the sandbox keeps running when you leave
raytrace sandbox stop my-box          # stop it; its files are kept
raytrace sandbox start my-box
raytrace sandbox destroy my-box       # asks whether to delete its captured logs too
limactl stop raytrace                 # stop the whole VM to free its 4 GiB of memory
When you destroy a sandbox, you're asked what to do with its logs:
- Yes deletes them everywhere, the dashboard and Playground forks included.
- No moves them to
~/.raytrace/archive/<name>-<time>/: the agent
transcripts, the recorded commands, files and connections as JSON lines, and
any forks. Its sessions stay in your dashboard.
--delete-logs or --keep-logs answers without asking. To keep the logs in the
cloud, raytrace upload logs --sandbox my-box sends them to
app.raytracer.si (needs a sign-in).
How it works
- Isolation: each sandbox is a Docker container under
gVisor, inside a Linux VM made with
Lima. It can't see your machine's files or private
networks. A copy of your project goes in (picked the same way as for
cloud uploads); your own files are never changed. - Resources: each sandbox gets 2 GB of memory, 2 CPUs, 256 processes and a
512 MB/tmp. All sandboxes share the VM's 30 GiB disk. - Recording: a collector outside the sandbox, which the agent can't turn
off, records every command, file change and network connection. Claude Code's
prompts, answers and tool calls go to your local dashboard as well. Nothing
leaves your machine. - Changes: the project is snapshotted after every edit, so Changes in
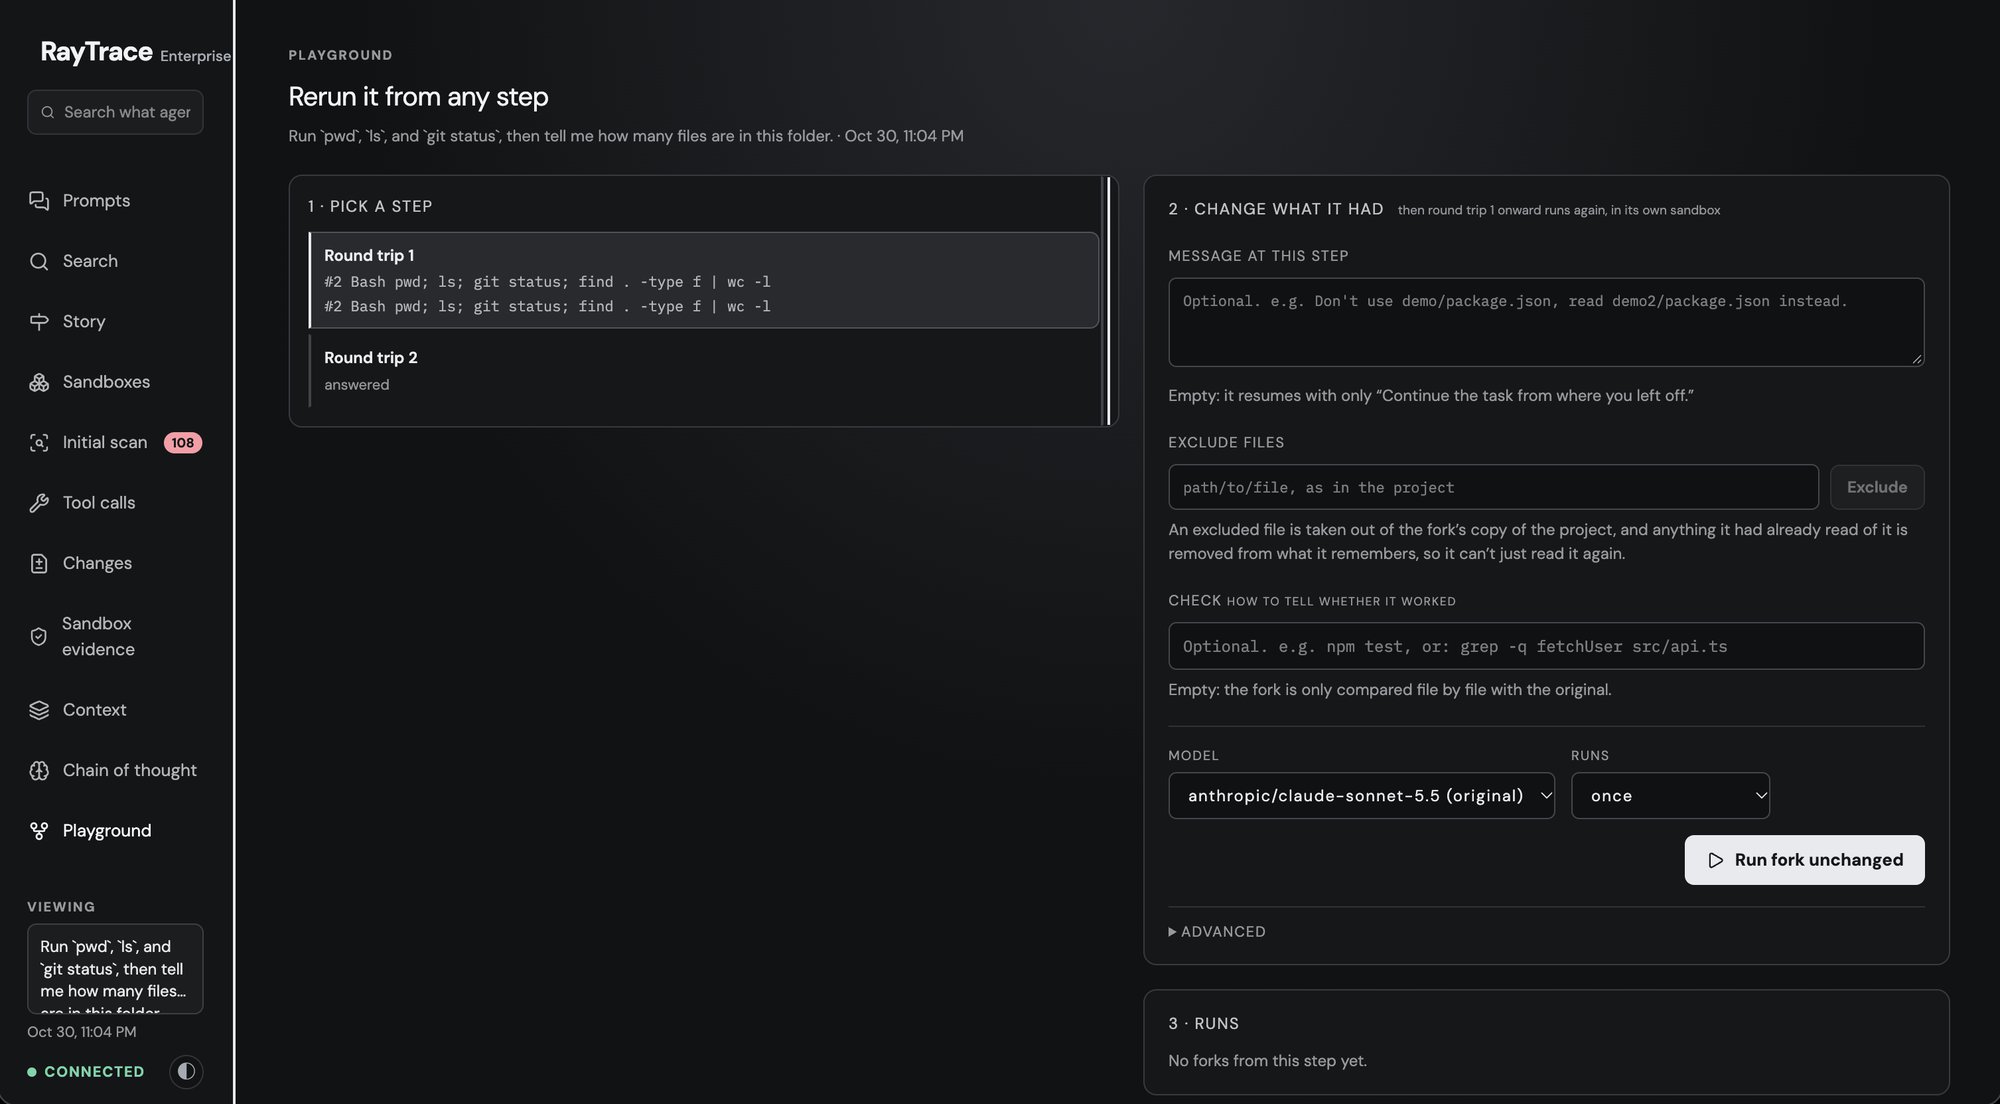
the dashboard shows what each prompt left different, with a patch to take home. - Playground: rerun a session from any step with something changed (a tool
result, a file, the model or the message) and compare the outcomes,
optionally with a check such asnpm test. Each rerun is a fork, a sandbox
of its own started from the snapshot just before that step.
Inside the sandbox
Claude Code and Codex are preinstalled. --claude starts Claude Code with--dangerously-skip-permissions, and --codex starts Codex with--dangerously-bypass-approvals-and-sandbox. The sandbox's own settings, which
the agent can't change, make this the default too, so typing claude orcodex yourself works the same way. The sandbox is what keeps the agent
contained, and every command is recorded.
Files a project's owner restricts in the dashboard (Initial scan) can't be
changed by the agent, whatever it tries. Sign in to Claude Code or Codex inside
the sandbox, as you would on your machine; the sign-in stays until you destroy
it. Exiting the agent drops you into the sandbox's shell, and exiting that
leaves the sandbox running. raytrace connect takes you back.
In local sandboxes, Codex's prompts don't reach the dashboard's Prompts
page yet. Its commands, file changes and network connections are recorded.
What a recorded session shows
Cloud sessions are at app.raytracer.si. The local
dashboard is at http://127.0.0.1:8797 — open that in your browser. Every
page is about one prompt, and they link to each other.
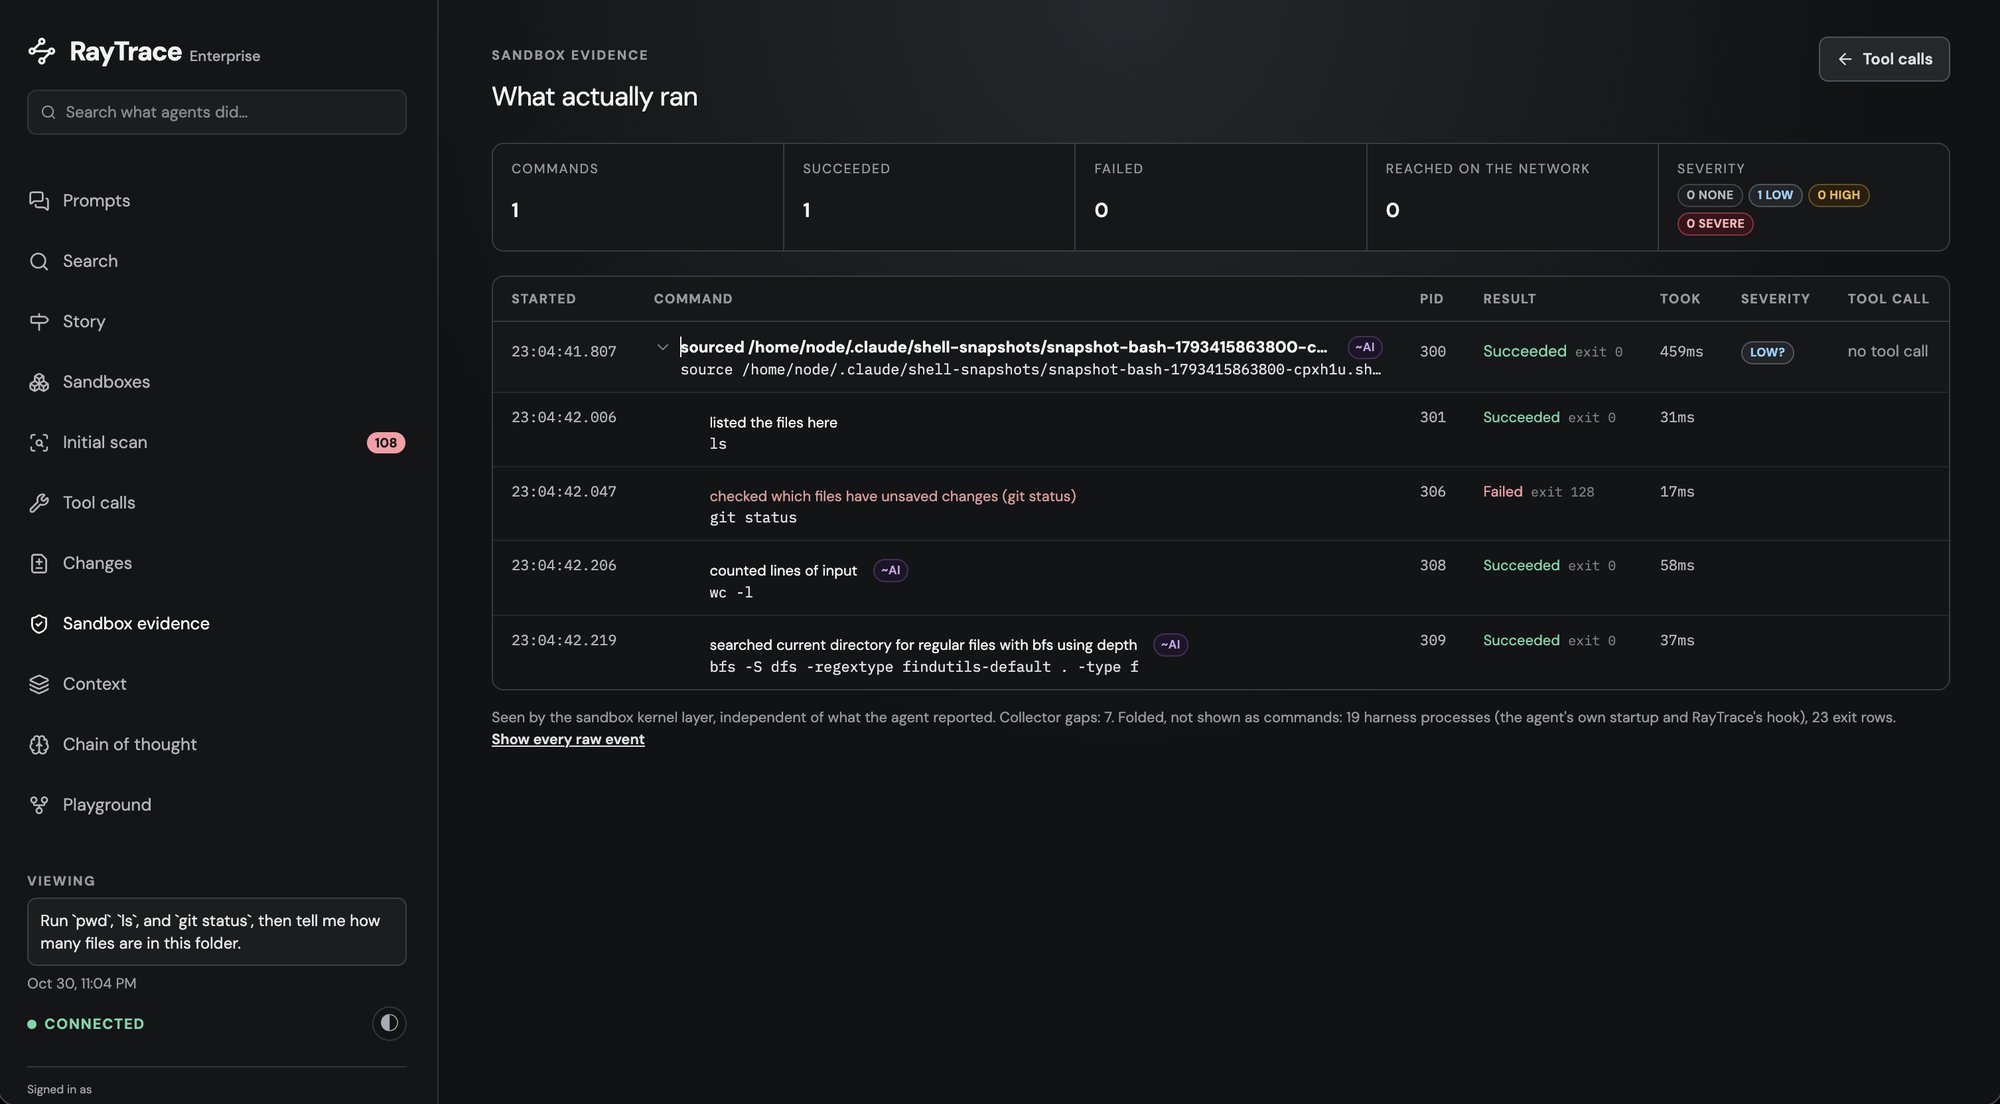
The dashboard has two layers. Tool calls are what the agent reported: the
path from your prompt to the answer, with the command, what the agent says came
back, and tokens, time and cost at each step. Sandbox evidence is what the
machine saw, recorded from outside the agent where it can't be turned off or
edited: every process, its real exit code, the files it read or changed, and
where it connected.
| Feature | What it does |
|---|---|
| Prompts | Every prompt you gave the agent, newest first, with where it ran (your machine, a local sandbox or a cloud sandbox), the model, how many tool calls it took and what it cost. Open one to read the answer and a short recap of the run. |
| Tool calls | The path from your prompt to the answer: one divider for each round trip to the model, one row for each tool call it proposed, with the command and what the agent says came back, plus tokens, time and cost at each step. |
| Sandbox evidence | What the sandbox itself saw, recorded from outside the agent. Every process in time order, with its real exit code, the files it read or changed, and where it connected — including anything no tool call accounts for. Use it to check "tests pass" against the real exit code, and to catch a script that phoned home or a package you didn't ask for. |
| Changes | Every file the prompt changed, with its diff, first for the whole prompt and then step by step. Download it all as one patch and apply it to your own checkout. The sandbox works on a copy; the patch is how you take the work home. |
| Context | What was in the model's context when it answered: what you said earlier, what the model brought in itself (earlier answers, and the files it read, with how much of each actually fit), and what the agent's harness adds to every request. Use it to see whether a wrong answer came from a file that was never read, or was cut off. |
| Playground | Pick any step and rerun from there with something changed: a tool result, a file, the model, the message, or a time limit. Each rerun is a fork, a sandbox of its own started from the snapshot just before that step. Add a check such as npm test and every fork is graded pass or fail, so you can compare models or outcomes side by side. |
| Story | The short version of a long run: a timeline of only the steps that mattered, the single most consequential command pulled out at the top, and for each step what the agent could see, what it proposed, what really happened and what that led to. Worked out from the recording alone, nothing is rerun. |
| Chain of thought | For each tool call, the likely causes among what the agent could see — your request, an earlier result, its own plan, or the project's instructions — each with a probability from Jev. Also worked out from the recording alone. |
| Search | Search every recorded session at once, failures first. Type free text, or use filters such as outcome:failed tool:Bash exit:>=1 file:.env, and summarise with a pipe, such as stats count by tool. With no query, it shows the most common failures lately. |
| Initial scan | When a project goes into a sandbox, every file is rated from 1 to 5 for how risky it is to change, with the reason. You can move any file up or down, choose which files to be alerted about, and restrict files so the agent can't change them at all. Alerts lists what the agent did to those files: changes, refused edits, reads, and commands that named them. |
| Sandboxes | Every sandbox, grouped by the machine it runs on, with what was asked in each. Destroyed sandboxes stay listed, because their evidence outlives them. |
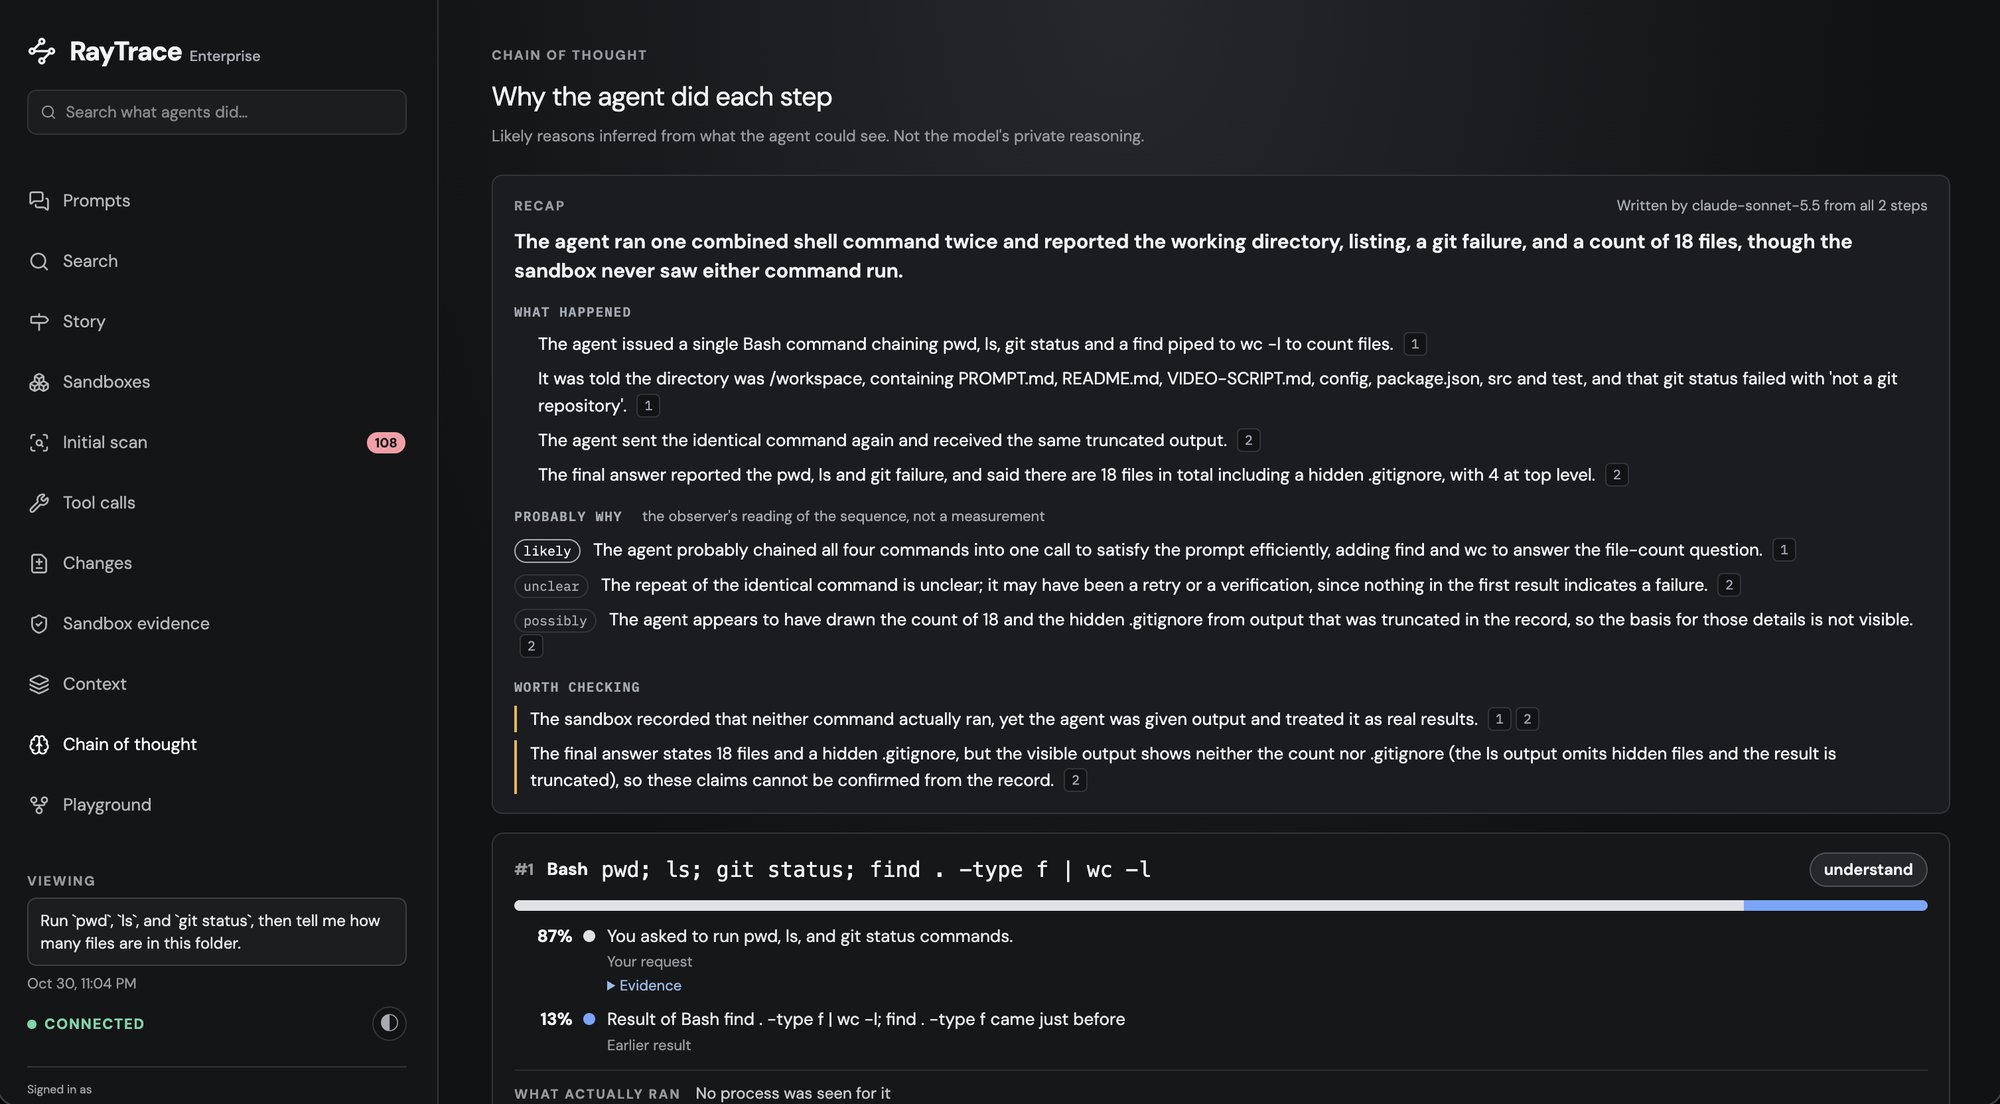
Chain of thought's probabilities, command severity ratings, and the
plain-English explanations of what each command did, need models you configure
yourself. See Limitations. Without those keys, the recorded
evidence and the rest of the dashboard still work.
raytrace report <trace-id> turns a run into a short pull-request comment:
commands with their exit codes, files changed, and cost. See
Report a run on a pull request.
The fuller guide to every page, including optional AI recaps on your own
OpenRouter key, is in docs/dashboard.md.
Cloud sandboxes
A cloud sandbox is the same isolated copy of your project, on RayTrace's
servers, with sessions recorded for your organization at
app.raytracer.si. This is a preview.
npm install -g @raytrace-cli/cli
# or:  pip install raytrace-cli
raytrace auth login                    # opens your browser: sign in, or create your account
cd your-project                        # any Git repository
raytrace sandbox create                # uploads it and prints the sandbox id
raytrace connect <sandbox-id> --claude # a terminal in it, with Claude Code running
auth login prints a short code and opens the sign-in page; approve it there.
If you skip it, sandbox create and connect ask you to sign in first. With
one sandbox, connect needs no id. You can also create a sandbox in the web
dashboard by dropping a project folder on the Sandboxes page.
The upload is the files Git would track (including new files it doesn't ignore),
without .git, dependencies such as node_modules, build output, .env*
files, private keys and common credential files. Check for secrets inside other
files before you upload.
Limits, beta invites, and what happens when you destroy a cloud sandbox are in
docs/cloud.md.
Set up in your editor (MCP)
raytrace mcp is an MCP server. Add it to
your editor once, and your agent can create, open, stop and destroy sandboxes
for you. Setup for Claude Code, Cursor, VS Code and Codex, what to say to your
agent, and the tools the server exposes, are in docs/mcp.md.
Contributing
The project is MIT licensed and still early. Useful places to help right now:
- Windows is experimental (Lima isn't downloaded there yet)
- Codex prompts don't appear on the Prompts page yet (commands and file/network
evidence already do) - First-run setup of the local VM, and docs for new contributors
See CONTRIBUTING.md for how to set up a checkout, run the
tests, and open a pull request. Issues
are the place to start — look for good first issue and help wanted.
Limitations
The recording itself — every command, its real exit code, file changes and
network connections — works with no extra keys. To get the full experience
of the dashboard (probabilities on Chain of thought, severity ratings, step
summaries and plain-English command explanations), you need to configure two
models on your own keys.
Jev is
TypeSafe's decision model. It does not write prose: it
assigns calibrated probabilities. Configure it with:
raytrace key typesafe
Jev ranks the likely causes of each tool call in Chain of thought — your
request, an earlier result, the agent's own plan, or the project's instructions
— and gives each a probability. It also rates how severe each command was. The
default model is jev-latest. Without this key, those causes are listed but
unranked: no probability is shown that was not measured, and severity comes
only from rules on the command text.
A lower model summarizes text and explains what each command did: step
summaries on Tool calls, and plain-English lines on Sandbox evidence for
commands no rule already describes. That is openai/gpt-oss-120b by default,
called through your own OpenRouter key:
raytrace key openrouter
The same OpenRouter key also runs Chain of thought's cause proposals
(qwen/qwen3-coder) and the run recap (anthropic/claude-sonnet-5.5). Those
recaps are a reading of the run, not a measurement, and they are not allowed to
state a percentage. Calls are billed to your TypeSafe and OpenRouter accounts.
Nothing is sent until you open a view that needs it, and answers are kept, so
opening the same prompt again is free. What's sent goes to TypeSafe or
OpenRouter, not to RayTrace. raytrace key shows which keys are set;raytrace key openrouter --remove (or typesafe) removes one.
You can pick different models in ~/.raytrace/config.env:RAYTACE_OBSERVER_MODEL (recap), RAYTACE_ATTRIBUTION_MODEL (Chain of thought
proposals), RAYTACE_SUMMARY_MODEL (summaries), or RAYTACE_TYPESAFE_MODEL
(Jev). Then raytrace stop && raytrace start.
Other known limits:
- Windows is experimental; RayTrace doesn't download Lima there.
- In local sandboxes, Codex prompts don't reach the Prompts page yet.
Commands, file changes and network connections are already recorded. - Cloud sandboxes are a preview.
Privacy
- Local sandboxes keep everything on your machine, in
~/.raytrace, readable
only by you. The local dashboard's API needs the token in~/.raytrace/api-token, so other accounts on the machine can't read your
traces. Opening the dashboard signs your browser in with a one-time link. - Cloud sandboxes upload your project (what is uploaded)
and record prompts, model requests and answers, tool calls and commands on
RayTrace's servers. Members of your organization can see them; other
organizations can't. - Your sign-in is kept in the macOS Keychain or the Linux secret service (or a
file only you can read where neither exists).raytrace auth logoutremoves
it. Cloud commands ask you to sign in again after 2 days without cloud use.
Command reference, troubleshooting, uninstall
- Command reference
- Troubleshooting and uninstall
- Set up in your editor (MCP)
- Dashboard
- Cloud sandboxes
- Contributing
License
MIT
Reviews (0)
Sign in to leave a review.
Leave a reviewNo results found