echolot
Health Uyari
- License — License: Apache-2.0
- Description — Repository has a description
- Active repo — Last push 0 days ago
- Low visibility — Only 9 GitHub stars
Code Basarisiz
- rm -rf — Recursive force deletion command in .github/workflows/checks.yml
Permissions Gecti
- Permissions — No dangerous permissions requested
Bu listing icin henuz AI raporu yok.
Turns a huge Android trace into 20 rows of facts an AI agent can actually use

Turns a huge Android trace into 20 rows of facts an AI agent can actually use.







- Finds the line to fix. From a slow screen to a file and line, with the
numbers that prove it. - Same answer, every run. A pinned
trace_processor: the same trace always
gives the same report. - No tracing code needed. Works on apps with zero
trace {}calls; it
places temporary markers itself. - Works with your agent. A plugin for Claude Code and Codex; Cursor and
others viaecholot guide.
Quick start
pipx install echolot
Then the plugin, for the agent you use:
# Claude Code
claude plugin marketplace add grishan0v/echolot
claude plugin install echolot@echolot

# Codex
codex plugin marketplace add grishan0v/echolot
codex plugin add echolot@echolot
Open the agent in your Android project and say what is wrong:
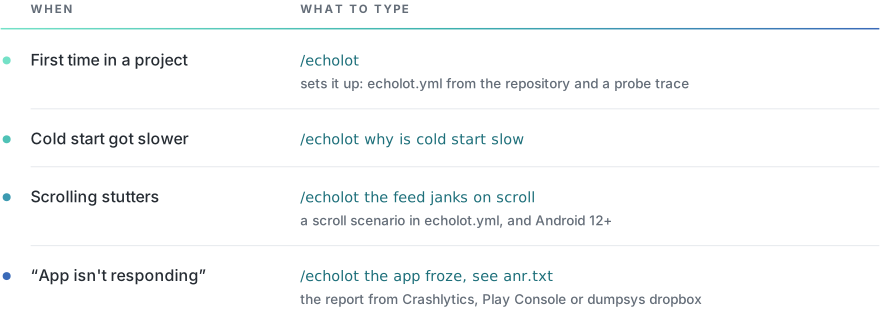
With the plugin, the command is /echolot:echolot in Claude Code and$echolot in Codex. Without it, echolot init puts /echolot into the
project's .claude/ and points other agents at echolot guide; see
The agent layer.
Without an agent
# record the scenario five times, and build the report from those traces
echolot collect -c echolot.yml -n 5
echolot analyze .echolot/traces/coldStart_iter*.perfetto-trace -c echolot.yml

# what changed since an earlier report
echolot compare before.json .echolot/out/report.json
In CI, one step after the benchmark analyzes its traces and compares them with
the report the last good run kept:
- uses: grishan0v/[email protected]
  with:
    traces: app/benchmark/build/outputs/**/StartupBenchmark_startup_iter*.perfetto-trace
What it catches
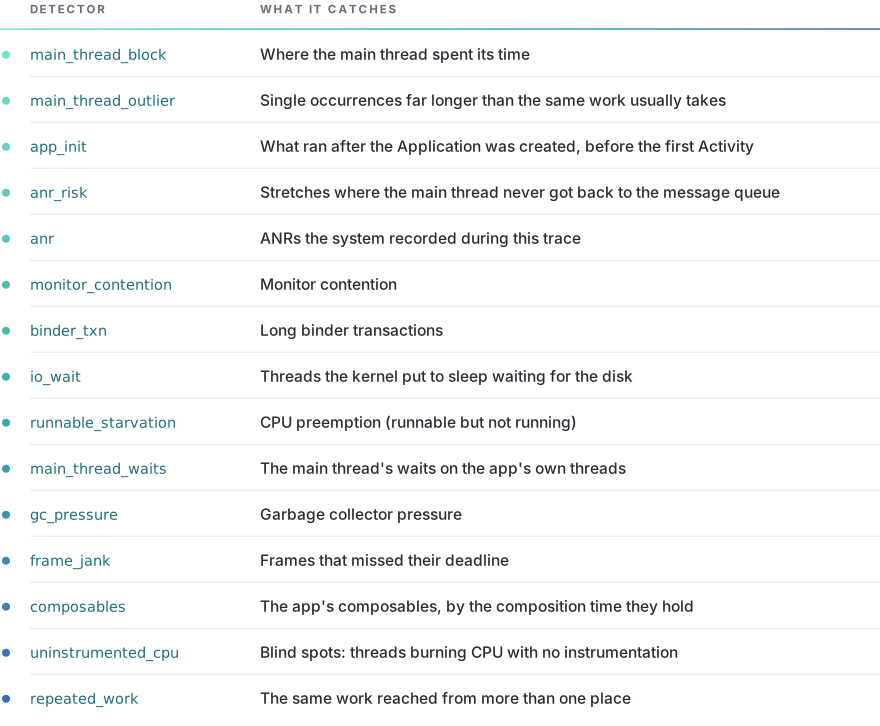
echolot runs fourteen SQL detectors over a Perfetto trace. Each one that finds
something becomes a section of the report:
What you get
report.md for you and report.json for the agent, in .echolot/out/.
An 81 MB trace with 475k slices comes out as a 14 KB report.json in about
five seconds.
# Marker Report

Runs: **5**, numbers are medians across them
Traces: `coldStart_iter000`, `coldStart_iter001`, `coldStart_iter002`, `coldStart_iter003`, `coldStart_iter004`
Scenario: `coldStart`
Process: `com.example.app` (pid 12903)
Scenario window: **1136.05 ms** (from 1084.25 to 1214.18)
Main thread: 40% on a CPU · 1% waiting for a CPU · 9% blocked in the kernel · 49% sleeping
Covered by the findings below: **42%** of the main thread's window, each moment counted once
Startup: cold, **1174 ms** from the launch to the first frame: 42% sleeping · 17% `choreographer_do_frame` · 17% `inflate` · 6% blocked in the kernel · 5% `monitor_contention` · 3% `launch_delay` · 2% `bind_application` · 2% `activity_start`
That is the platform's measure rather than the window: the startup began 38 ms before the window opened, and ended with it.
Device: clock **1478 MHz** (from 1325 to 1574 across repeats), peak 54 °C, 1514 MB free at the low point
Detectors fired: **5 of 14**
Config: `/home/you/my-app/echolot.yml` (sha 3d78738defec) · thresholds: built-in defaults

## Markers
_the names `domains` lists and the `AGENTTMP_` ones; medians per run, self time with children subtracted_

| Marker | Runs | N | Self, ms | Total, ms | Max, ms | Threads |
|---|---|---|---|---|---|---|
| collection_load | 5/5 | 1 | 923.8 | 923.8 | 923.8 | (async) |
| collection_mapping | 5/5 | 1 | 96.0 | 118.3 | 118.3 | arch_disk_io_1 |

## Frames that missed their deadline
_the platform classifies every frame itself, and says whose fault it was. The only detector that answers "which frames stuttered" rather than "where did the total go" — and it needs no instrumentation in the app at all._

| Where | Runs | N | Total, ms | Max, ms | Evidence |
|---|---|---|---|---|---|
| App Deadline Missed | 5/5 | 4 | 427.51 | 130.89 | Self Jank · 4 of 19 frames · longest 188.7 ms |

<sub>detector `frame_jank`, params: {'min_frames': 3, 'min_overrun_ms': 4}</sub>

## Where the main thread spent its time
_measured as SELF time, children subtracted — otherwise one event lands in the report several times at different depths and the agent counts it twice_

| Where | Runs | N | Self, ms | Total, ms | Max, ms | Evidence |
|---|---|---|---|---|---|---|
| inflate | 5/5 | 15 | 222.68 | 241.38 | 49.28 | com.example.app |
| draw | 5/5 | 7 | 120.8 | 120.8 | 34.0 | com.example.app |
| TextLayout:initLayout | 5/5 | 51 | 73.95 | 73.95 | 1.45 | com.example.app |
| Lock contention on a monitor lock (owner tid: 12931) | 5/5 | 9 | 61.6 | 61.6 | 22.4 | com.example.app |

<sub>detector `main_thread_block`, params: {'min_slice_ms': 16}</sub>

## Single occurrences far longer than the same work usually takes
_the pair to main_thread_block. That one asks where the main thread's time went in total; this one asks which single occurrence was out of line with its own history. A heavy tail hides from every sum._

| Where | Runs | N | Total, ms | Max, ms | Evidence |
|---|---|---|---|---|---|
| inflate | 2/5 | 1 | 86.2 | 86.2 | median 12.1 ms of 15 · worst 7.1× |

<sub>detector `main_thread_outlier`, params: {'factor': 4, 'min_abs_ms': 40, 'min_occurrences': 5}</sub>

## Monitor contention
_ART writes a "Lock contention on ..." slice with the owner's tid — ready-made evidence_

| Where | Runs | N | Total, ms | Max, ms | In the code | Evidence |
|---|---|---|---|---|---|---|
| com.example.app | 5/5 | 9 | 61.6 | 22.4 | owner at StoreRepository.kt:30 · blocked at StoreRepository.kt:61 | monitor contention with owner DefaultDispatcher-worker-3 (12931) at void com.example.app.data.StoreRepository.update(com.example.app.data.Item)(StoreRepository.kt:30) waiters=0 blocking from com.example.app.data.Item com.example.app.data.StoreRepository.find(long)(StoreRepository.kt:61) |

<sub>detector `monitor_contention`, params: {'min_block_ms': 8, 'max_total_ms': 50, 'name_glob': 'Lock contention on a monitor lock*', 'name_glob_alt': 'monitor contention with owner*'}</sub>

## Blind spots: threads burning CPU with no instrumentation
_names a thread that burns CPU with no slice around it. The agent does not guess — it is handed the fact "thread T ran for 340 ms, zero slices". That is exactly where adding trace{} pays off._

| Where | Runs | N | Total, ms | Instrumented, ms | Evidence |
|---|---|---|---|---|---|
| DefaultDispatch | 5/5 | 0 | 522.09 | 0.0 | 100.0% of CPU outside slices |

<sub>detector `uninstrumented_cpu`, params: {'min_running_ms': 50, 'max_covered_pct': 50}</sub>

**Silent:** anr, anr_risk, app_init, binder_txn, composables, gc_pressure, io_wait, repeated_work, runnable_starvation

<sub>trace_processor v56.1</sub>
What analyze prints for the demo that comes with echolot: five cold starts
of an app that does not exist, built by code.
Requirements
- Python 3.10 or newer, with
adbandcurlonPATH - a phone or emulator with USB debugging on; Android 12+ for
frame_jank - git 2.36 or newer, for Claude Code to install the plugin
The first command that needs trace_processor downloads it once: 10–14 MB,
checked against its SHA-256. Offline or behind a proxy, see
Determinism.
Documentation
grishan0v.github.io/echolot, or the
same pages on GitHub:
Collecting ·
ANRs ·
Marking ·
Analysing ·
Comparing ·
Calibrating ·
Determinism ·
The agent layer ·
Detectors ·
Reflect
License
Yorumlar (0)
Yorum birakmak icin giris yap.
Yorum birakSonuc bulunamadi