dashboard-for-claude-code
Health Uyari
- License — License: MIT
- Description — Repository has a description
- Active repo — Last push 0 days ago
- Low visibility — Only 6 GitHub stars
Code Gecti
- Code scan — Scanned 12 files during light audit, no dangerous patterns found
Permissions Gecti
- Permissions — No dangerous permissions requested
Bu listing icin henuz AI raporu yok.
A local, read-only web dashboard for your Claude Code session logs — track API cost, token usage by model, tool & skill usage, and activity patterns, all on your machine.
Claude Code Personal Analytics
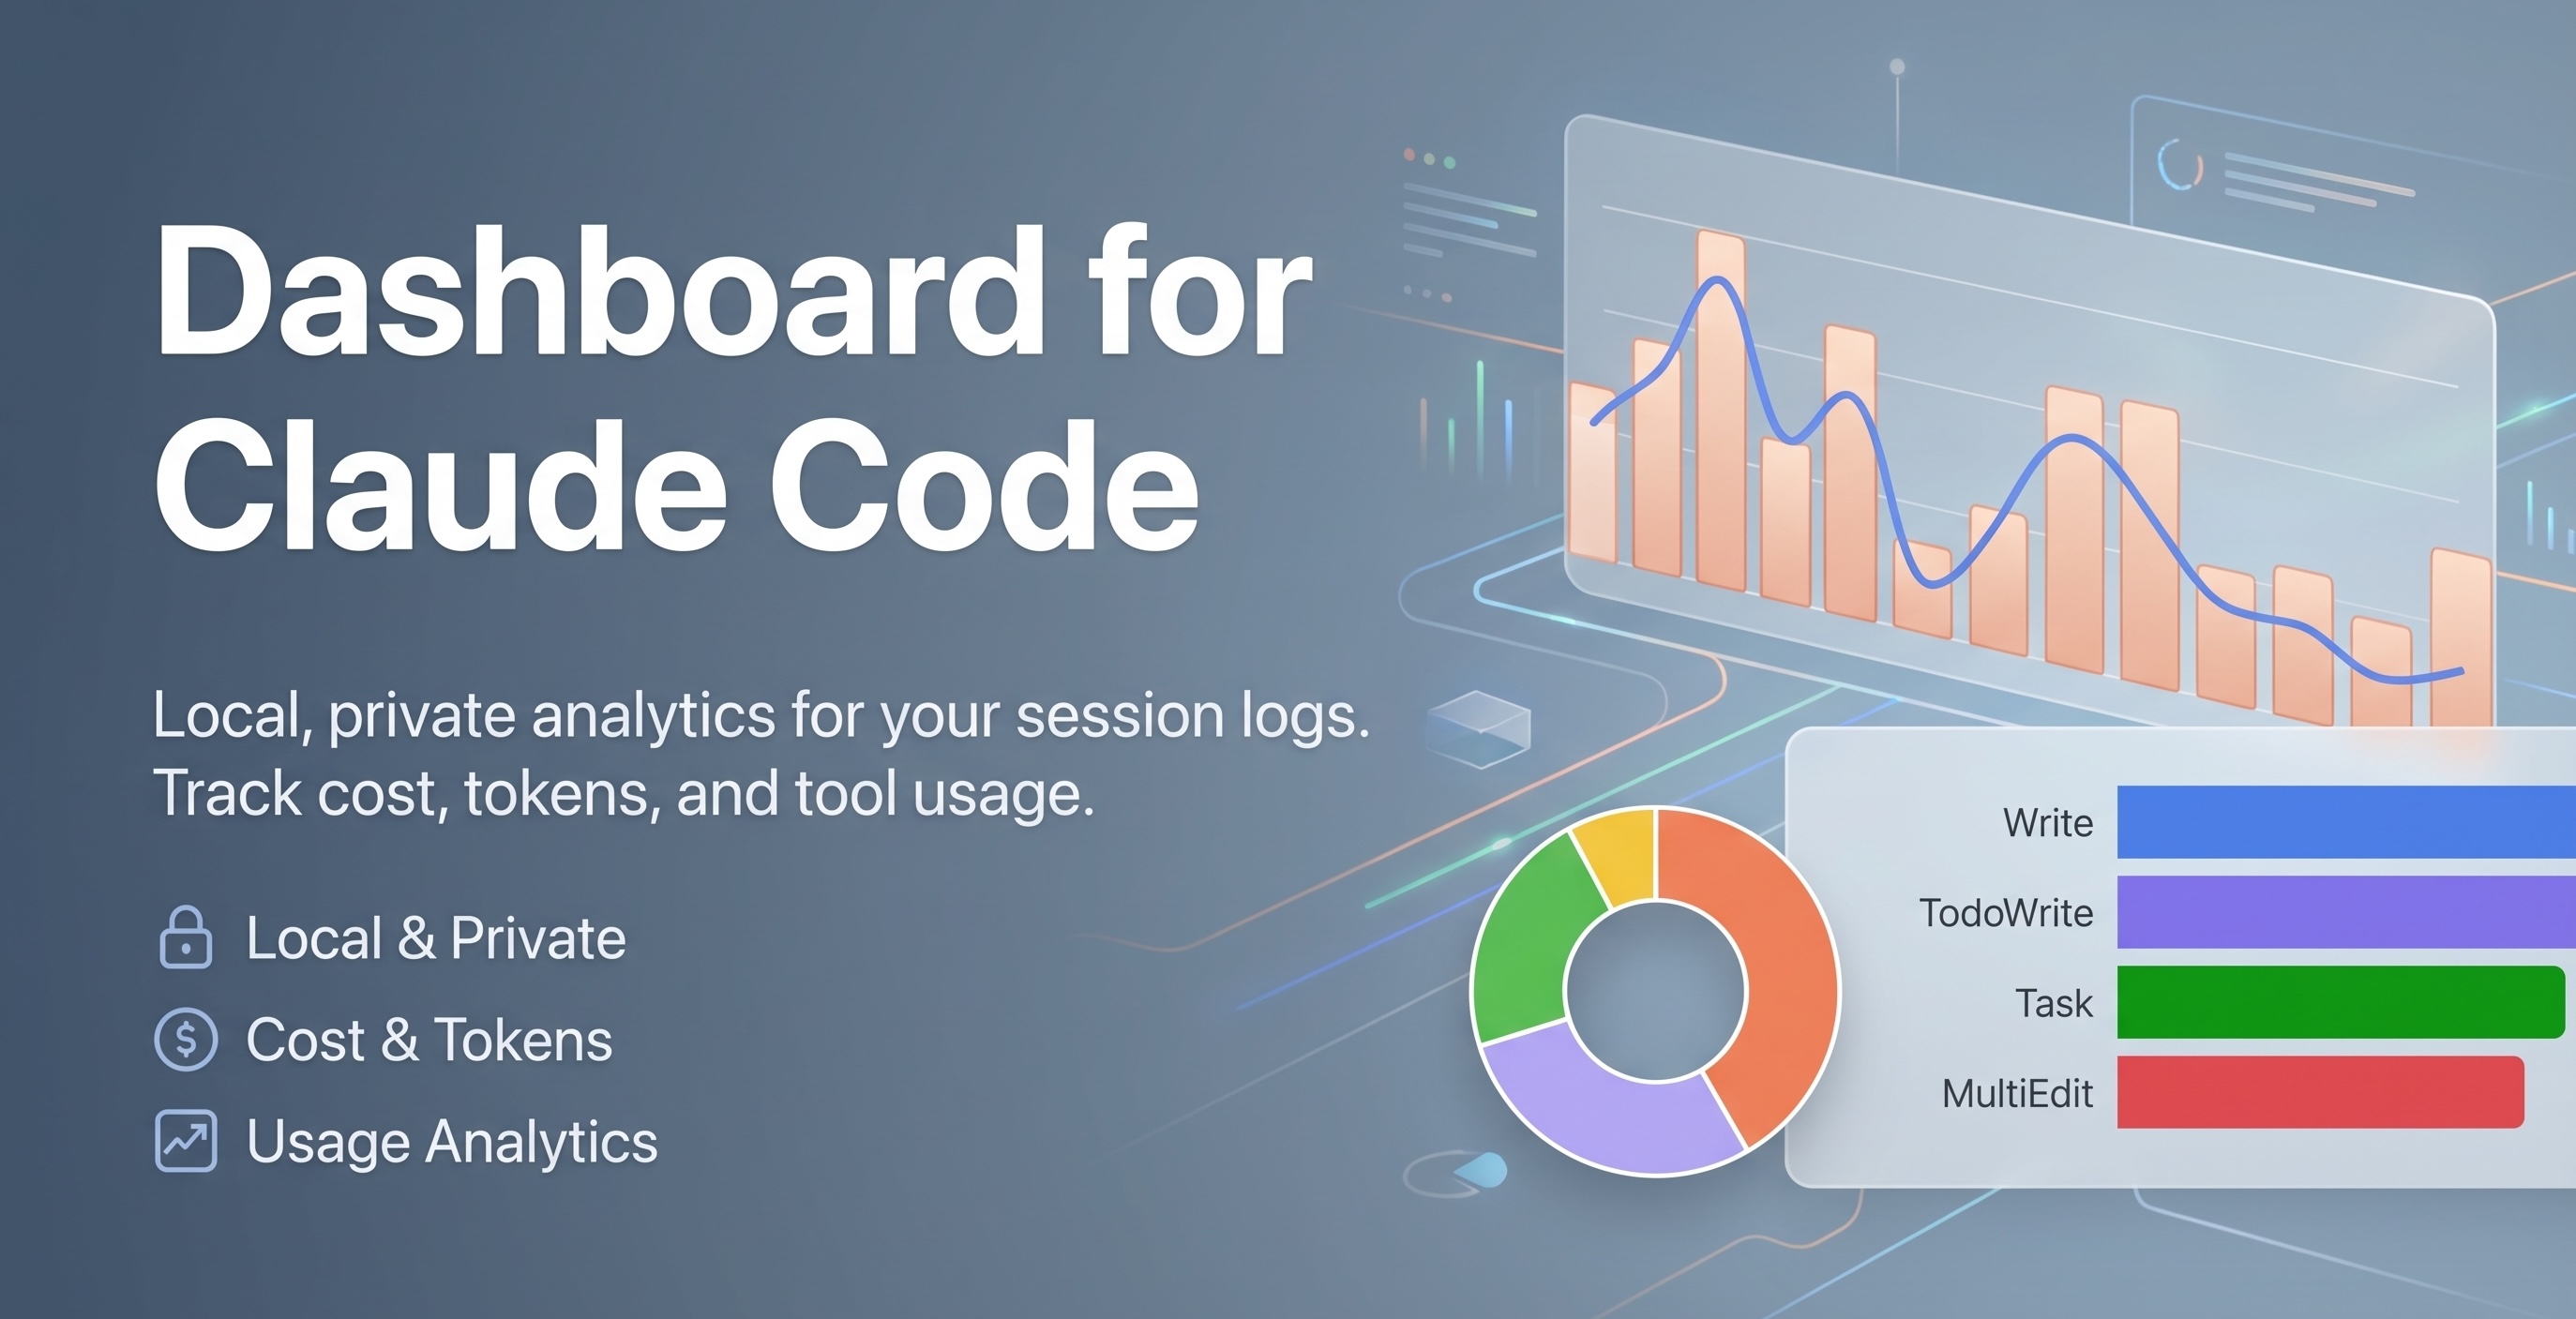
See how you actually use Claude Code. A private, local analytics dashboard for your sessions, costs, tools, skills, coding patterns — and wasted effort.
Your Claude Code usage tells a story. This dashboard makes it visible.
Everything runs on your machine. Your session logs are read-only — never modified and never leaving your computer unless you explicitly choose to deploy a static export.


Unofficial project. This is a community tool. It is not affiliated with, endorsed by, or sponsored by Anthropic. "Claude" and "Claude Code" are trademarks of Anthropic, PBC; they are used here only to describe what this tool is compatible with. See Trademarks.
What it answers
This isn't usage monitoring — it's personal analytics. Point it at your own history and it answers questions you can't get anywhere else:
- Which projects am I actually spending Claude Code on?
- Which sessions are the most expensive?
- When do I use it most (time of day, day of week)?
- Which tools and skills are really getting invoked — and which never do?
- Which sessions show high churn, errors, or repeated retries?
- Is my style more supervised or autonomous?
- How large is the compute I'm actually spending on Claude Code?
Quick start (no install)
Run the latest release straight from PyPI — no clone, no virtualenv, nothing left behind:
uvx dashboard-for-claude-code       # with uv  (https://docs.astral.sh/uv/)
pipx run dashboard-for-claude-code  # with pipx
Then open http://localhost:8042. On first run it scans ~/.claude/projects/ (read-only) and caches results under ~/.local/share/dashboard-for-claude-code/ (respects XDG_DATA_HOME), so later runs are instant. Pass flags after the command, e.g. uvx dashboard-for-claude-code --port 9000.
Prefer a persistent install? uv tool install dashboard-for-claude-code or pipx install dashboard-for-claude-code gives you the same dashboard-for-claude-code command on your PATH. To work on the code, see Setup and Run.
Run it with Claude Code
Already using Claude Code? Skip the manual steps — paste this prompt and let it set everything up:
Set up and run this dashboard on my machine — follow the steps in CLAUDE_README.md.
Claude reads CLAUDE_README.md and handles uv sync, starts the server, and opens http://localhost:8042 for you.
Rough cost: about $0.11 per run and ~163K tokens (measured on a sample run with Sonnet 4.6: 10 input / 1.1K output / 150.1K cache read / 12.3K cache write), typically finishing in under a minute. This is only an estimate — actual token usage and cost vary from run to run depending on the model, your environment, and how the steps are worked through.
Prefer to do it by hand? See Setup and Run below.
Screenshots
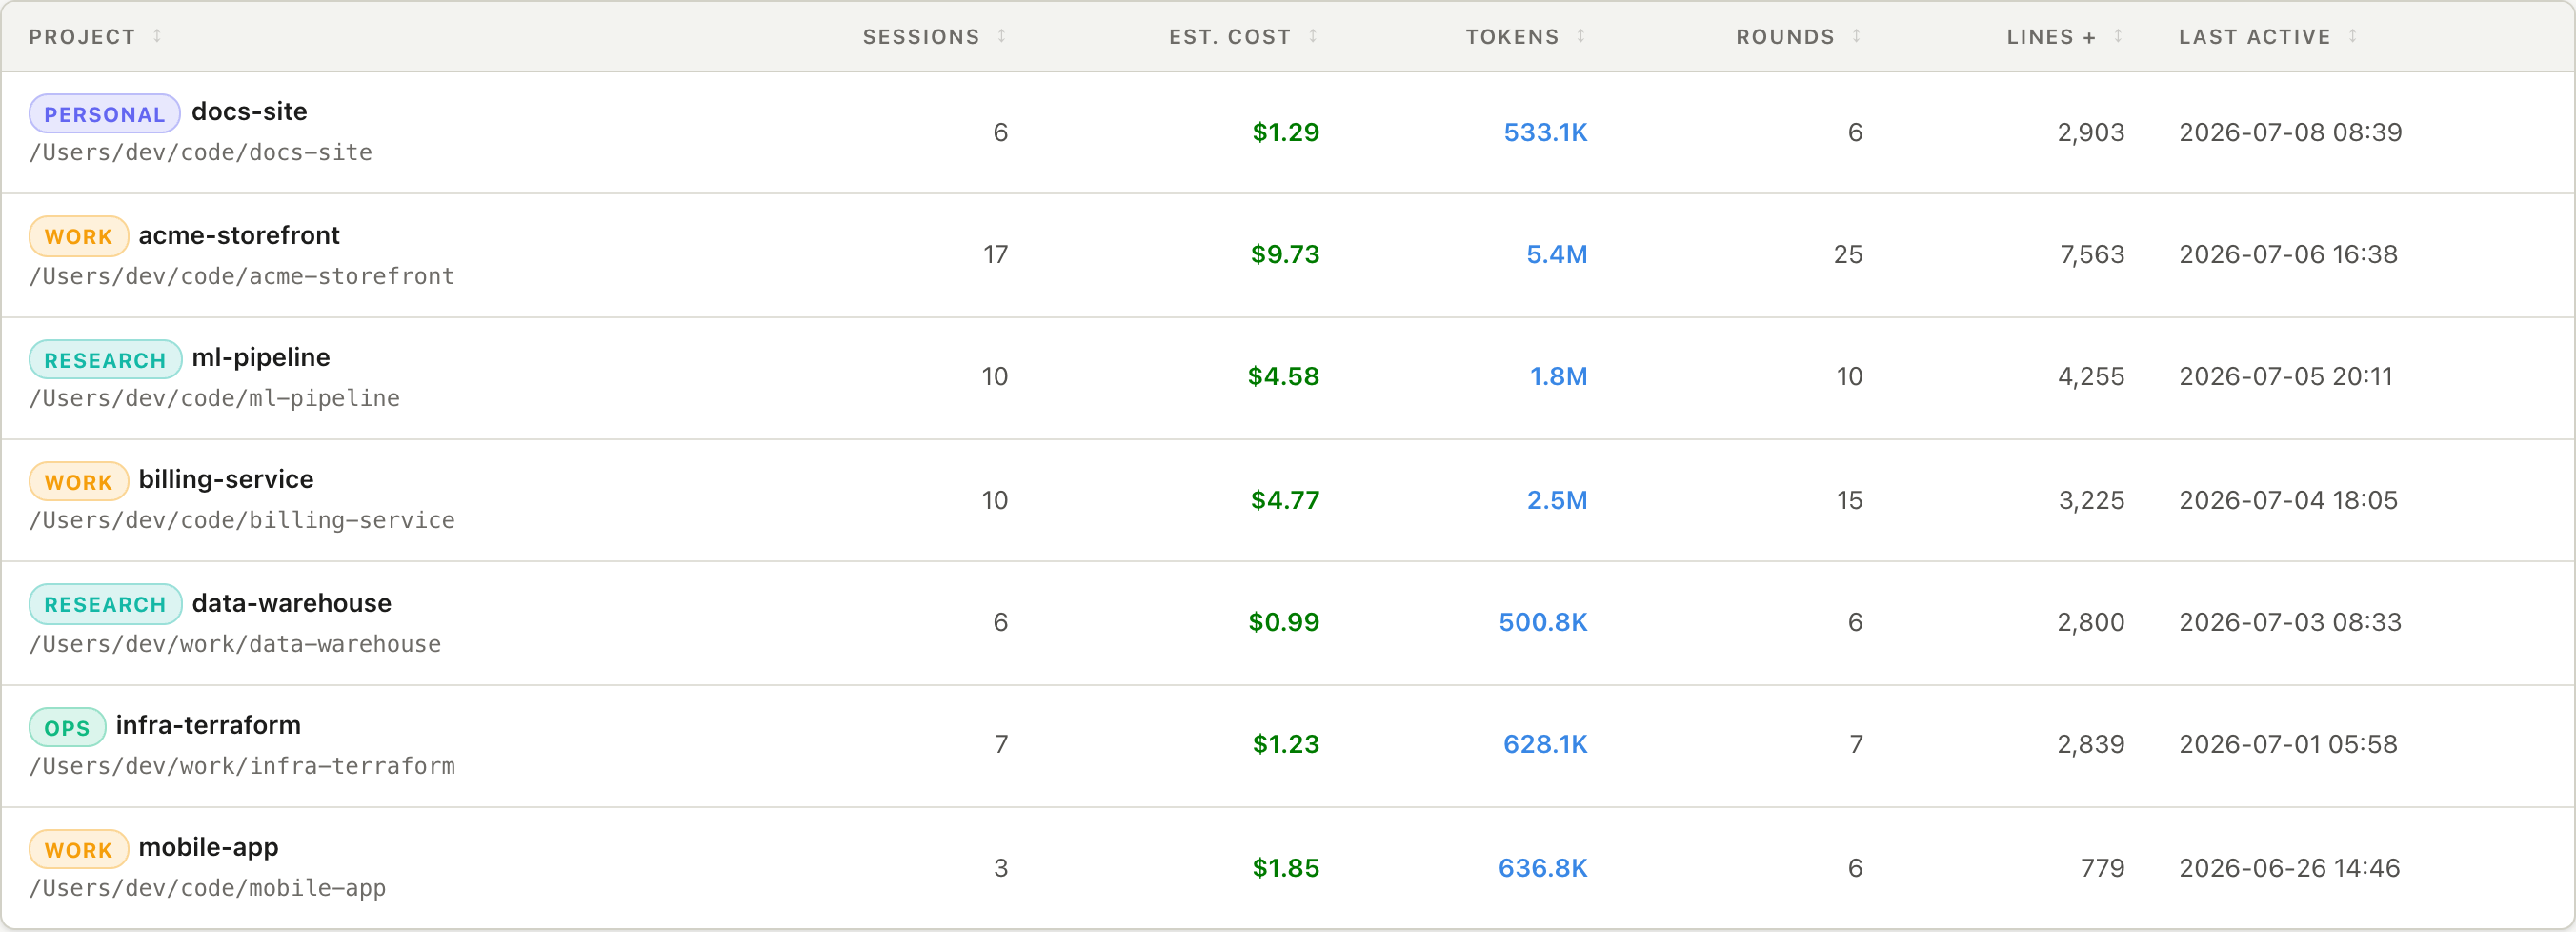
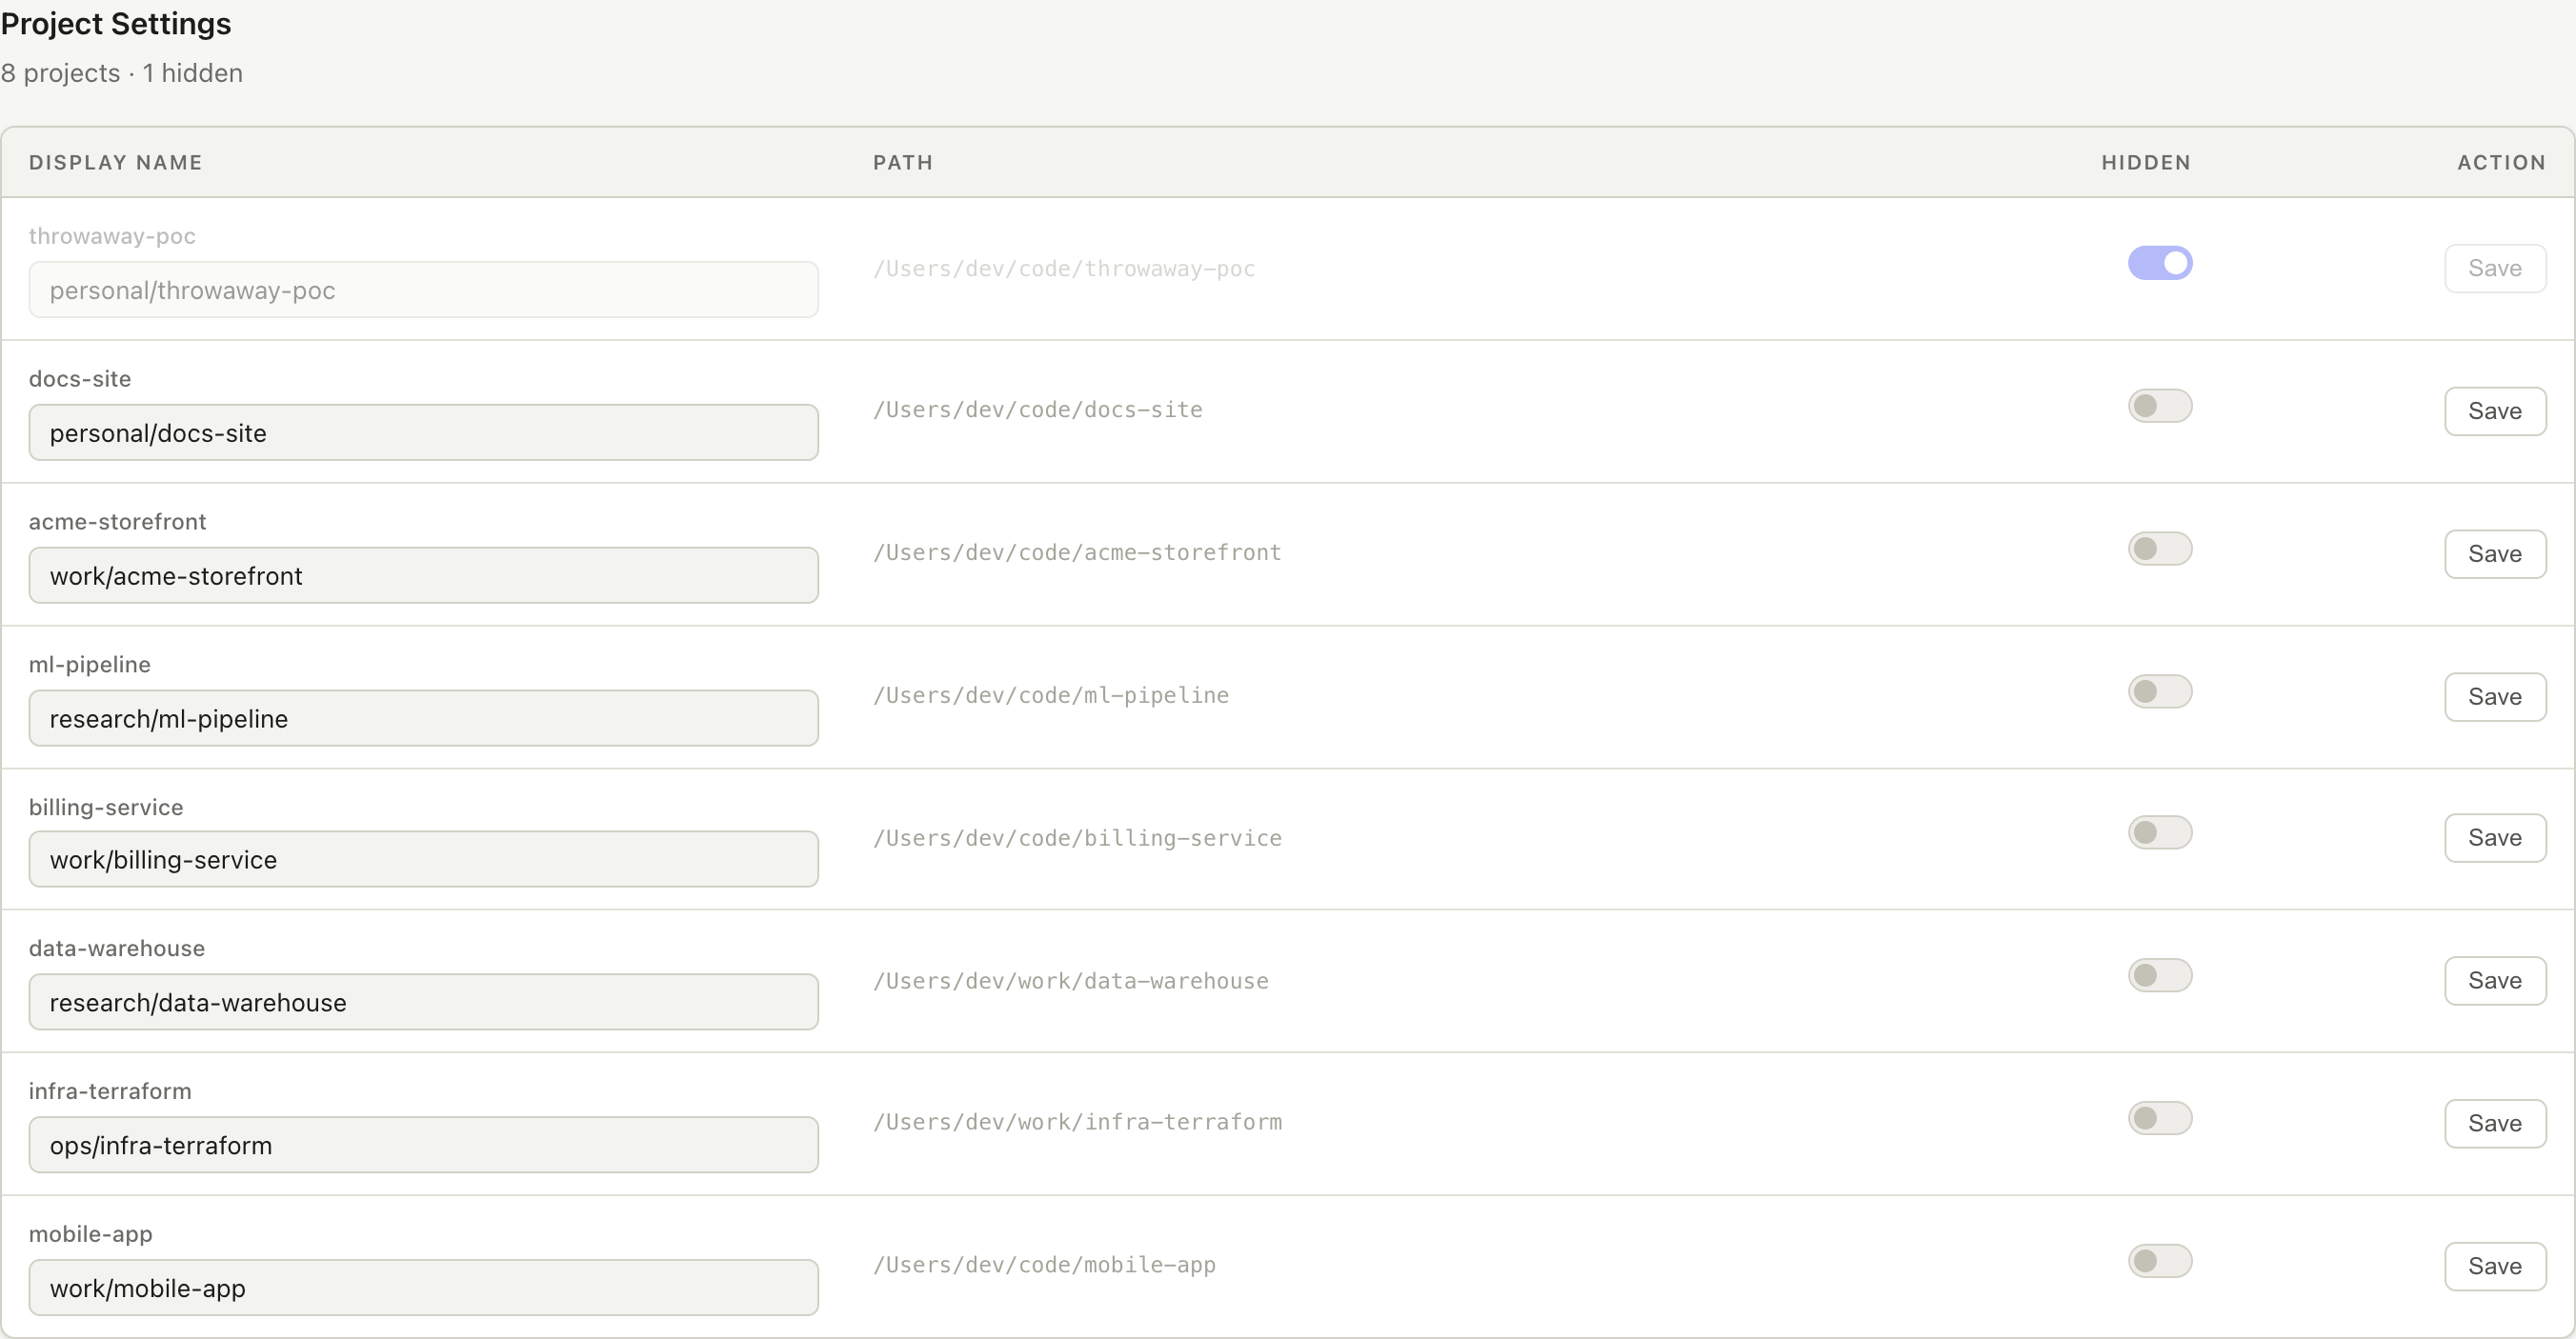
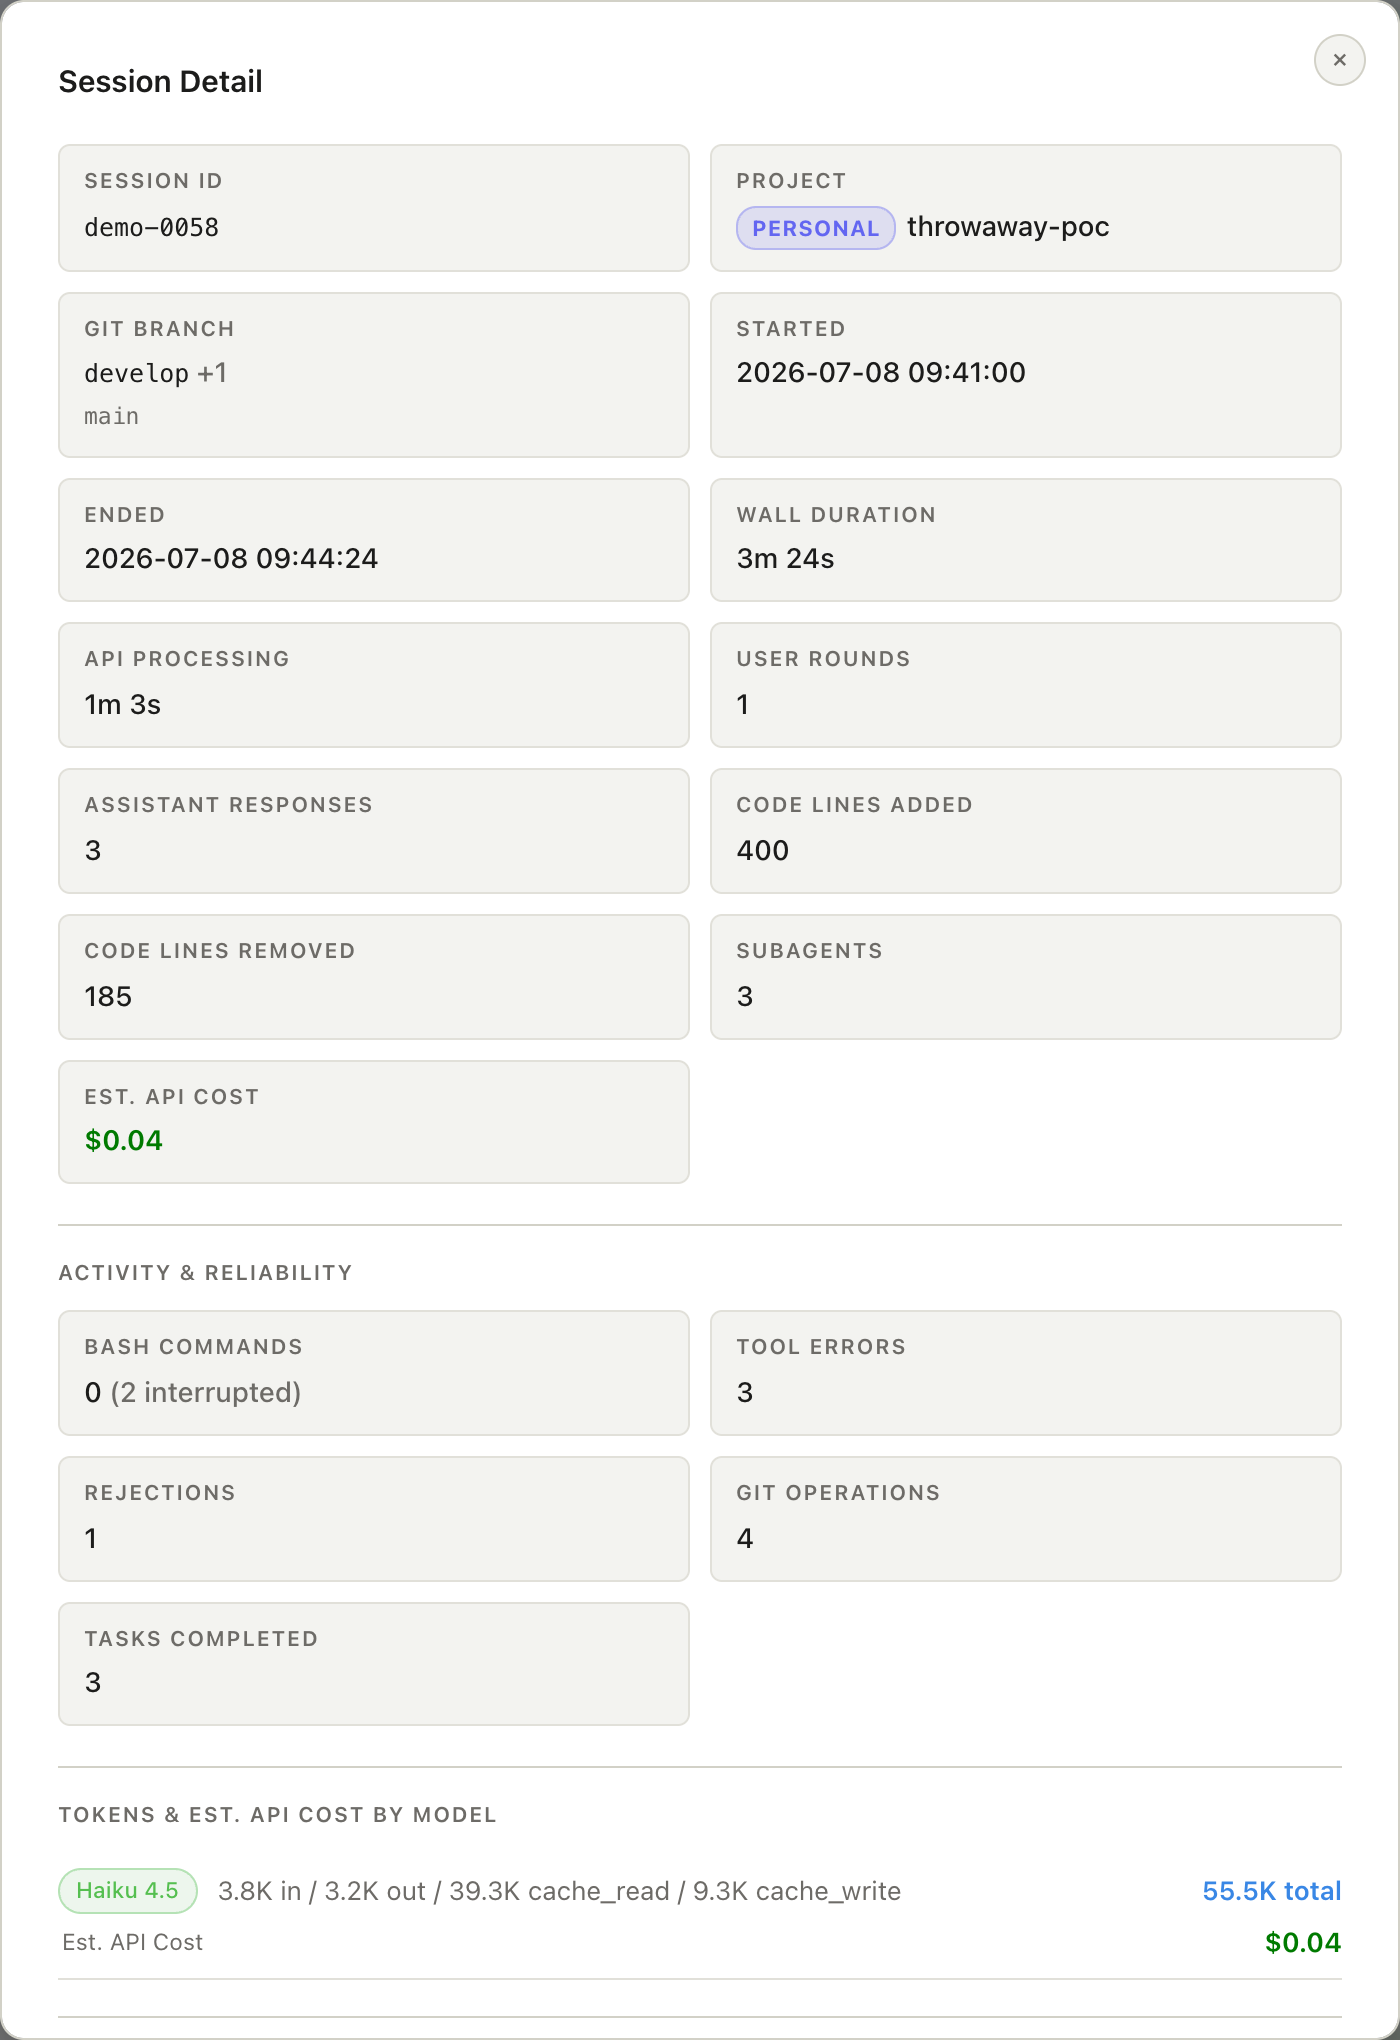
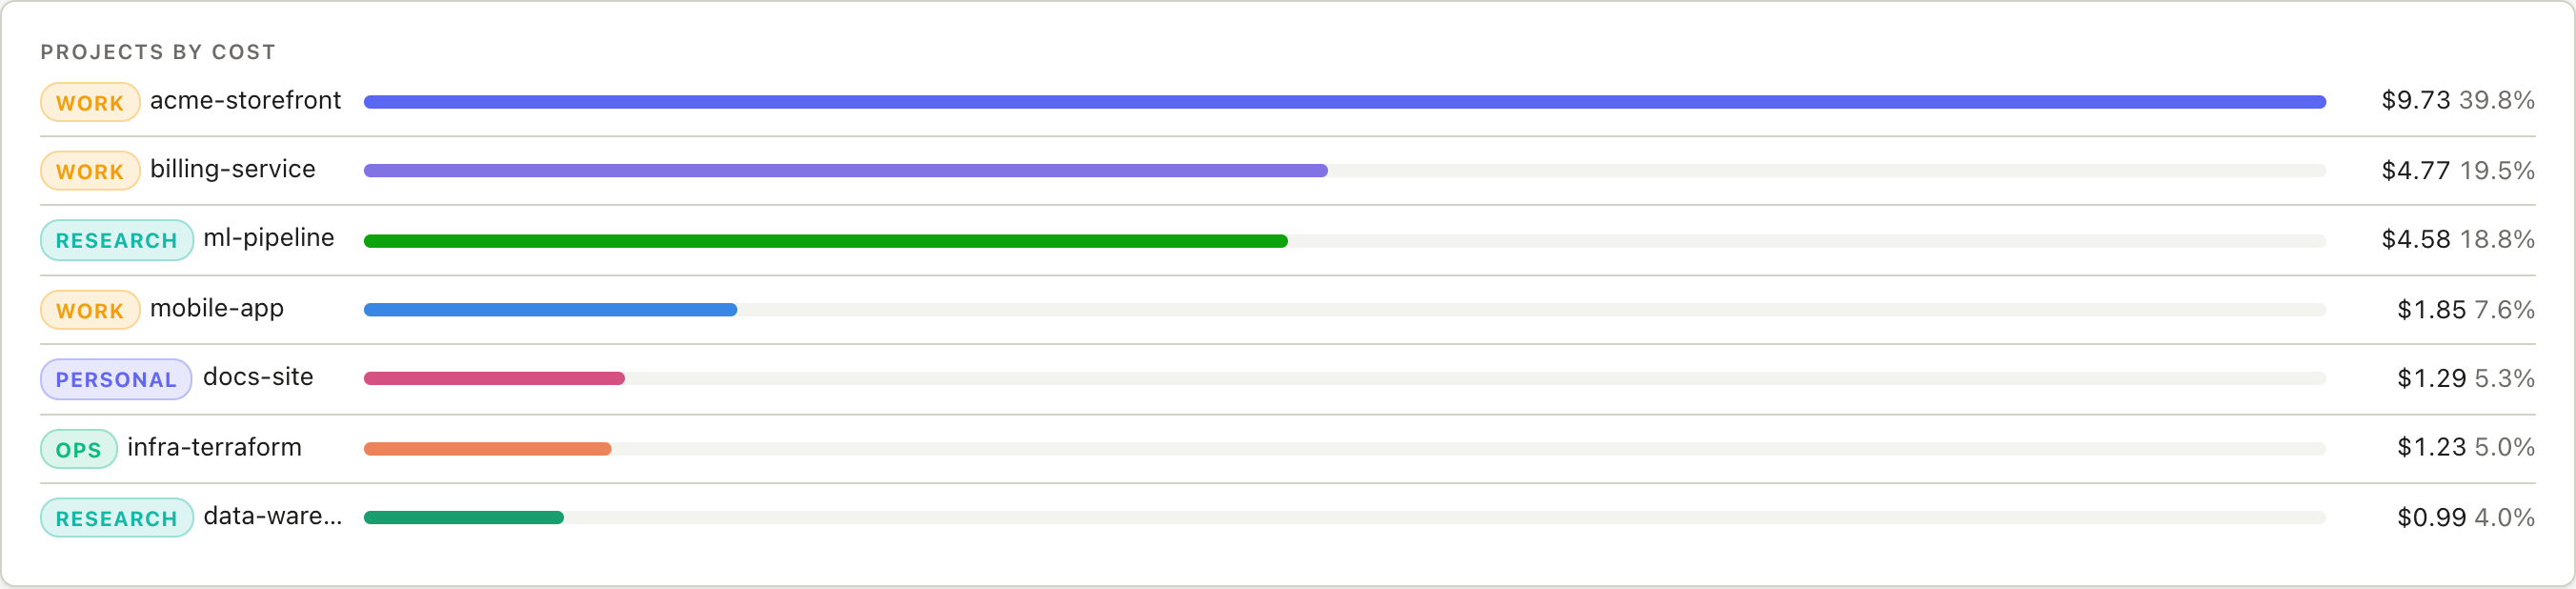
All screenshots show synthetic placeholder data generated by scripts/demo_data.py.
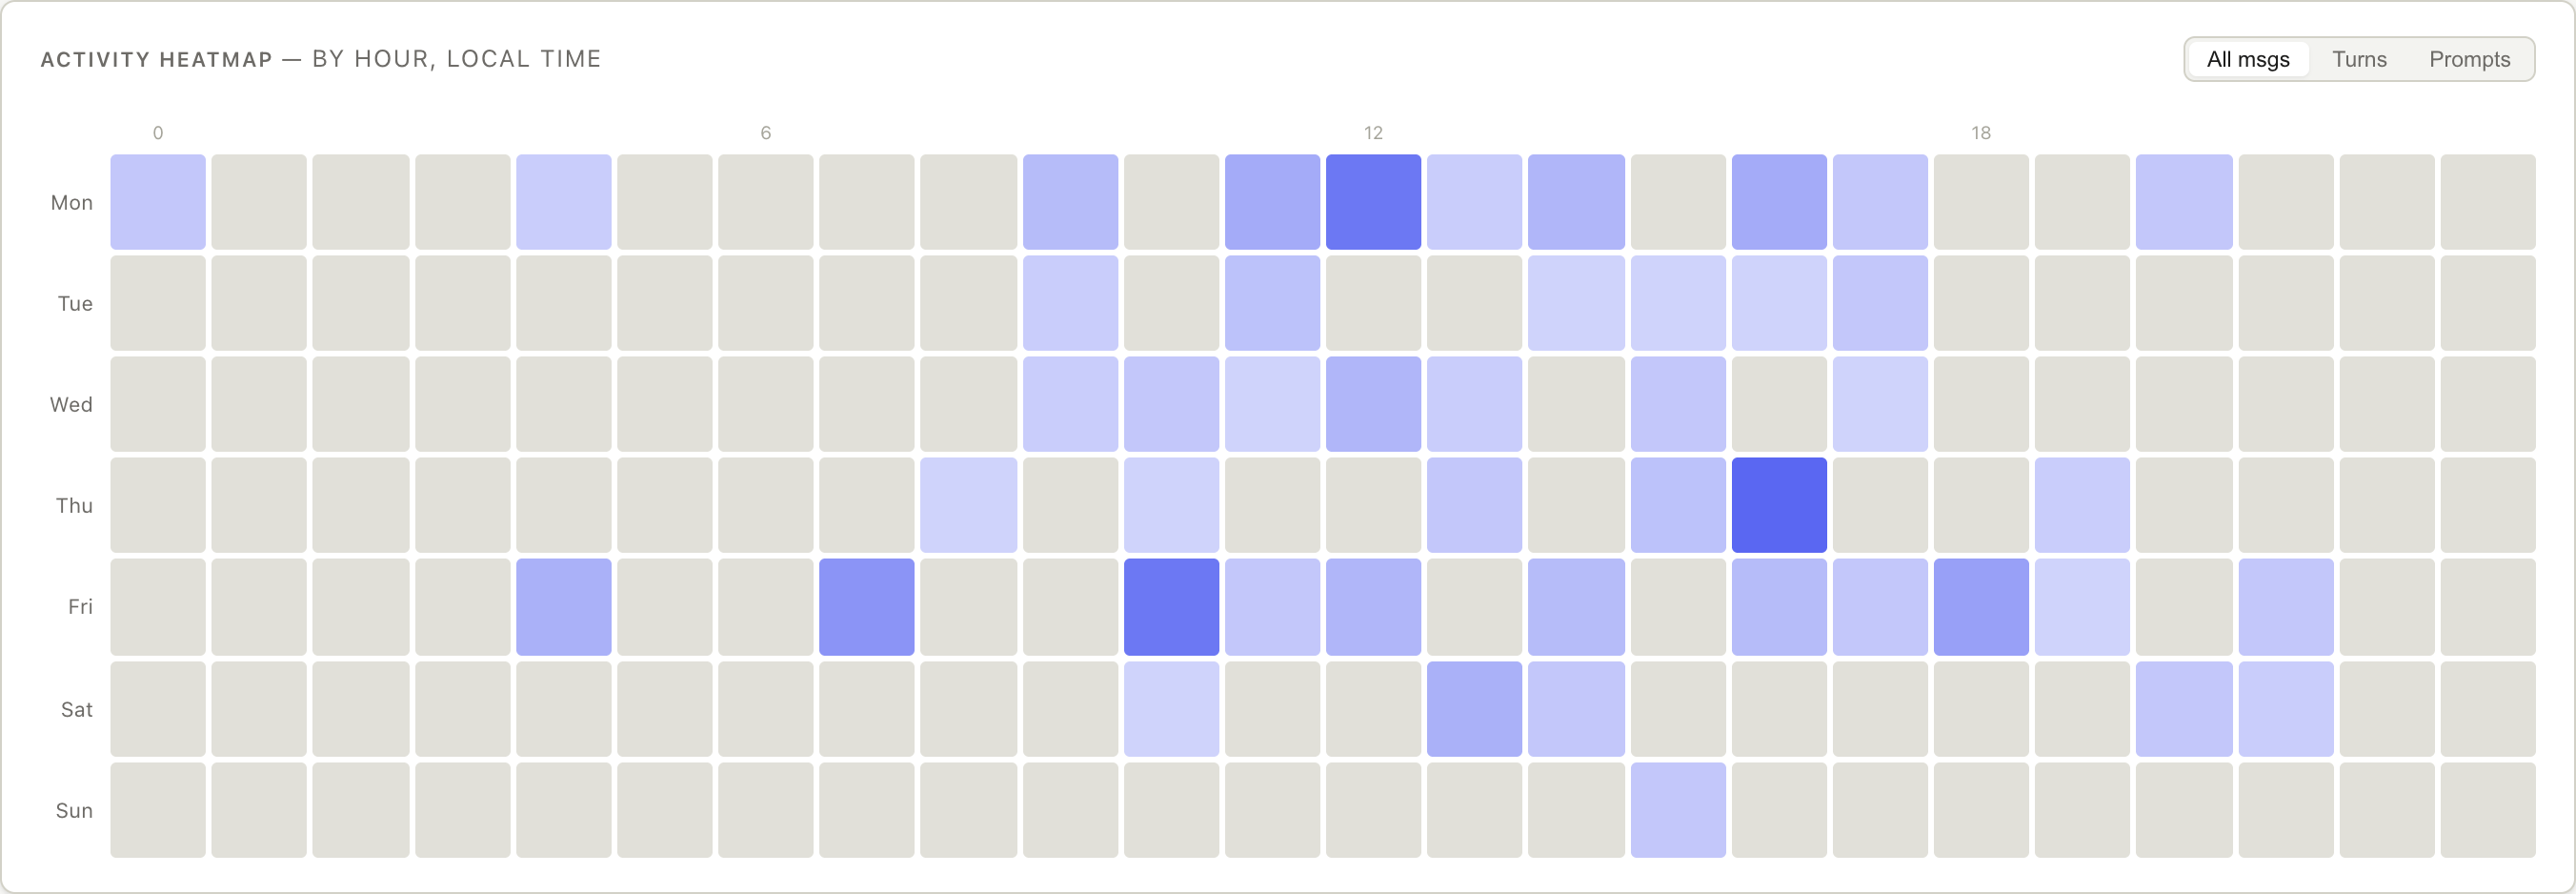
The activity heatmap shows when you actually work (weekday × hour, local time):
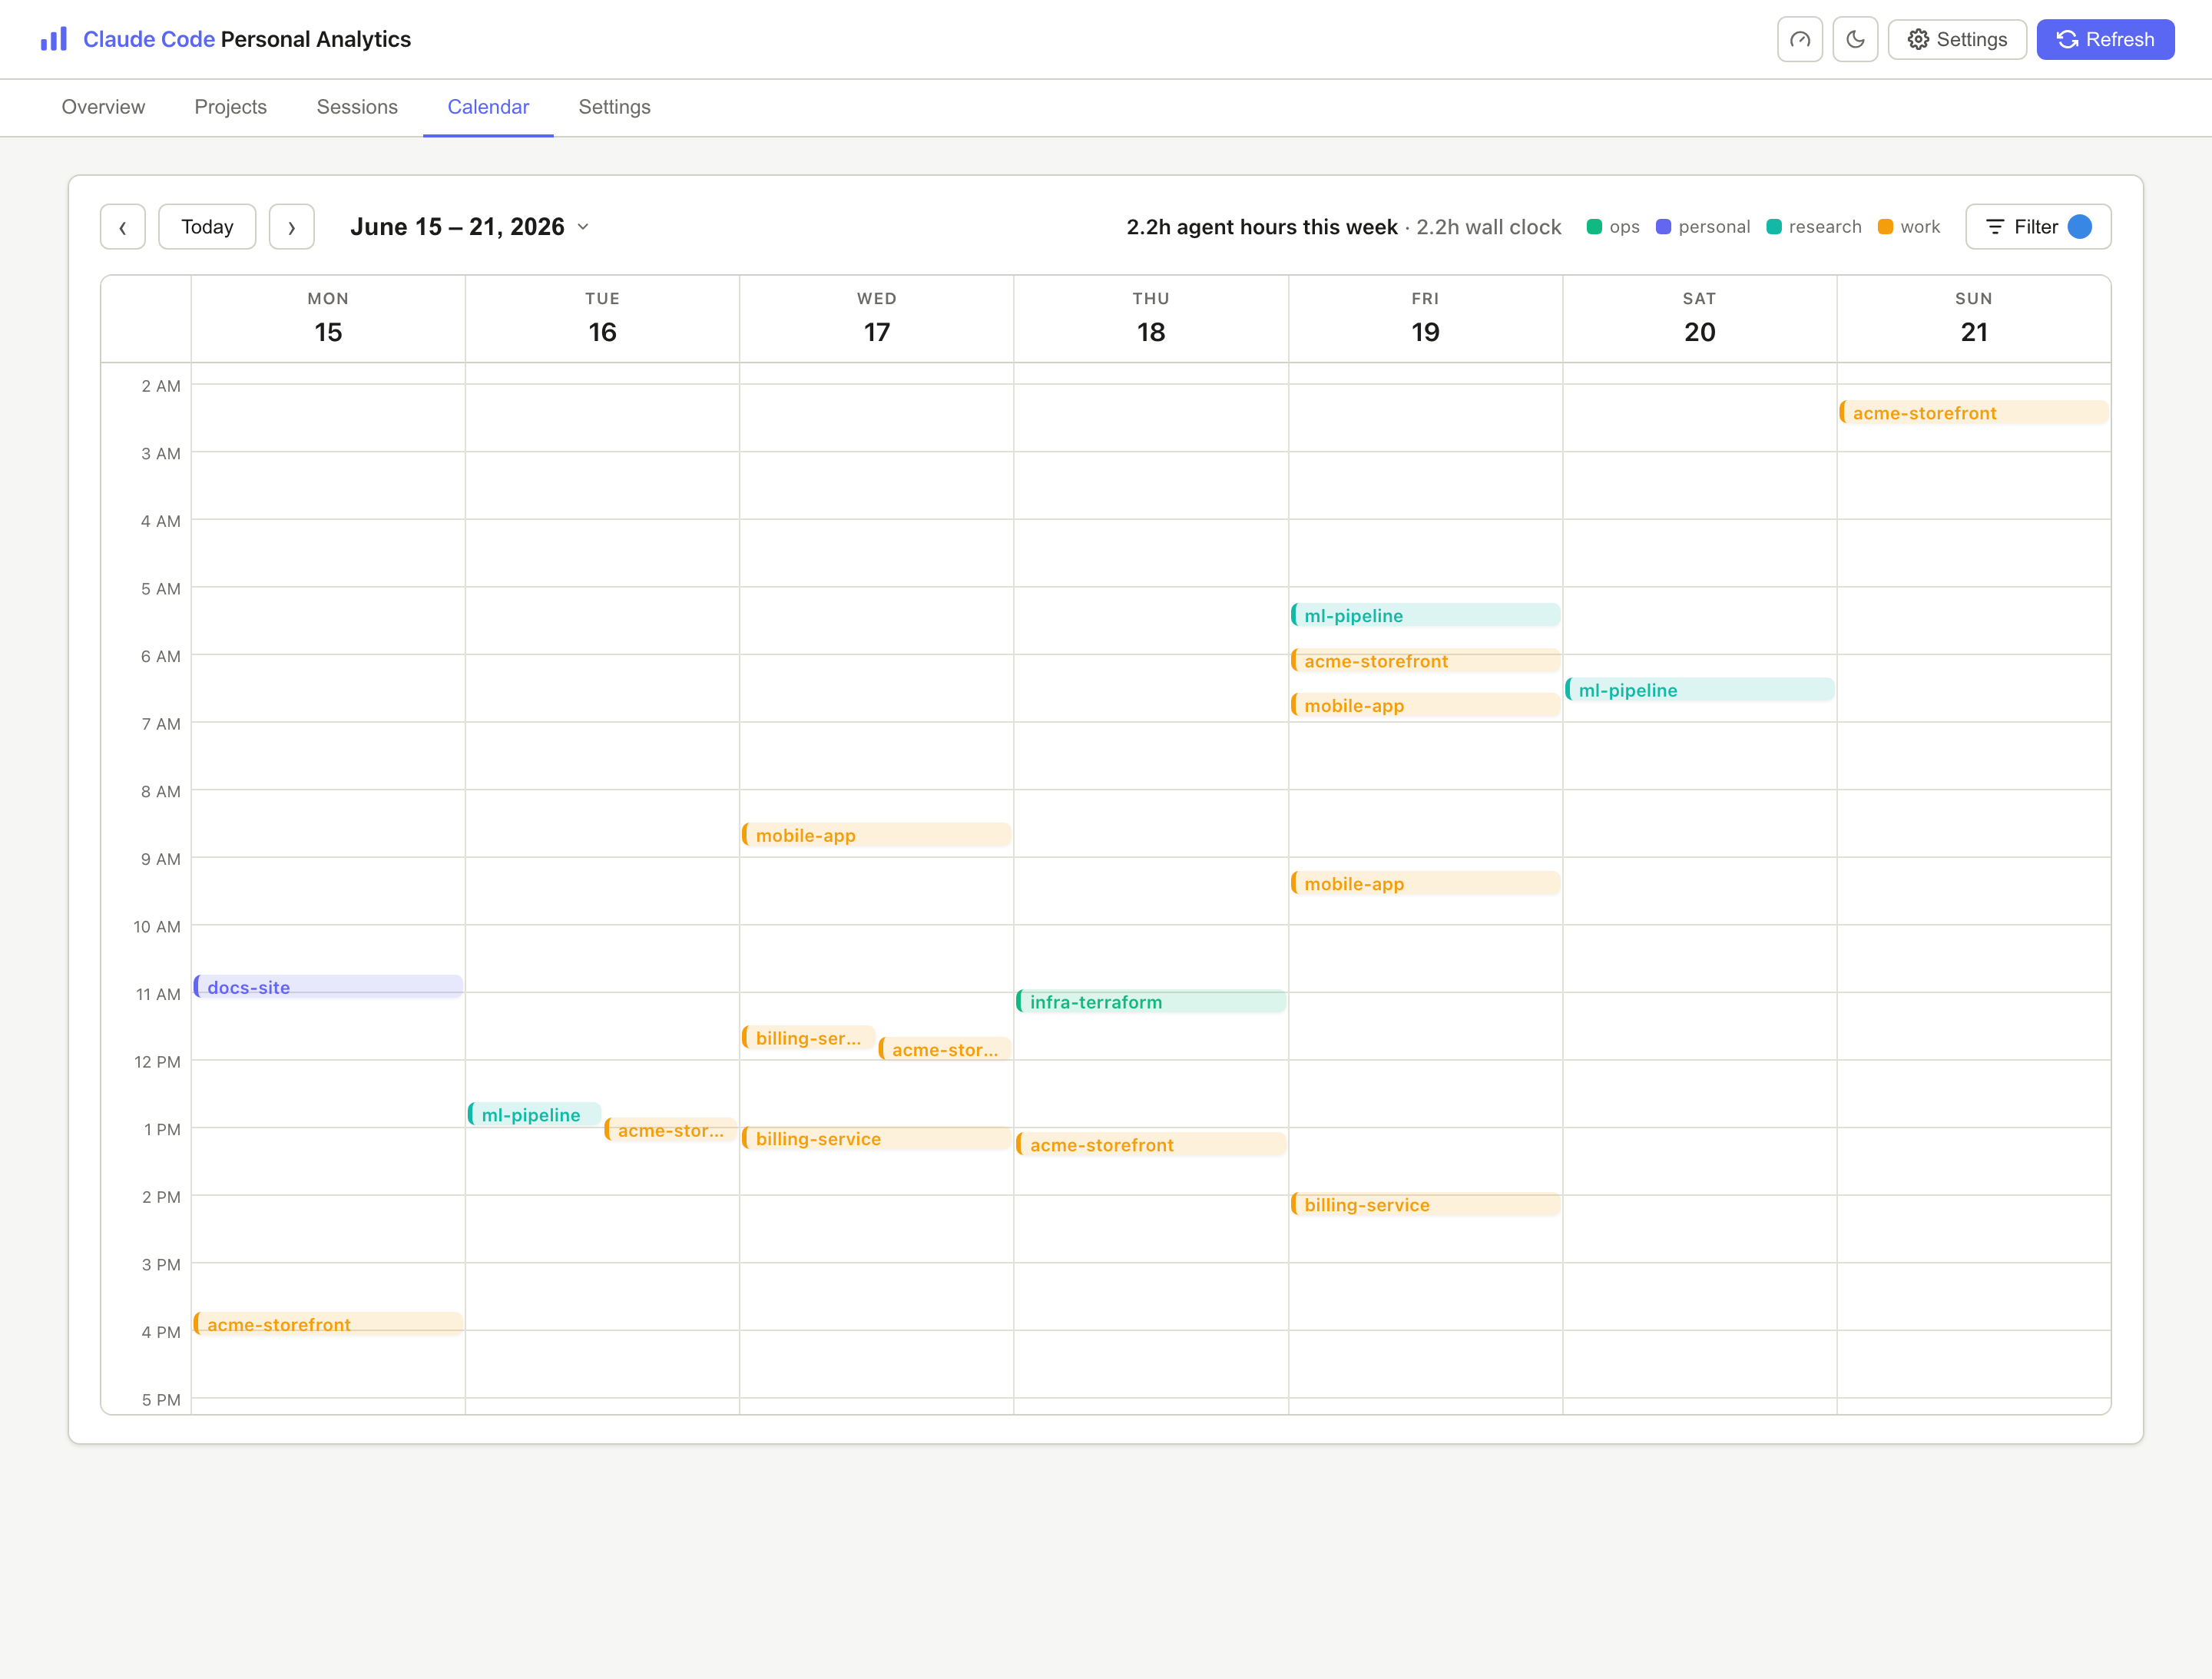
The Calendar lays every session out on a Google-Calendar-style week grid, color-coded by project tag, so you can see how your work actually clusters across days and hours:
Using Claude Code to set this up? See CLAUDE_README.md for step-by-step instructions Claude can follow to install, run, and optionally generate AI session summaries.
Features
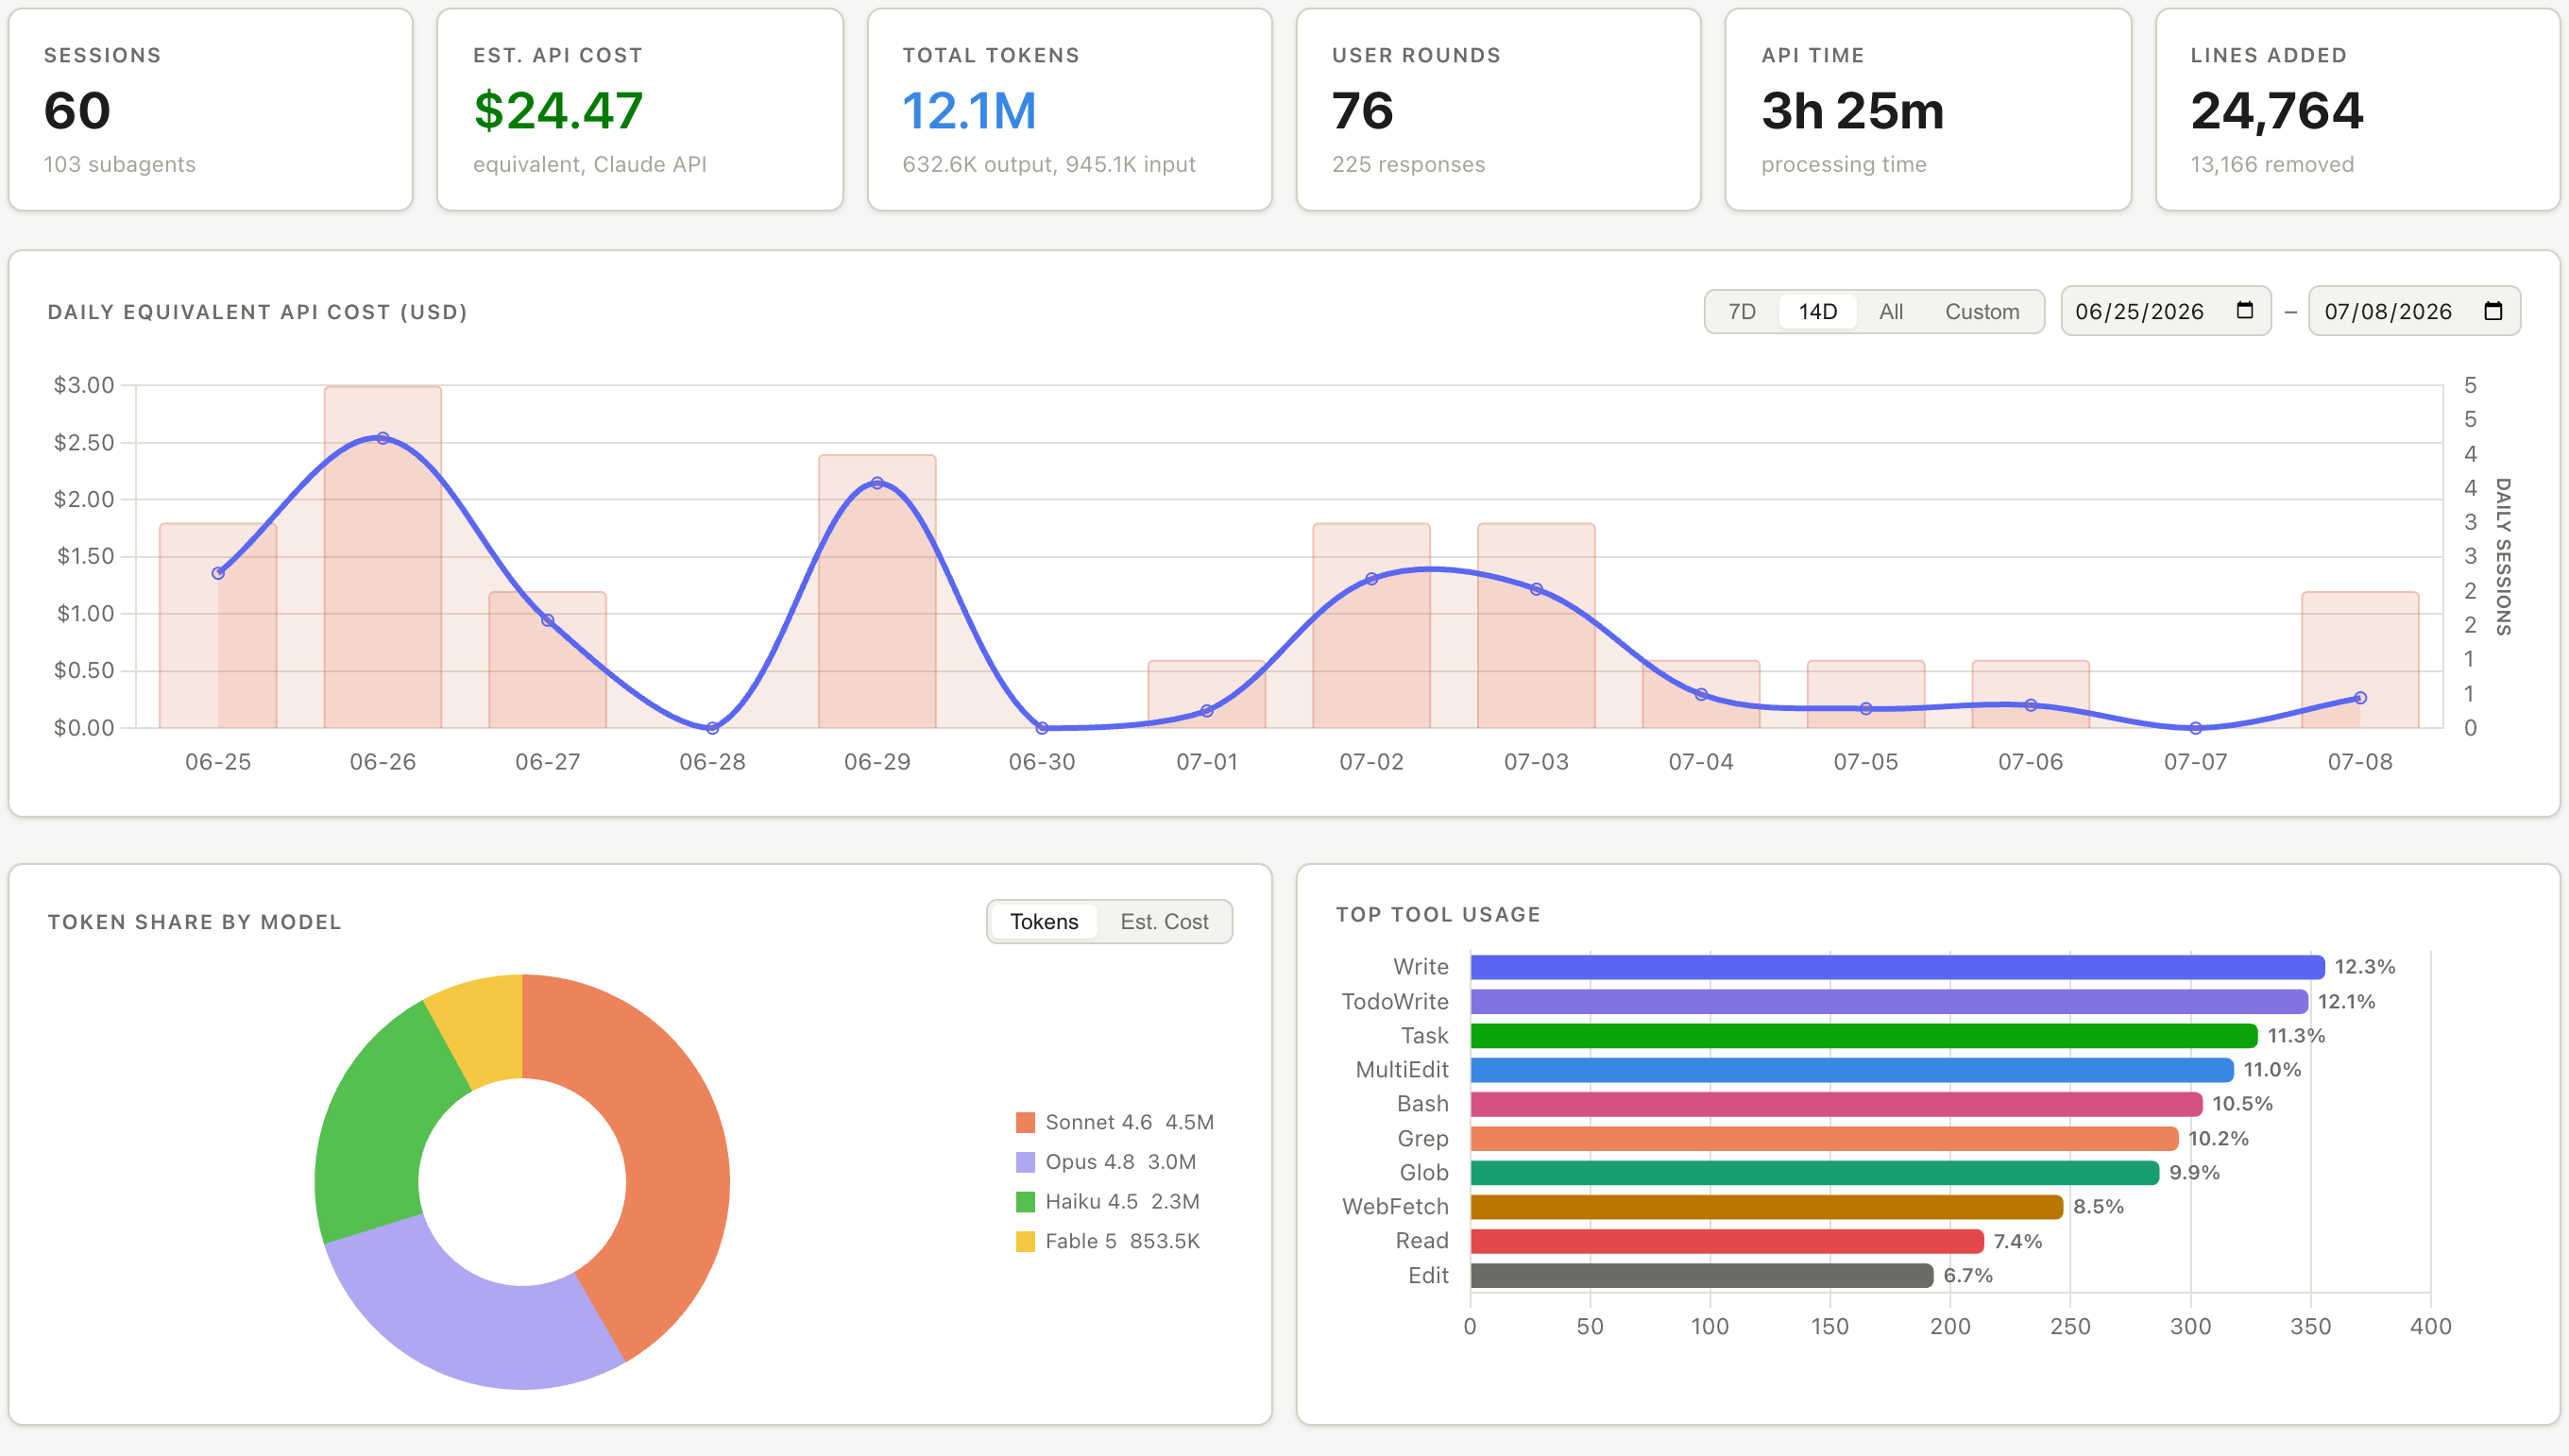
- Overview — headline KPIs (sessions, rounds, lines changed, equivalent cost) plus:
- Daily equivalent-cost chart with 7D / 14D / all / custom ranges
- Token share by model (tokens or estimated cost)
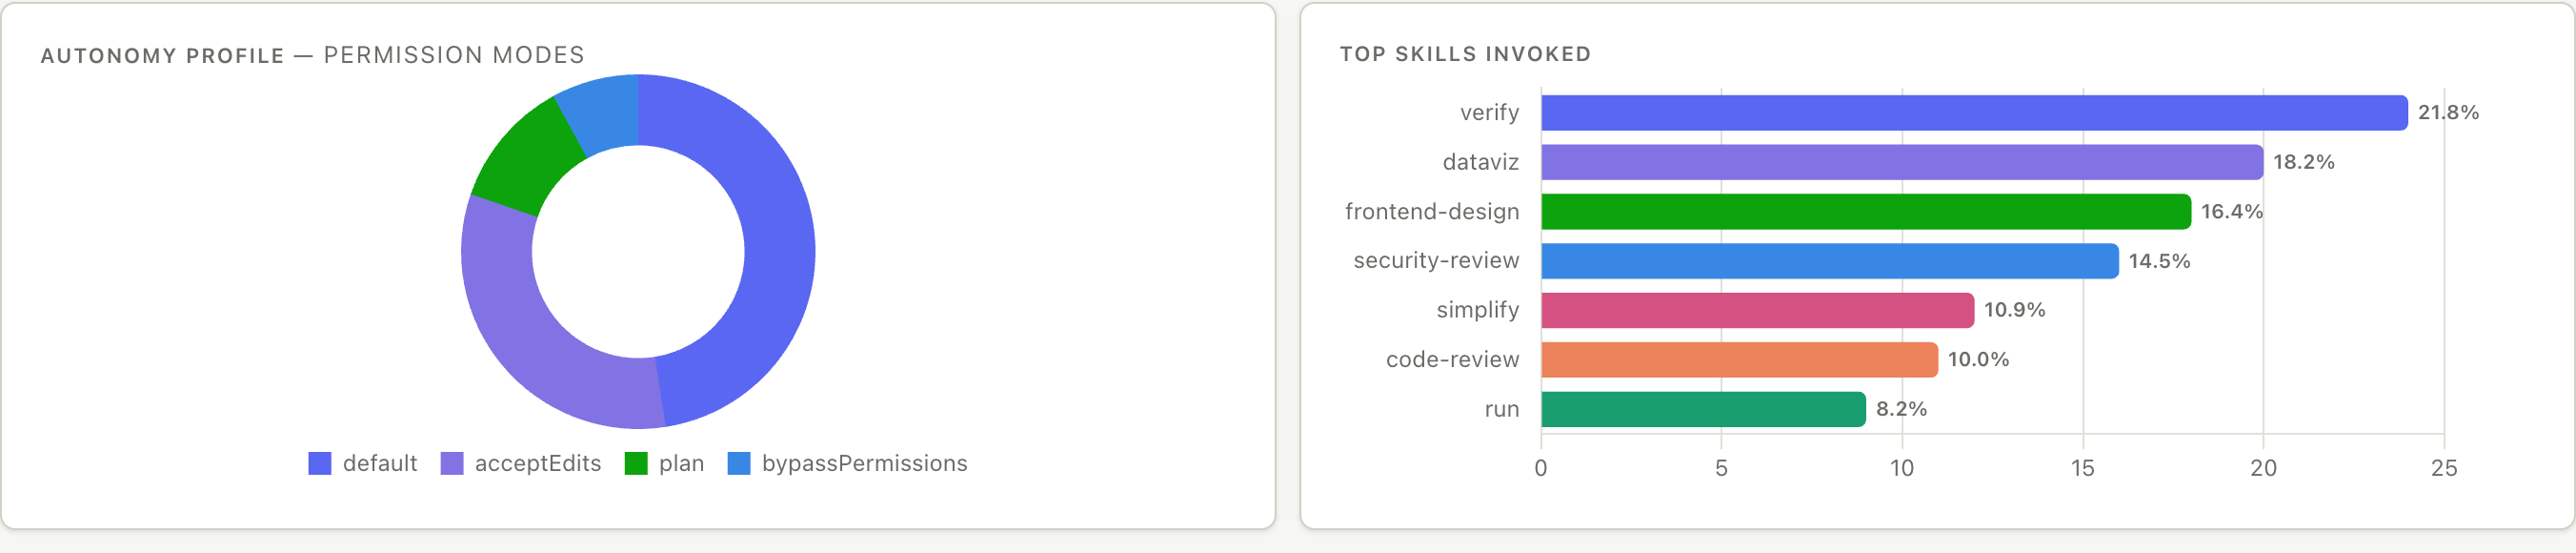
- Top tool usage and top skills invoked
- Projects ranked by cost
- Activity heatmap (weekday × hour, local time) toggleable by messages / turns / prompts
- Autonomy profile from permission-mode usage
- Projects — per-project totals with rename, color-coded tagging (a
tag/namedisplay name), and hide controls - Sessions — searchable list with per-session detail: duration, API time, tokens, tools, code churn, git branch, reliability signals, and optional summaries
- Calendar — a week-view grid that places every session as a color-coded block by project tag, with per-week agent-hours and wall-clock totals and a project/tag filter
- Cost estimation — equivalent API pricing per model (see Pricing), editable in one file
- Fast, incremental scans — sessions are cached in a local SQLite DB; only files whose size/mtime changed are re-parsed
- Optional token auth and optional static export for private remote hosting
How it works
Claude Code writes a JSONL transcript per session under ~/.claude/projects/. This tool:
- Scans those transcripts (read-only) and extracts per-session metrics.
- Caches the results in
data/usage.db(SQLite) so subsequent startups are instant. - Serves a small single-page dashboard from a local FastAPI server.
No transcript is ever written to; the raw content of your prompts stays on disk and is never sent anywhere.
Requirements
- Python 3.11+
- uv (recommended) — or any PEP 517 installer
- An existing
~/.claude/projects/directory (created by Claude Code)
Setup
uv sync
Run
uv run python -m claude_dashboard
Then open http://localhost:8042.
If you've installed the package — from PyPI (uv tool install dashboard-for-claude-code or pipx install dashboard-for-claude-code) or from a checkout (uv pip install -e . / pipx install .) — the dashboard-for-claude-code command works the same way, and uvx / pipx run run it without installing at all (see Quick start):
dashboard-for-claude-code
Run dashboard-for-claude-code --help for the available flags (--host, --port, --version).
On first startup, all sessions are parsed in the background, so the UI appears immediately and fills in as the scan completes. Later startups are fast (incremental). Click Refresh in the header any time to re-scan.
Access from other devices on your LAN
By default the server binds to 127.0.0.1:8042, so it is reachable only from your own machine. To expose it to other devices on your local network, set DASHBOARD_HOST=0.0.0.0; it will then be reachable at http://<your-lan-ip>:8042. Only do this on networks you trust — the dashboard has no auth unless you set DASHBOARD_AUTH_TOKEN (see below).
Configuration
All configuration is via environment variables; the bind interface and port can
also be set with the --host / --port flags, which take precedence:
| Variable | Default | Description |
|---|---|---|
DASHBOARD_HOST |
127.0.0.1 |
Interface to bind. Localhost-only by default; use 0.0.0.0 to expose on your LAN. |
DASHBOARD_PORT |
8042 |
Port to serve on. |
DASHBOARD_AUTH_TOKEN |
(unset) | If set, requires a bearer token on API calls (see scripts/SECURITY.md). |
DASHBOARD_REDACT_HOME |
1 (in export) |
Replaces your home-directory prefix with ~ in exported data. |
DASHBOARD_DB |
data/usage.db |
Path to the SQLite cache. Point it elsewhere to keep a separate database (e.g. for a demo). When running from an installed package (pipx/uvx) rather than a source checkout, the default is ~/.local/share/dashboard-for-claude-code/usage.db (respects XDG_DATA_HOME). |
DASHBOARD_NO_SCAN |
(unset) | If set, skips the automatic scan on startup. Used by tests and the demo-data flow so a run never reads ~/.claude. |
DASHBOARD_SUMMARY_FILE |
session_summary.json next to the DB |
Where scripts/set_summaries.py writes optional session summaries. |
To expose on your LAN:
DASHBOARD_HOST=0.0.0.0 uv run python -m claude_dashboard
Note: always launch via
python -m claude_dashboard(or thedashboard-for-claude-codecommand) and configure the bind withDASHBOARD_HOSTor--host. Running uvicorn directly (uvicorn claude_dashboard.app:app --host 0.0.0.0) leaves the app thinking it is
localhost-only, and its Host-header protection will reject LAN requests
with 403.
Sessions deleted by Claude Code
Claude Code prunes old transcripts after its cleanupPeriodDays. The dashboard
deliberately keeps those sessions in its cache so your history survives. If
you want the cache to mirror the disk instead, trigger a pruning refresh:
curl -X POST 'http://localhost:8042/api/refresh?prune=true'
Privacy & security
- Read-only. The dashboard never modifies your Claude Code logs.
- Local by default. Data stays on your machine; nothing is uploaded.
- Your prompts are not exported. The optional static export deliberately strips raw prompt text and can redact home-directory paths.
If you choose to host the dashboard remotely, read scripts/SECURITY.md for access-control guidance (Cloudflare Access, origin IP allowlisting, token auth). See also SECURITY.md for how to report a vulnerability.
Optional: static export & remote deployment
You can export the dashboard as a static site (no server, no live access to your logs) and host it privately:
python scripts/export.py # writes remote_public/
The scripts/ directory contains helpers for exporting, deploying, and auto-refreshing. See scripts/README.md.
A note on pricing
Costs are calculated at equivalent pay-as-you-go API rates — useful for gauging usage scale even if you're on a subscription. Rates are defined (as of May 2026) in src/claude_dashboard/pricing.py; update that file if rates change or a model is missing.
Development
uv sync installs runtime dependencies only, so running the dashboard stays lean.
Contributors need the full toolchain (tests, linter, security scanner), which lives
in opt-in dependency groups:
uv sync --all-groups
Then run the test suite (and, optionally, the same security scan CI runs):
uv run --group dev pytest -v
uv run --group security bandit -c pyproject.toml -r src/claude_dashboard scripts
Project layout
src/claude_dashboard/
  __main__.py     # entrypoint (uvicorn)
  app.py          # FastAPI routes + optional auth
  scanner.py      # walks ~/.claude/projects, orchestrates parsing
  parser.py       # extracts metrics from a session JSONL
  pricing.py      # per-model equivalent API rates
  store.py        # SQLite cache + queries
  static/         # single-page UI (vanilla JS + Chart.js)
scripts/          # export / deploy / refresh helpers
tests/            # pytest suite
Contributing
Contributions are welcome — see CONTRIBUTING.md.
Third-party
- Chart.js (MIT) is vendored at
src/claude_dashboard/static/chart.umd.min.js.
License
MIT © The dashboard-for-claude-code contributors.
Trademarks
"Claude" and "Claude Code" are trademarks of Anthropic, PBC. This project is an
independent, community-maintained tool and is not affiliated with, endorsed by,
or sponsored by Anthropic. References to Claude Code describe interoperability
only (nominative use); no affiliation or endorsement is implied.
Yorumlar (0)
Yorum birakmak icin giris yap.
Yorum birakSonuc bulunamadi