CCMeter
Health Warn
- No license — Repository has no license file
- Description — Repository has a description
- Active repo — Last push 0 days ago
- Community trust — 14 GitHub stars
Code Pass
- Code scan — Scanned 4 files during light audit, no dangerous patterns found
Permissions Pass
- Permissions — No dangerous permissions requested
This is a terminal dashboard tool that reads your local Claude Code session data to provide analytics on token usage, costs, code generation metrics, and efficiency. It renders an interactive interface directly in your terminal.
Security Assessment
Overall Risk: Low. The tool accesses local Claude Code session files and configuration directories to aggregate its analytics, which is expected for its purpose but means it interacts with your usage history. The code scan found no hardcoded secrets and no dangerous execution patterns. However, the recommended installation method pipes a remote shell script directly into your shell (`curl | sh`). While this is standard practice for many modern CLI tools, it always carries a minor inherent risk. Users who prefer to avoid this can safely compile the tool directly from the Rust source code or install it via Homebrew. No outbound network requests or dangerous permissions are required for the tool to function.
Quality Assessment
The project appears to be actively maintained, with the latest repository push occurring today. It has a respectable baseline of community trust, currently sitting at 14 GitHub stars. The README clearly indicates the project uses the MIT license (despite an automated scanner failing to detect the file, which is likely a minor scanning rule issue). Furthermore, the tool is written in Rust, a language highly regarded for producing reliable and memory-safe applications.
Verdict
Safe to use. Just be mindful of the `curl | sh` installation method if your security posture strictly forbids executing remote scripts.
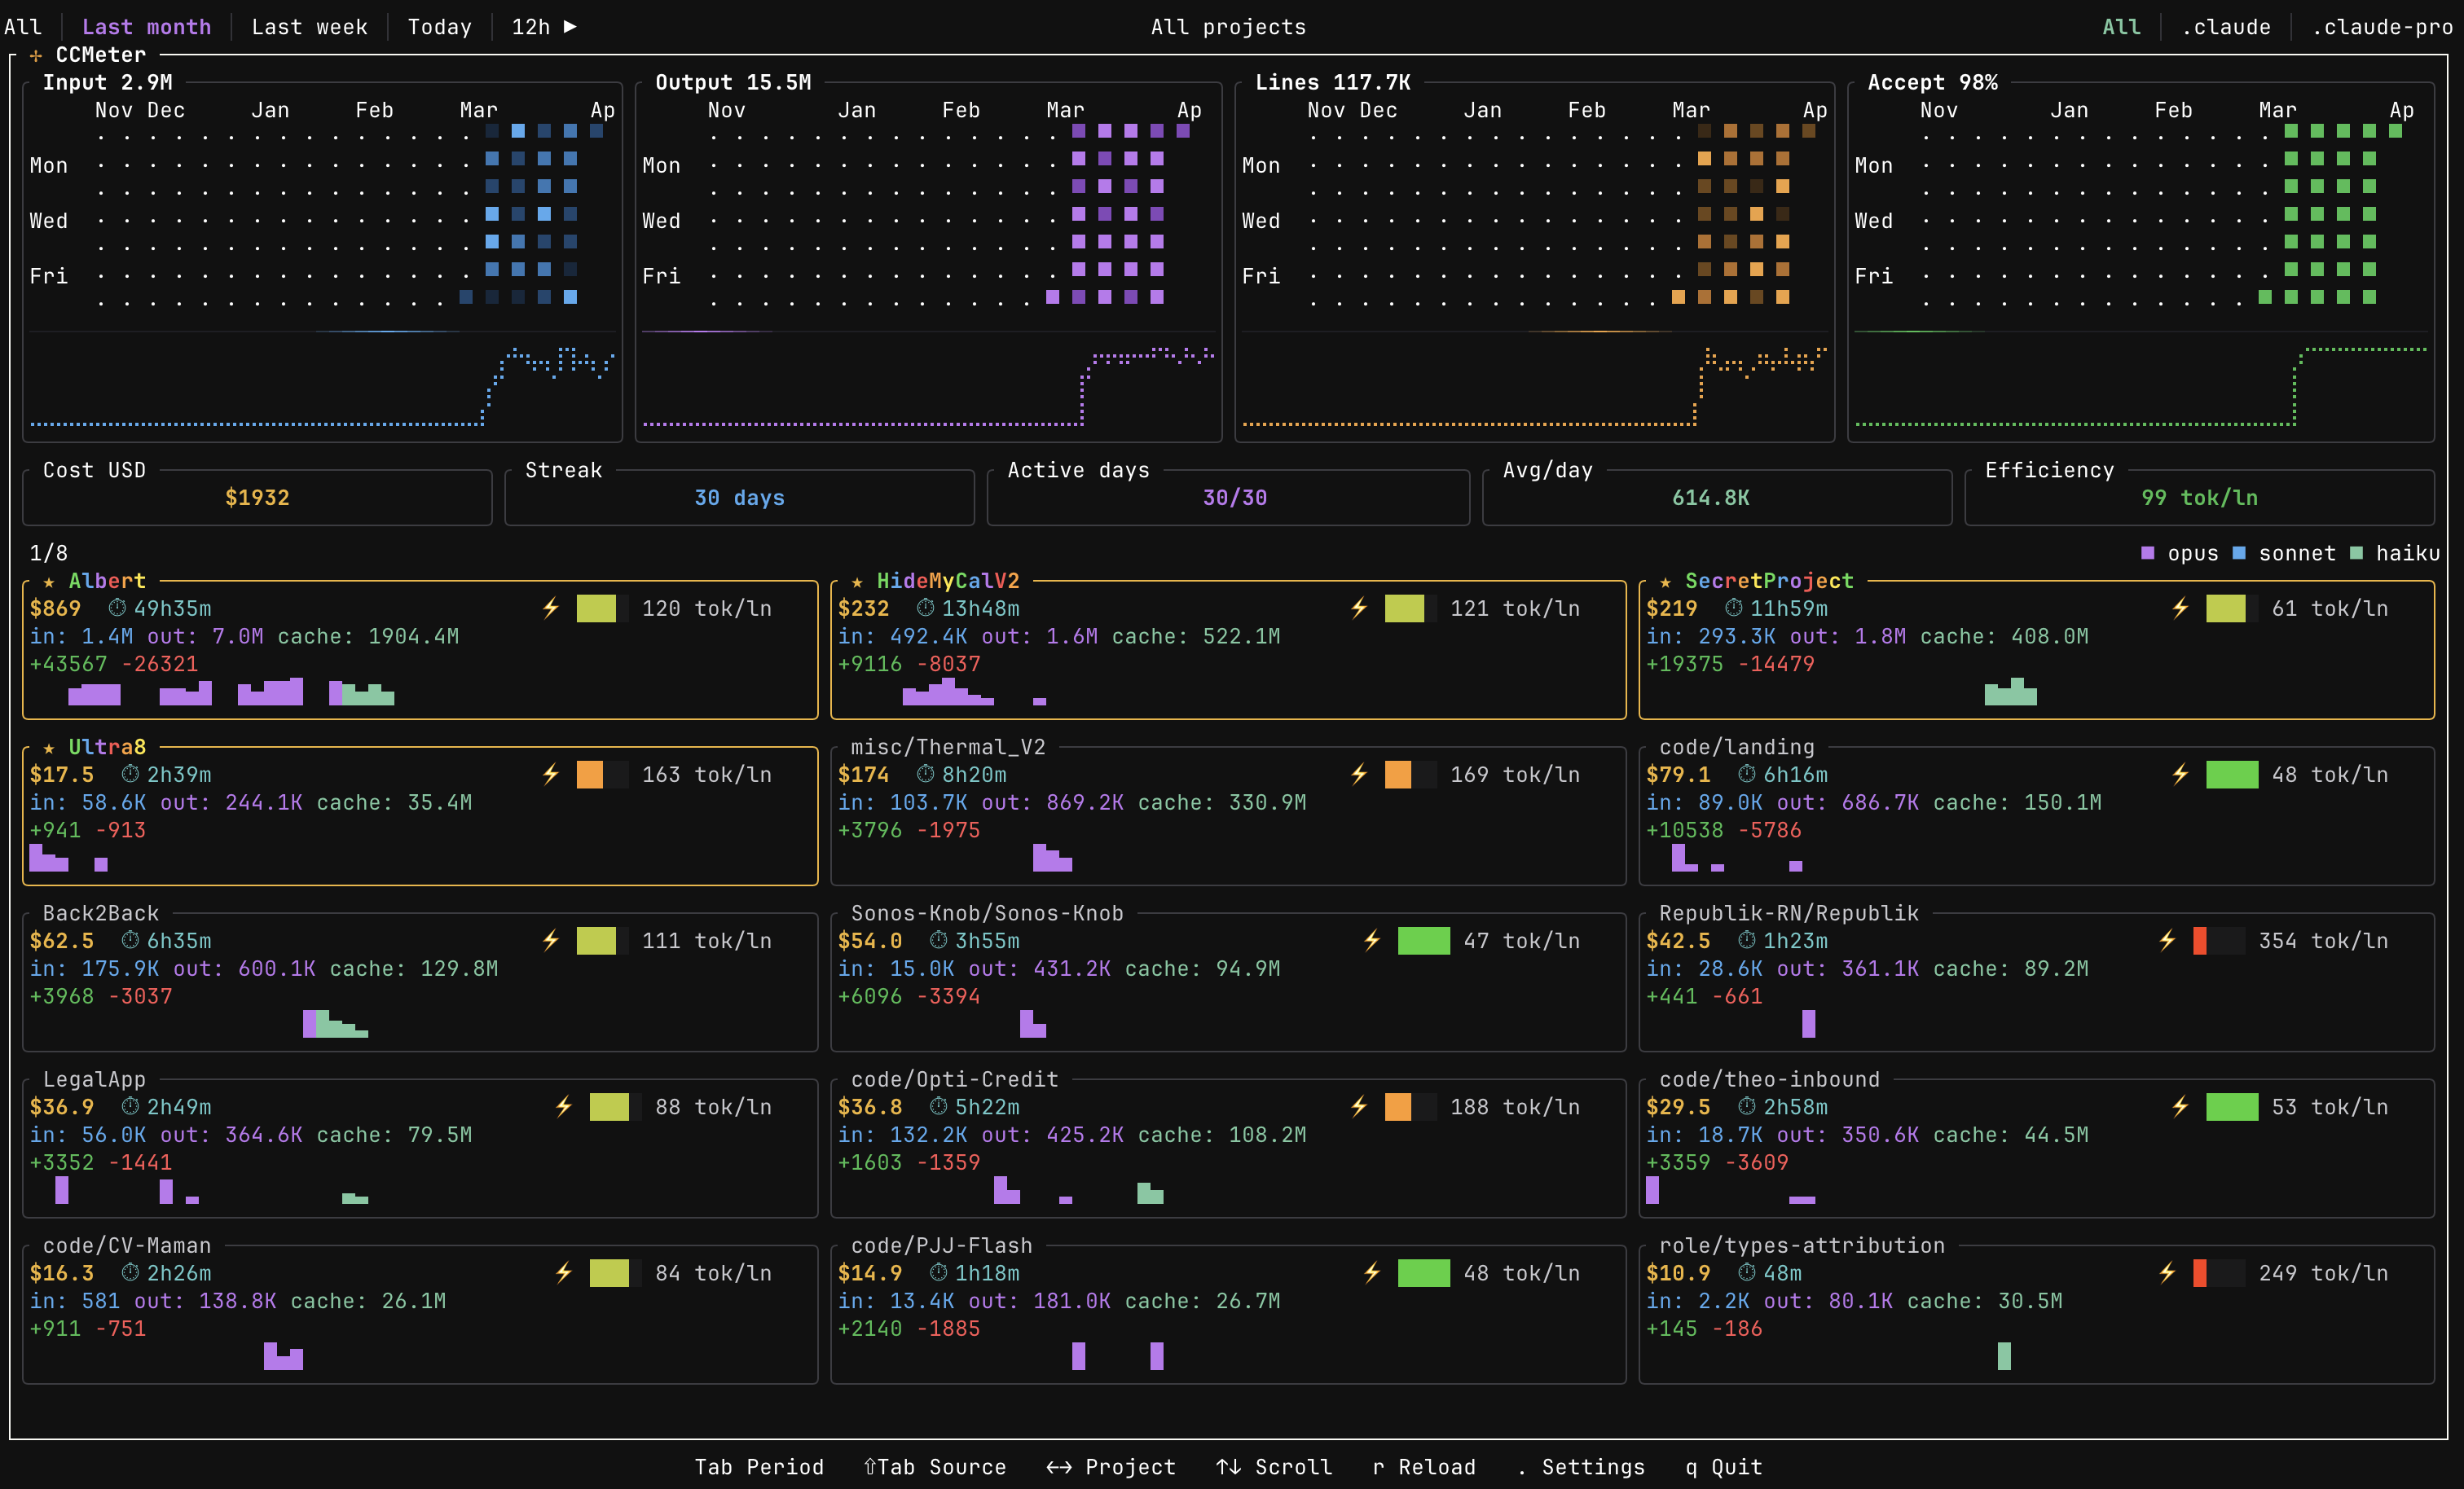
Deep analytics and session insights for your Claude Code usage
![]()
A terminal dashboard for Claude Code usage analytics
Track tokens, costs, code generation, and efficiency, all from your terminal.
Quick start
curl --proto '=https' --tlsv1.2 -LsSf https://github.com/hmenzagh/CCMeter/releases/latest/download/ccmeter-installer.sh | sh
ccmeter          # launch the dashboard
# press `.` for the settings panel, `q` to quit
Overview
CCMeter reads your local Claude Code session data and renders an interactive TUI dashboard. Data refreshes every 5 minutes (manual reload with r).
Metrics & analytics
- Cost tracking — per-model USD breakdown (Opus, Sonnet, Haiku) via built-in pricing tables
- Token analytics — input, output, and prompt cache usage over time
- Code metrics — lines suggested, accepted, added, and deleted, with acceptance rate
- Active time estimation — approximates how long you actually spent working on each project from session activity
- Efficiency score — tokens per line of code changed (tok/ln, lower is better); each card has a quartile gauge (green → yellow → red) comparing it to other projects
- KPI banner — total cost, current streak, active days, avg tokens/day, and efficiency score at a glance
Visualizations
- Heatmaps — four GitHub-style contribution grids (input, output, lines changed, acceptance rate) with trend sparklines; minute-level granularity on 1h / 12h / Today filters
- Project cards — scrollable grid with per-project sparklines colored by model usage
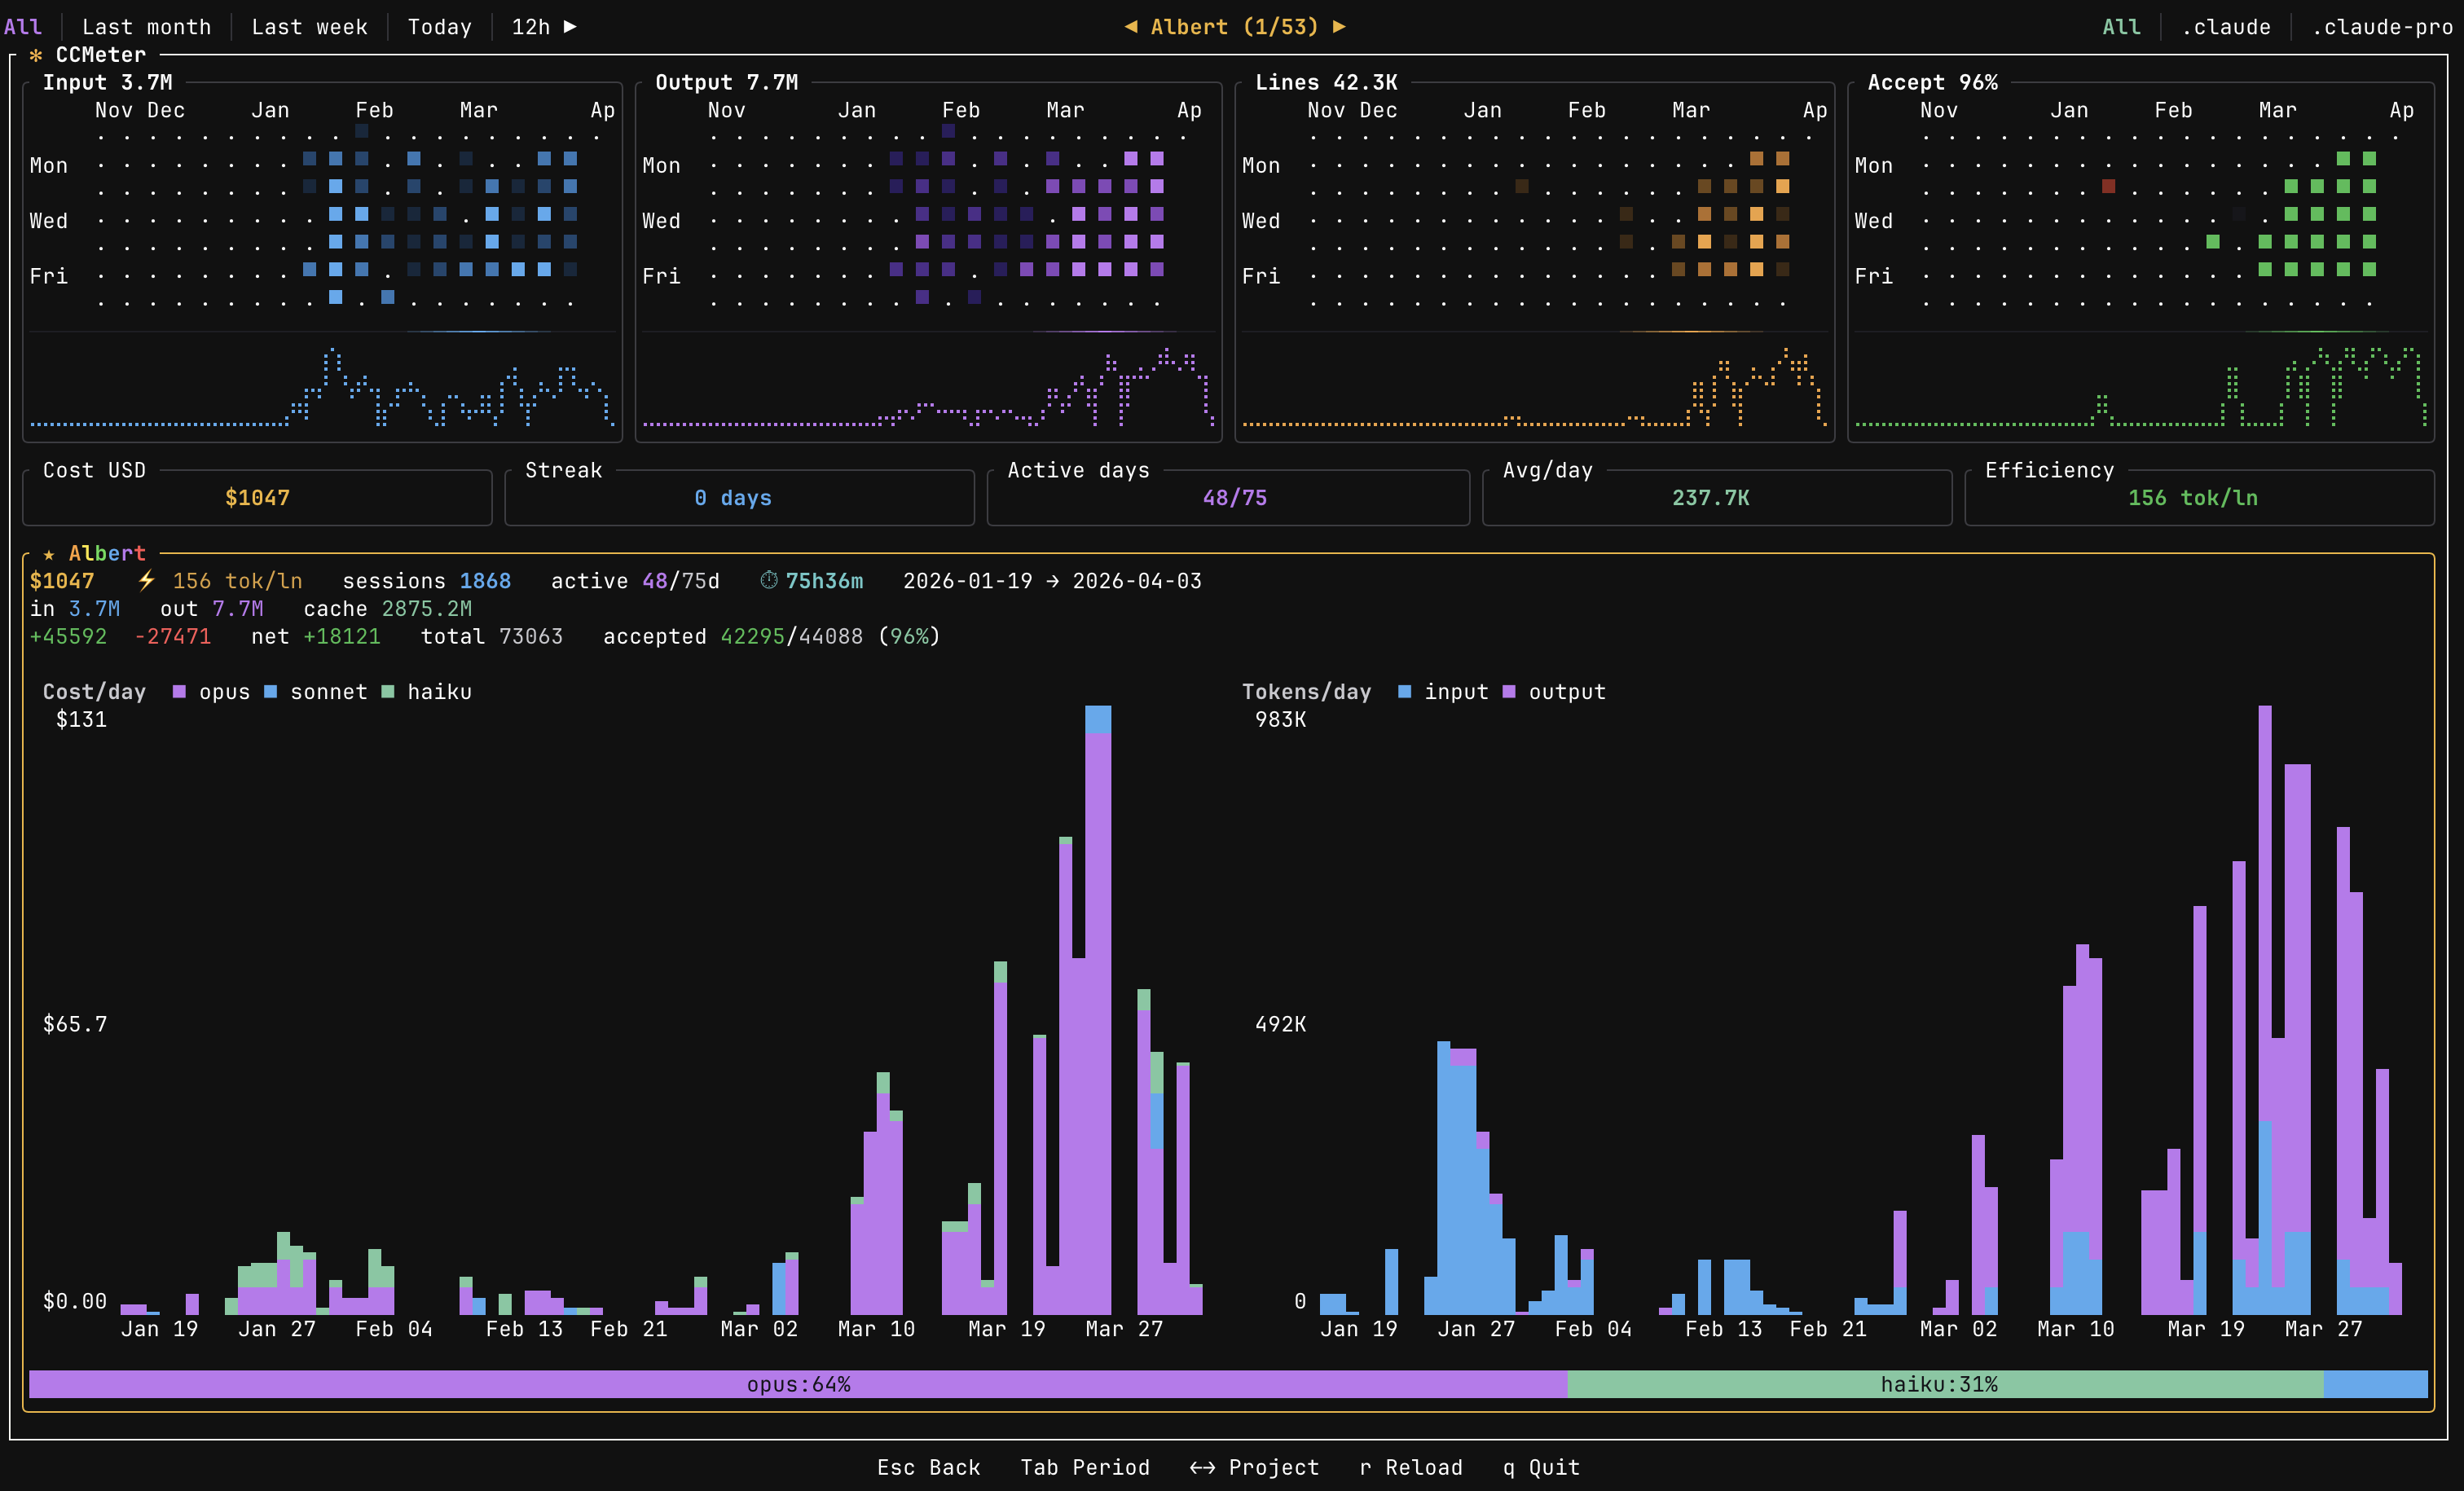
- Per-project detail — dedicated charts, model distribution, cost sparklines, and estimated active time
- Time filters — 1h, 12h, Today, Last week, Last month, All
Project handling & performance
- Auto-discovery & grouping — finds Claude projects and groups them by git repository
- Multi-source roots — switch between Claude config directories with
Shift+Tab - Persistent cache — historical metrics cached locally for near-instant startup; only new sessions get parsed
- Responsive layout — heatmaps and card grids adapt to terminal size
Installation
Install script (recommended)
curl --proto '=https' --tlsv1.2 -LsSf https://github.com/hmenzagh/CCMeter/releases/latest/download/ccmeter-installer.sh | sh
Homebrew
Install prebuilt binaries via Homebrew:
brew install hmenzagh/tap/ccmeter
From source
git clone https://github.com/hmenzagh/CCMeter.git
cd CCMeter
cargo install --path .     # installs `ccmeter` to ~/.cargo/bin (make sure it's in $PATH)
Or build without installing — the binary will be at target/release/ccmeter:
cargo build --release
Requirements (from source): Rust 1.85+ and Cargo.
Usage
ccmeter
Keybindings
| Key | Action |
|---|---|
Tab |
Cycle time filter |
Shift+Tab |
Switch source root |
j / k or Up / Down |
Scroll projects |
h / l or Left / Right |
Navigate between projects |
Esc |
Deselect project |
. |
Open settings panel |
r |
Reload data |
q / Ctrl+C |
Quit |
Settings panel
Press . to open the settings panel, where you can:
- Rename projects with custom display names
- Merge multiple projects into a single group
- Split sources out of auto-detected groups
- Star favorites (animated rainbow border)
- Hide projects from the dashboard
How it works
CCMeter discovers Claude Code sessions by scanning your home directory for any folder whose name contains claude and that has a projects/ subdirectory with session logs (so ~/.claude/projects, ~/.config/claude/projects, and other Claude-compatible CLIs are all picked up automatically). It parses JSONL session files in parallel using rayon, extracts token counts and model identifiers, and computes costs from built-in pricing tables.
Session JSONL → parallel parse → daily aggregates → cached history → TUI render
Cache
Parsed metrics are persisted to ~/.config/ccmeter/history.json. On subsequent launches, only new or modified session files are parsed, everything else is served from cache, making startup near-instant even with thousands of sessions.
Per-project view
Use h/l or arrow keys to select a project card. The dashboard switches to a detail view showing:
- Cost and token charts scoped to that project (daily or minute-level depending on time filter)
- Model distribution bar with per-model cost breakdown
- Active time estimate, sessions count, lines added/deleted, and efficiency gauge
- Heatmaps filtered to the selected project only
Press Esc to go back to the global overview.
Configuration
User overrides are stored at ~/.config/ccmeter/overrides.json and can be edited through the settings panel or manually.
Tech stack
| Crate | Role |
|---|---|
| ratatui | Terminal UI framework |
| crossterm | Terminal event handling |
| clap | CLI argument parsing |
| rayon | Parallel JSONL parsing |
| chrono | Date/time handling |
| serde / serde_json | Serialization & JSONL parsing |
| dirs | Cross-platform home/config paths |
Project structure
src/
├── main.rs               # Entry point & event loop
├── app.rs                # Core application state
├── config/
│   ├── mod.rs
│   ├── discovery.rs      # Project auto-discovery
│   └── overrides.rs      # User configuration & merges
├── data/
│   ├── mod.rs
│   ├── parser.rs         # JSONL session parsing
│   ├── cache.rs          # Persistent metric cache
│   ├── tokens.rs         # Daily token aggregation
│   └── models.rs         # Model pricing tables
└── ui/
    ├── mod.rs
    ├── dashboard.rs      # Main layout
    ├── heatmap.rs        # Heatmap rendering
    ├── theme.rs          # Color theme
    ├── time_filter.rs    # Time range logic
    ├── settings_view.rs  # Settings panel
    └── cards/
        ├── mod.rs
        ├── data.rs       # Card data aggregation
        └── render.rs     # Card rendering
License
MIT
Reviews (0)
Sign in to leave a review.
Leave a reviewNo results found