xodb
Health Uyari
- License — License: GPL-3.0
- Description — Repository has a description
- Active repo — Last push 0 days ago
- Low visibility — Only 5 GitHub stars
Code Uyari
- process.env — Environment variable access in examples/node-demo.js
Permissions Gecti
- Permissions — No dangerous permissions requested
Bu listing icin henuz AI raporu yok.
Native FAST Linux debugger and system profiler: C/C++, Lua, Perl, Python, Ruby, JS; MCP for agents
xodb
A graphical, Linux-native debugger. The hugs and kisses debugger.
Not a GUI bolted onto GDB. Not a chat panel bolted onto a debugger. Not an IDA
clone. It's a live visual instrument for understanding software — debugger,
disassembler, profiler, tracer, and agent playground sharing one semantic model
of your program.
Zig. Wayland. Vulkan. FreeType/HarfBuzz. No Electron, no webview, no 1990s
widget toolkit. Dark, dense, keyboard-driven with a huge nod to RAD Debugger's
visuals (but not a clone- it's linux-first and cross-arch read on)
⚠️ The disclaimer you should read first
This is a challenge project: 24 hours of work to make a functioning
debugger and a followup week to see how hard it can be productionalized,
starting 2026-09-30. I want to find out how much I could do with AI
in a stupidly short amount of time. This initial push is an early peek on day
3. Don't expect it to be nice for like, at least one more day ok.
So: it works, there are tests, there's a lot of it — and it will absolutely
fall over in ways a 20-year-old debugger wouldn't. We're fuckin' around and
making stuff. Mind the edges, read Current limits.
This is pre-alpha. If it doesn't work, have your agent fix it and send a pr.
Guiding principles
- Graphical, fast, flashy. The UI is the product, not a courtesy wrapper.
- AI-native by design. MCP interfaces built for agent control and analysis
from day zero — humans and agents drive the same model, the same evidence. - Linux native in all ways. ptrace, perf, /proc, pidfd, eBPF, uprobes,
hardware debug registers. (not all implemented yet, mind) - Portable where it counts. Not glued to x86-64, ELF, DWARF, or 64-bit
pointers. AArch64 matters to us and is first class, more coming. - Non-PC: remote debugging (Android especially), planned Lua scriptability
withdbg.eval(), replay, object/causal graphs. - One model, three readers: human understanding, agent understanding,
machine-verifiable semantics. A design has to improve all three.
The long version — the whole architectural brief this thing grew from — lives in
linux-ai-debugger-agents.md.
Screenshot
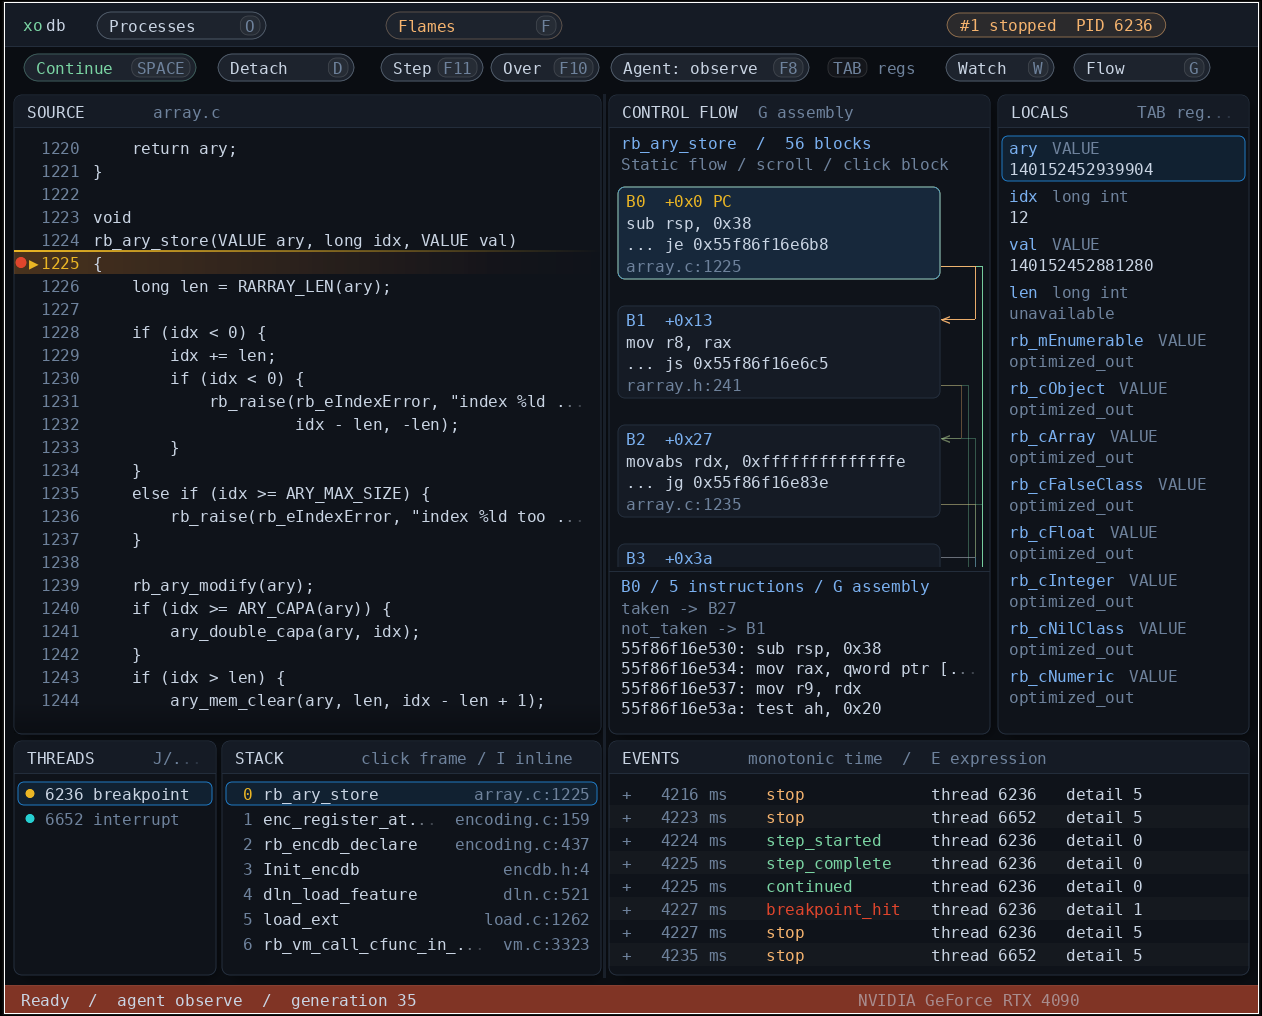
Stopped on rb_ary_store in CRuby: source, static control-flow graph with the
selected block's disassembly, decoded VALUE locals, threads, stack, and the
event timeline.
Keys, in brief: F10 step over · G graph/asm · P profile · F
flames · E pinned expression · Shift+E live display · Shift+L convert selected watch · V watch/events · Tab locals/registers
· J/K threads · Shift+D detach · F8 grant or yank agent control · Shift+Q quit.
Letter shortcuts follow your active keyboard layout. In text fields, Ctrl+V
pastes, middle-click pastes the primary selection, and Ctrl+C copies.
See text editing.
On compositors supporting xdg-decoration (including KDE Plasma), the GUI
requests the desktop's native title bar for dragging, minimizing, maximizing
and closing the window. A look that draws its own title bar and window buttons
(--overview --look win95) asks the compositor to leave the frame off instead.
Compositors without the protocol (including GNOME) are unchanged.
What actually works today
New here? Which tool do I reach for? is the plain-language map
(debugger vs profile vs observation, with demos).
Process control. Launch or attach, continue, interrupt, detach, per-thread
inspection. Software breakpoints by address, symbol, or file:line. Instruction
and source stepping, step-over. Worker-thread exec, main-thread-exits-first,
up to 1,024 threads.
Source debugging. ELF modules, DWARF 4/5 via libdw, CFI unwinding, locals
for the selected frame, C/C++ scalars/pointers/structs/arrays, side-effect-free
expressions with $register access, Rust/Zig slice and text previews. Explicit
optimized-out / unavailable / unsupported results instead of lies.
Hardware write investigations. Point at item->value, hit W, run. xodb
records the write (7 -> 12), the thread, registers, frames, locals, source
location, and the derived preceding instruction — then exports the whole
investigation to JSON as evidence.
CPU profiling. perf sampling, flame graphs with zoom and self/inclusive
counts, a linked timeline with drag-select ranges and optional scheduling lanes,
sampled stacks with background DWARF reconstruction, saved capture archives,
offline reopen, speedscope export.
Static navigation. Bounded control-flow graphs, basic blocks, branch edges,
honest unresolved transfer markers. Click a block, read its source and asm,
nothing executes.
Allocations. Native allocator calls, reallocs, frees, lifetime and
outstanding views, allocation caller stacks and byte/count heap flames — with
MCP evidence and save/reopen. See docs/ALLOCATIONS.md.
CPU archives can be compared with --compare-capture before.xoc --open-capture after.xoc;
see profile comparison. Single-thread x86-64 source
stepping now batches straight-line instructions; see source stepping.
Function investigations. Headless recipes capture native function entries,
return words and call durations, compare fast/slow cohorts, and save/reopen .xoi
evidence. MCP also provides retained stopped inspections and temporal joins to
CPU, syscall and allocation records. See commands and limits.
For repeated baseline/variant runs with input hashes, retained failures and offline
summaries, see observation experiments.
Themes. Built-in dark, light and contrast palettes and custom JSON colors,
selected at startup for local, remote and offline views. See themes.
C runtime. Target control and kernel collectors have one C implementation,
used locally and by xodb-agent. Build the agent with GCC or Clang; it needs no
Zig or GUI libraries. The host GUI/MCP keeps symbols, expressions and profiling
analysis, including cross-ISA debugging of an m68k target.
See C runtime builds, commands and limits.
Remote + ARM64. The x86-64 workstation GUI drives a headless xodb on an
AArch64 Jetson over SSH or LAN TCP. ARM64 hardware data watchpoints work through
MCP. Android: native executables and JNI libraries inside a debug APK, over USB.
(ARM64 · remote ·
Android)
Build and run
The GUI baseline is Linux x86-64, a Wayland session, a working Vulkan driver,
and Zig 0.16 or newer. ARM64 currently uses the headless backend. See
SETUP.md for tracing permissions and headless builds.
Install the compiler tools, development headers, shader compiler and default
font for your distribution. These commands cover the application build;
test dependencies are separate.
# Arch Linux
sudo pacman -S --needed base-devel zig pkgconf wayland wayland-protocols \
  libxkbcommon vulkan-headers vulkan-icd-loader shaderc freetype2 harfbuzz \
  capstone libelf ttf-dejavu
XODB_FONT=/usr/share/fonts/TTF/DejaVuSansMono.ttf
# Debian / Ubuntu (install Zig separately if it is not in your repository)
sudo apt install build-essential pkg-config libwayland-dev libwayland-bin \
  wayland-protocols libxkbcommon-dev libvulkan-dev glslc libfreetype-dev \
  libharfbuzz-dev libcapstone-dev libdw-dev libelf-dev fonts-dejavu-core
XODB_FONT=/usr/share/fonts/truetype/dejavu/DejaVuSansMono.ttf
# Fedora
sudo dnf install gcc zig pkgconf-pkg-config wayland-devel wayland-protocols-devel \
  libxkbcommon-devel vulkan-loader-devel vulkan-headers glslc freetype-devel \
  harfbuzz-devel capstone-devel elfutils-devel elfutils-libelf-devel \
  dejavu-sans-mono-fonts
XODB_FONT=/usr/share/fonts/dejavu-sans-mono-fonts/DejaVuSansMono.ttf
# openSUSE Tumbleweed (pkgconfig capabilities select the development packages)
sudo zypper install gcc zig pkgconf shaderc dejavu-fonts \
  'pkgconfig(wayland-client)' 'pkgconfig(wayland-scanner)' \
  'pkgconfig(wayland-protocols)' 'pkgconfig(xkbcommon)' 'pkgconfig(vulkan)' \
  'pkgconfig(freetype2)' 'pkgconfig(harfbuzz)' 'pkgconfig(capstone)' \
  'pkgconfig(libdw)' 'pkgconfig(libelf)'
XODB_FONT=/usr/share/fonts/truetype/DejaVuSansMono.ttf
Zig is not pinned to an exact compiler version. 0.16.0 is the last verified
baseline; newer compilers should be checked with the build and test suite, and
compatibility fixes are welcome. Build reports record zig version without
rejecting newer releases. The official Zig downloads
provide standalone toolchains. The GUI also requires the stable tablet-v2 XML
from wayland-protocols 1.36 or newer; older distribution releases may need
updated development packages. Install your GPU's Vulkan driver separately if
your desktop does not already have one; the Vulkan loader alone is insufficient.
Then, in the same shell:
./scripts/build -Doptimize=ReleaseSafe -Dfont-path="$XODB_FONT"
./zig-out/bin/xodb -- path/to/program arg1 arg2
./zig-out/bin/xodb --attach 12345
./zig-out/bin/xodb --help
--font /path/to/font.ttf overrides the compiled default. Build your target
with -g -O0 for the simplest source debugging experience.
Local RPM, Debian and Arch package recipes are included; see
packaging/README.md for source snapshots and build commands.
They are development packaging, not published distribution packages.
Demo
./zig-out/bin/xodb --break change_value --source tests/fixtures/m1.c \
  --record ".work/manual-m1-$(date +%Y%m%dT%H%M%S).json" \
  -- ./zig-out/bin/xodb-m1-fixture
Space to continue · F11 steps a source line · click item->value in
Locals, press W · Space again and watch it catch the store · Shift+Q saves
the investigation. Full walkthrough and limits: docs/M1.md.
Other things to poke at: ./scripts/demo-cruby (break on rb_ary_store, inspect
Ruby frames and named locals with the supported DWARF runtime), ./scripts/demo-perl (break on Perl_av_store and readkey, the new element and the interpreter's stack through Perl's DWARF), the M2 flow graph, and
flame graphs.
Agents
Point any MCP client at:
zig-out/bin/xodb --headless --mcp -- /absolute/path/to/program
Drop --headless and the GUI and the agent share one live session — same
threads, same stops, same evidence. MCP 2025-06-18, newline-delimited
JSON-RPC, stdio or single-client TCP.
Scopes are deliberate: observe by default; --agent-scope control adds
breakpoints, stepping, profiling and investigate_write; mutate adds memory
and register writes. Every control action must present the current sessiongeneration, so stale agents get rejected. F8 revokes control from the GUI
mid-flight. There's an action audit. There's no embedded LLM — bring your own.
For several agents on one debugger, use --session-socket /absolute/private/path/xodb.sock
with the GUI or --headless, then connect each MCP client throughscripts/session-client /absolute/private/path/xodb.sock. Clients begin as observers;
one can claim a time-limited controller lease. Reconnecting preserves retained
investigations. Shared-session commands and examples.
Current limits
- Native target backends are Linux x86-64 and AArch64. Opt-in x86-64
fork/vfork following retains 32 process sessions by
default, configurable up to 1,024. Job-control workflows remain limited. - Basic C/C++ types, no function calls, casts, bitfields, or inheritance.
Split DWARF and separate debug files are supported
with documented limits. Signal-frame unwinding remains unsupported. - Four x86 debug slots, aligned 1/2/4/8-byte watches. A watchpoint samples —
it is not a replay trace. Concurrent writes can slip between samples. - Source stepping is instruction-driven with a 10,000-instruction ceiling. It
needs to get faster. - Fixed 1,024-thread / 4,096-event capacities per process; old events expire.
Source files are capped at 1 MiB. - Startup colors and presets; one adjustable divider, no saved layouts, docking or theme editor yet.
Text starts at 16px; scaling and accessibility need real work. - No reverse execution, replay, decompiler, or GPU tracing.
Syscall timing is opt-in for selected x86-64 threads;
core debugging is read-only. - License: GPLv3 System dependencies and their observed licenses
are catalogued in docs/DEPENDENCIES.md.
The per-feature docs describe current limits; DAY1.md preserves the
initial feature snapshot.
What's next
- Skinnable, flexible display: font scaling, skin controls and pane layouts you can save; startup themes are available.
- AArch64 feature coverage: precise multi-watch attribution, modern ARM
validation, profiling, native ARM GUI. - More architectures, and the hardware or emulation to actually validate them.
- Your issues and PRs - file 'em please
TODO.md · milestones ·
agent tasks · findings journal
Tests
timeout 45 ./scripts/build test --summary all
python3 tests/mcp.py
python3 scripts/gui-smoke.py --m1
~70 integration scripts in tests/, including GUI smoke tests that spin up a
private headless Sway session and drive a virtual pointer, differential checks
against GDB, and a Vulkan render-fault injector. Run them outside the agent
sandbox — it denies ptrace and hides the GPU, which is the whole point.
Yorumlar (0)
Yorum birakmak icin giris yap.
Yorum birakSonuc bulunamadi