claude-code-usage-analysis
Health Gecti
- License — License: MIT
- Description — Repository has a description
- Active repo — Last push 0 days ago
- Community trust — 50 GitHub stars
Code Gecti
- Code scan — Scanned 12 files during light audit, no dangerous patterns found
Permissions Gecti
- Permissions — No dangerous permissions requested
Bu listing icin henuz AI raporu yok.
Empirical analysis of Claude Code token usage: auto-compaction sweet spots across 8 developer workflows and Claude Desktop vs. CLI overhead
Claude Code usage anti-patterns and best-practices

As engineers and builders we are using LLMs for almost all of our work, and the more we use them the more important it becomes to understand how to optimize the performance, reliability and cost of AI tools. I started this research to better understand and improve my own setup and greatly reduce my token usage and costs.
Claude Code usage is driven by cache misses, not by how much you type. The expensive habits are ways of throwing that cache away.
How long is your cache? 5 minutes on an API key (also Bedrock, Vertex and Foundry). 1 hour on a Pro, Max or Ultra subscription within its usage limits. The Claude CLI and the app behave the same. /usage shows it on its Prompt cache (main) line. (does this apply to you?)
Best practices
| ✅ Do | ❌ Don't | Usage and evidence |
|---|---|---|
Run /compact before a break longer than your cache |
Leave and resume later | 2.5x vs about 10x 3 runs (details) |
After a break, /clear and write 3 lines: goal, done, next |
Run /compact after the break |
about 1x vs about 10x 3 runs, 2 for /compact (details) |
| On a subscription, lower the idle-compact minimum to 100k and keep the window open on breaks | Let the laptop sleep mid-session | +76% over a workday when idle compact did not run (estimate) modeled, not tested live (details) |
| Keep one session for small related fixes in a row | /clear between them |
28% less 1 run, small history, preliminary (details) |
Keep tool output short: a 1-line summary, or pipe logs through tail -50 |
Leave long logs in the chat, or let Claude reread the whole repo each turn | +15% (750-token log) to +64% (5,000) over the next 6 turns 2 runs each, preliminary (details) |
| Pick tools and model at the start | Turn off a tool or switch models mid-task | 22x a normal turn 2 runs, preliminary; model switch from docs, not tested (details) |
| Use the Claude Code CLI | Use the Desktop Code tab | Desktop at least 1.80x, T3 Code 1.19x the CLI 1 run, preliminary. Slash commands work in the Desktop app too. We did not test the Claude chat app. (details) |
Check your own habits: paste this into Claude Code
Everyone uses Claude Code differently. The best settings for you depend on your own logs. Paste the text below into Claude Code to check your habits once:
Everyone uses Claude Code differently. Recommend settings that fit MY logs, not general advice.

1. Clone https://github.com/inevolin/claude-code-usage-analysis into a temp folder, then run:
   python3 -m pip install -e .
   OUT=$(mktemp -d)
   python3 -m cc_usage_study.analyze ~/.claude/projects --summary --sessions --calls -o "$OUT/report.json"
   Keep that report file outside any git repo. Use only that file: summary numbers, timestamps, token counts, entrypoints, and compact_boundary fields. Do not read, paste, or upload the raw text of my chats. Do not report money amounts. Use % and multipliers.

2. Score my habits with my own numbers:
   - Continuing a session after the cache expired: use cache_rebuilds_main.ttl_expired_rebuild (a gap over 5 minutes if cache_creation_5m_tokens are most of the writes, or over 1 hour if cache_creation_1h_tokens are).
   - /compact after a break, or before: compare boundary_rows timestamps and trigger with gaps in call_rows.
   - Many short sessions close together (a rough sign of /clear between related work) instead of one continued session.
   - sdk-cli (claude -p) sessions continued across gaps, instead of a new session each run.
   - Which app I used, from by_entrypoint: cli = Claude Code CLI, sdk-cli = claude -p, t3-code = T3 Code, claude-desktop-3p = Desktop Code tab. Prefer the CLI, or T3 Code. Desktop's Code tab used at least 1.80 times the CLI in this study. The Claude chat app was not measured.
   - Sessions where one request reaches 300,000 tokens: use one call's prompt_tokens or compact pre_tokens. Do not use the session-sum of prompt_tokens.

3. Write a short report:
   (a) the 3 habits costing me the most, with my % or multipliers;
   (b) changes that fit my pattern, only from this list: /compact before breaks, /clear plus a 3-line reminder when I am already back, a new `claude -p` session each scheduled run, prefer the CLI or T3 Code over Desktop's Code tab. Mention `--autocompact` only as an unproven idea, and only if my sessions actually get that large;
   (c) what you could not tell. If a field is missing, compute it from timestamps and compact_boundary metadata only, or say you cannot tell.
This runs on your computer, on the files in ~/.claude/projects. The prompt tells Claude to use summary numbers and timestamps, not the raw text of your chats. The only thing that leaves your machine is the normal Claude Code conversation. That conversation will include those summary numbers.
Or install the skill, then type /claude-code-usage-check in a new session:
mkdir -p ~/.claude/skills
cp -R skills/claude-code-usage-check ~/.claude/skills/
To run only the analyzer yourself: python3 -m cc_usage_study.analyze ~/.claude/projects --summary --sessions --calls -o ./local-out/report.json. Keep the report file outside git. The tool never copies the text of your prompts.
Myths and unknowns
- Our calculation says
--autocompact 180000uses about 43% less. In a live test on a 270,000-token session, it only tied the default. We ran that test once, with no long pauses. (details) - We do not yet know the best compact settings for very long sessions. Our calculation failed when we checked it against the live tests. (details)
- Editing
CLAUDE.md, adding an MCP server, or changing effort between turns did not break the cache. The next turn used about the same as a normal turn (0.95x to 1.08x on average). (3 runs each, Claude Code 2.1.325; older versions may behave differently) (details) - Fewer raw tokens is not the same as less usage. One setting sent 63% fewer raw tokens than the default, and used 25.2% more. Two runs with the same raw tokens (about 294,000) differed 6.5x in usage, because cached tokens cost far less. (details)
- Resuming a scheduled
claude -prun (the Claude CLI's scripted mode) instead of starting fresh is estimated at about 3x. Not tested live. (details)
A "break" means you were away longer than the prompt cache. That cache lasts 5 minutes if you use an API key or usage credits, and 1 hour if you use a subscription within its usage limits. We measured pauses of 2 to 13 minutes on the 5-minute cache. (does this apply to you?)
What to do about it
Three habits that avoid paying for a cache rebuild. Paste them into your terminal or Claude Code prompt and edit the details.
- Scheduled runs (cron, CI): start a fresh
claude -psession every run and pass state in through a notes file, instead of resuming an old session. - Before a break: run
/compactand tell it what to keep, so the session is small when you return. - Back from a break on a new task: run
/clear, then give a 3-line reminder (Goal, Done, Next).
# Cron and CI: start a new session every run, and keep notes in a file
claude -p "$(cat .agent/handoff.md) Continue the nightly triage." --output-format json
# Before a break
/compact Keep: the open issue, files touched, test command

# Back after a break, new task
/clear
Goal: fix the currency rounding in invoices.
Done: tests in tests/test_invoice.py reproduce it.
Next: patch money.py, run the suite.
Careful with CLAUDE_AUTOCOMPACT_PCT_OVERRIDE. On a 1M-context model, 25 fires at about 245,000 tokens, which is reasonable. On a 200k-context model it fires at 45,000, below what a summary leaves behind, and the session thrashes (+239% in our model). In T3 Code it stacks with "Auto-compact after", so set only one of the two. (details)
T3 Code can compact before a break for you. Its idle-thread setting has three modes: "When you return" (the default, onReturn), "Before the cache expires" (beta, beforeCacheExpires), and "Never". "When you return" compacts after the cache has already expired, so you pay the rebuild anyway. "Before the cache expires" compacts an idle thread while the cache is still warm, which is the automatic version of /compact before a break. Not measured in this study yet.
See your cache. /usage shows a Prompt cache (main) line: warm, with its time limit and the time since your last turn, or cold. You can also show the time since your last turn in your status line. Community mods that do this exist; we have not tested them.
On a subscription, let idle compact do the /compact for you. It is on by default and summarizes the session at about 90% of the hour, but only while the window stays open and only above CLAUDE_CODE_IDLE_COMPACT_MIN_TOKENS (200,000 by default). Set it to 100000 so ordinary sessions qualify. It never runs on an API key, after claude -p ends, or on a sleeping laptop. (details)
On an API key, you can choose the 1-hour cache. Set "promptCacheTtl": "1h" in your settings, or CLAUDE_CODE_PROMPT_CACHE_TTL=1h. Each cache write then costs 2x instead of 1.25x, so it pays off only if you often come back after 5 to 60 minutes. Not measured here.
Desktop or CLI? Slash commands such as /clear and /compact work in both. The Desktop Code tab loads more tools and a longer system prompt, and used at least 1.80x the CLI in our one run. (details)
Claude.ai in the browser? Not tested. On Pro and Max it draws on the same usage limits as Claude Code.
Subagents? Not tested yet. Each subagent starts with its own context and pays its own cache write, and its cache lasts 5 minutes unless you set CLAUDE_CODE_SUBAGENT_PROMPT_CACHE_TTL=1h. Whether delegating a search beats doing it in a large session is on the list.
The evidence
This is the data behind the rules above. You do not need to read it to use the rules.
Methods in brief. All live runs used Claude Opus 5.5, effort medium, Claude Code 2.1.325, and the default 5-minute prompt cache, on a dedicated API key. "Usage" is cache-weighted units (1 / 1.25 / 2 / 0.05 / 5): input 1, 5-minute write 1.25, 1-hour write 2, read 0.05, output 5. That is list price divided by the Opus 5.5 input price. We report the mean and the min-to-max range. Findings with n under 3 are marked preliminary. The analyzer never copies prompt text.
Cache expiry after a break
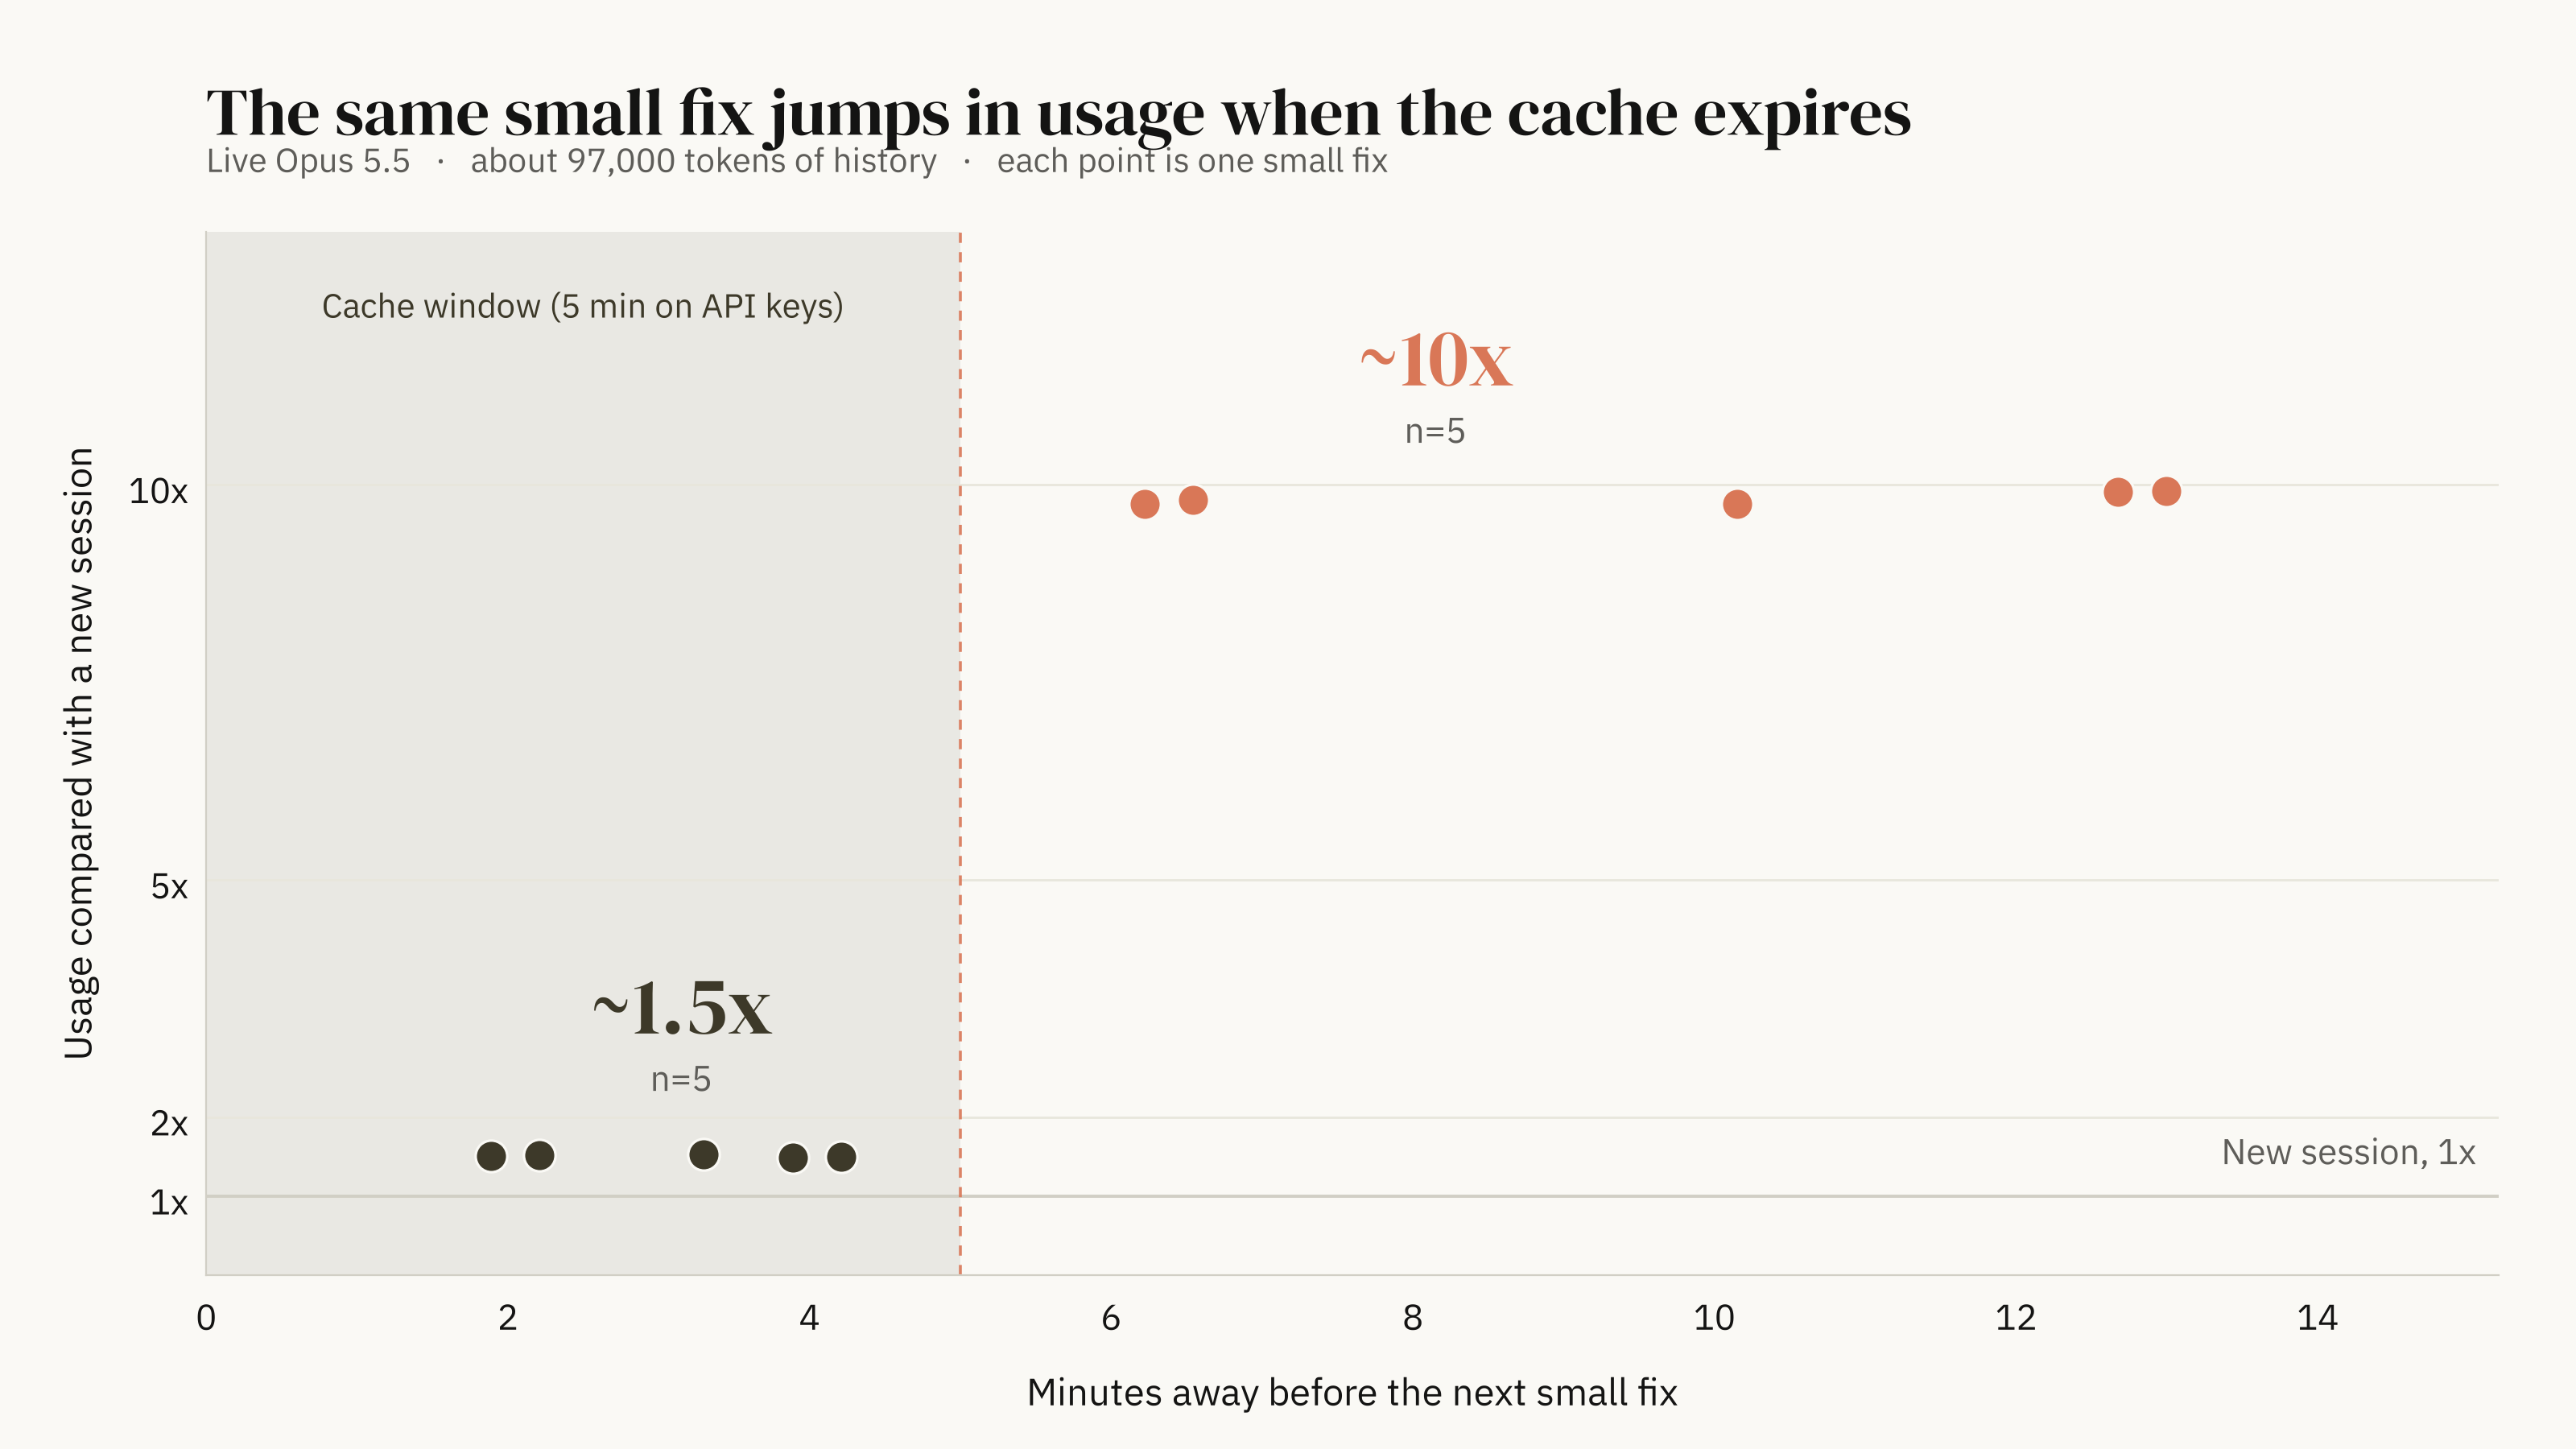
The chart below is the main result. Usage of the same class of small fix, on a session of about 97,000 tokens of history, stays near 1.5 times a new session while the cache is warm. After the 5-minute cache expires, it jumps to about 10 times. The jump is a cache miss: the first request after a long pause writes the history again, instead of reading it cheaply.
| Pause before the next fix | Usage vs a new session | n | First request after the pause |
|---|---|---|---|
| 2 minutes, cache still warm | 1.51x (1.508x to 1.515x) | 2 | Read 96,850 to 96,862; wrote 674 to 739 |
| 3.3 minutes, cache still warm | 1.52x | 1 | Read 96,730; wrote 743 |
| 4 minutes, cache still warm | 1.49x (1.485x to 1.495x) | 2 | Read 98,195 to 98,249; wrote 297 to 299 |
| 6.4 minutes, cache already gone | 9.78x (9.76x to 9.80x) | 2 | Wrote 88,095 to 88,159; read 11,388 |
| 10 to 13 minutes, cache already gone | 9.87x (9.76x to 9.92x) | 3 | Wrote 86,178 to 88,229; read 11,388 |
All 5 continues inside the window used 1.49x to 1.52x (mean 1.51x). All 5 continues after expiry used 9.76x to 9.92x (mean 9.83x).
Each later continue is scored against a new session that ran the same fix (median, slice, or currency rounding). Those new sessions used 12,396 to 12,843 units (mean 12,571, n=3). The first request after a pause tells the same story in a different way: inside the window, it read 96,000 or more tokens from the cache and wrote only a few hundred. After the window, it wrote 86,000 or more and read only a short prefix.
Two runs with almost the same raw token count (about 294,000) differed 6.5x in usage. The warm continue mostly read the history. The stale continue had to write it again.
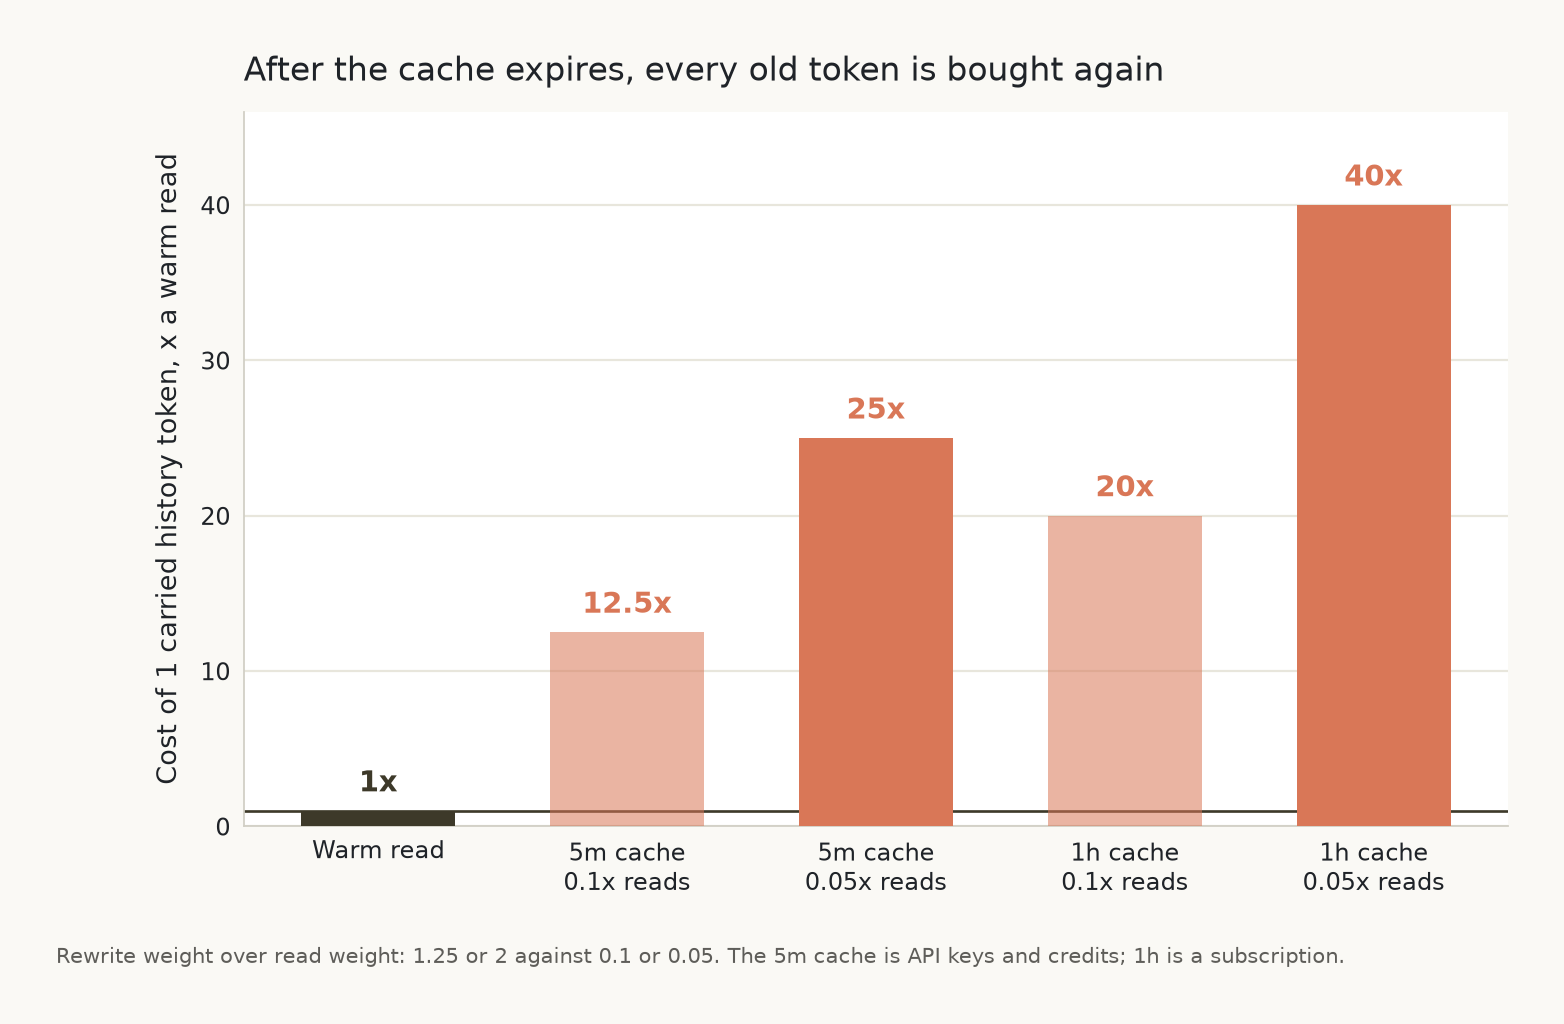
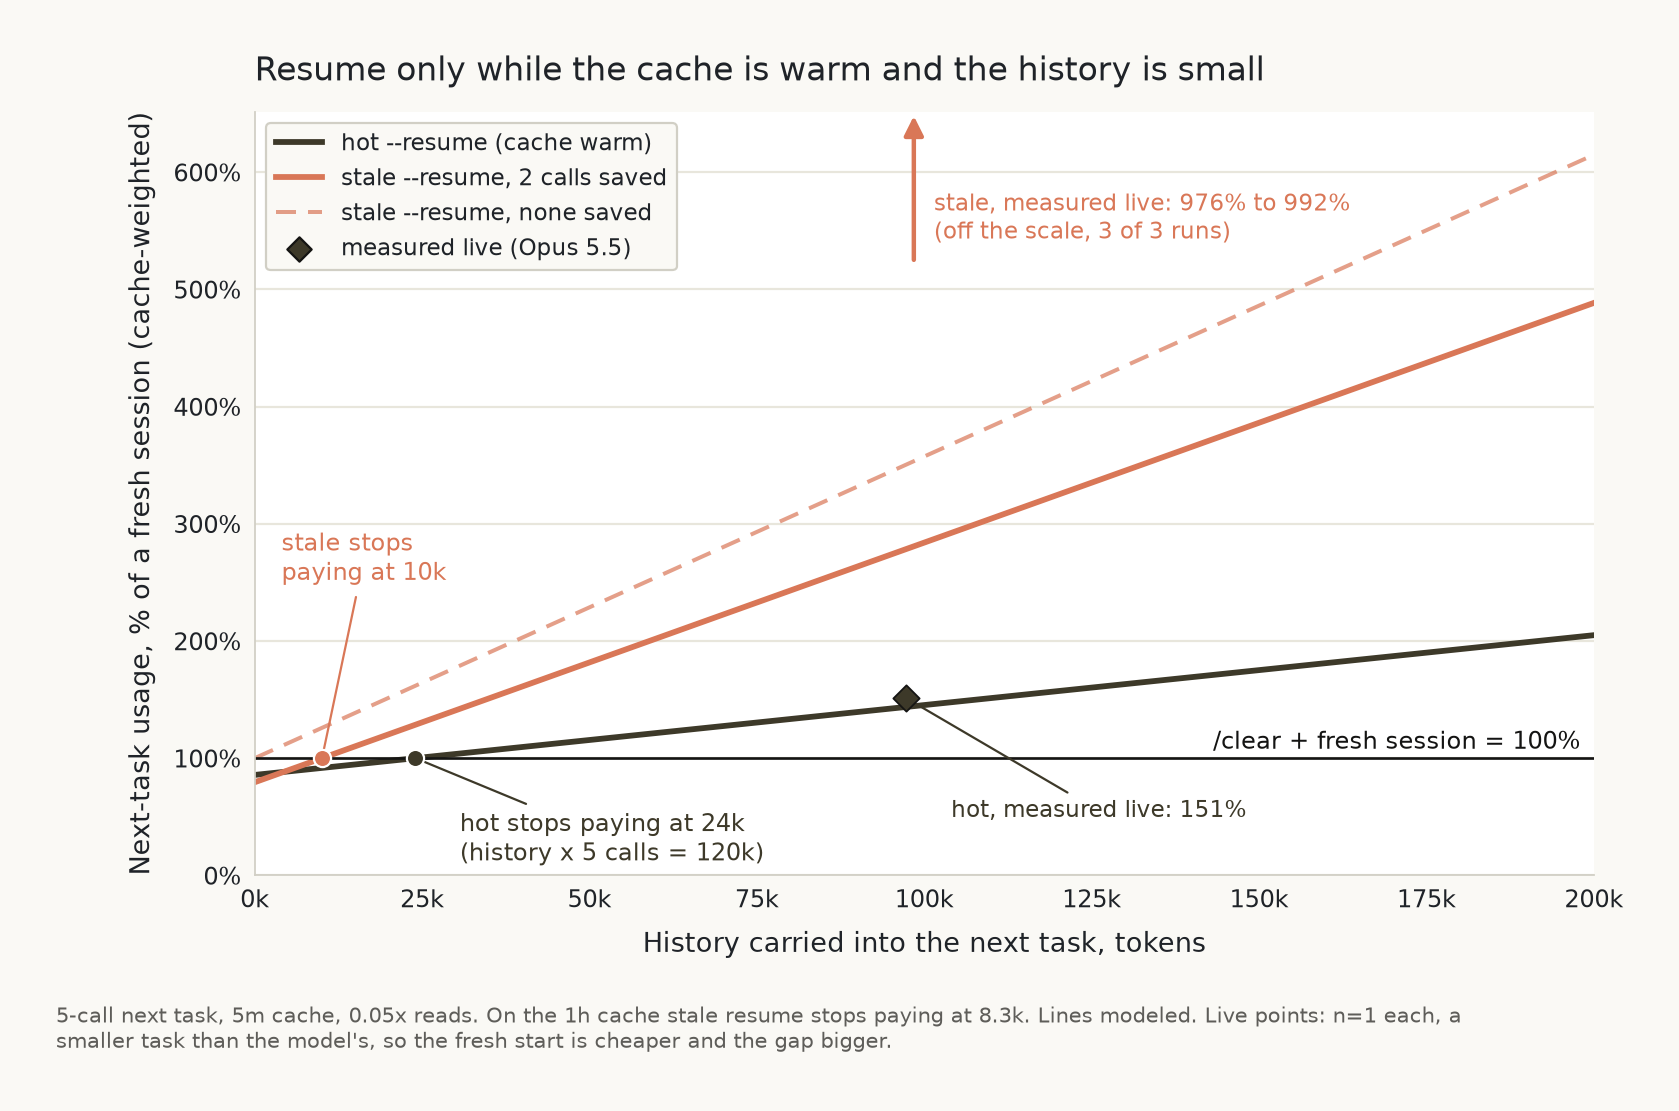
The multiplier scales with history size. At 97,000 tokens it is about 10x for a small next fix. A smaller session would jump less; a larger one would jump more. A 1-hour subscription cache would move the cliff, not remove it. (does this apply to you?)
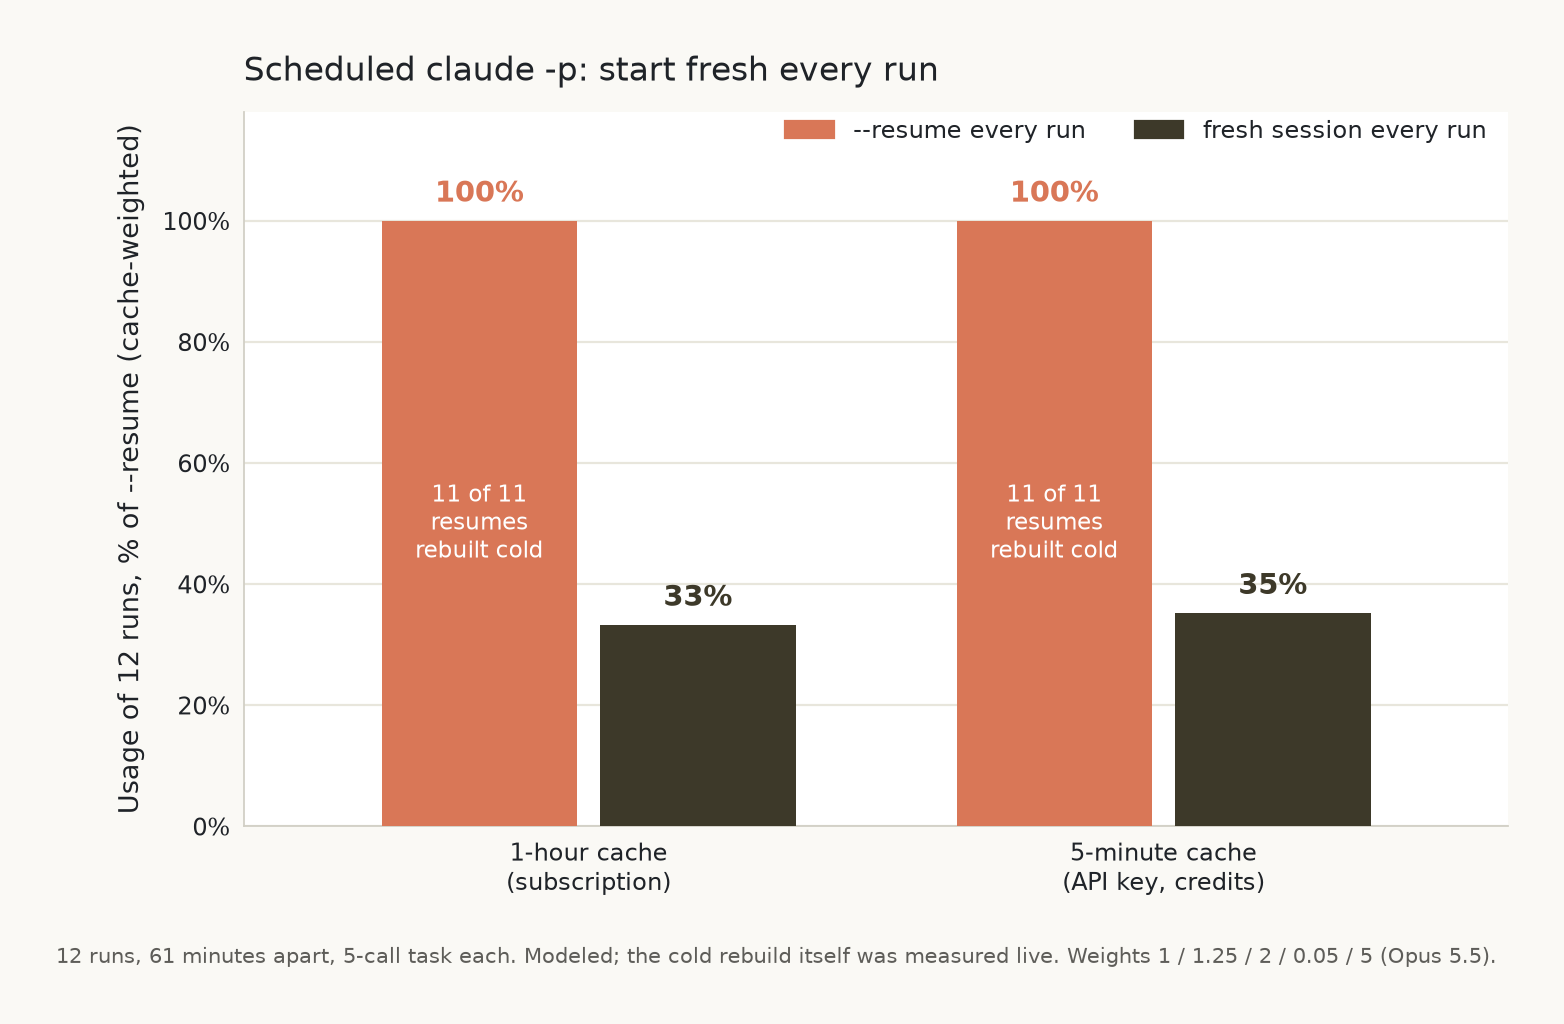
Scheduled claude -p jobs that use --resume across a gap longer than the cache are the same mechanism. The estimate is about 3x compared with a new session each run. That estimate was not tested live.
Compact before or after the break
/compact only helps if it runs while the cache is still warm. Then the summary is written cheaply, and the history you carry across the break is short.
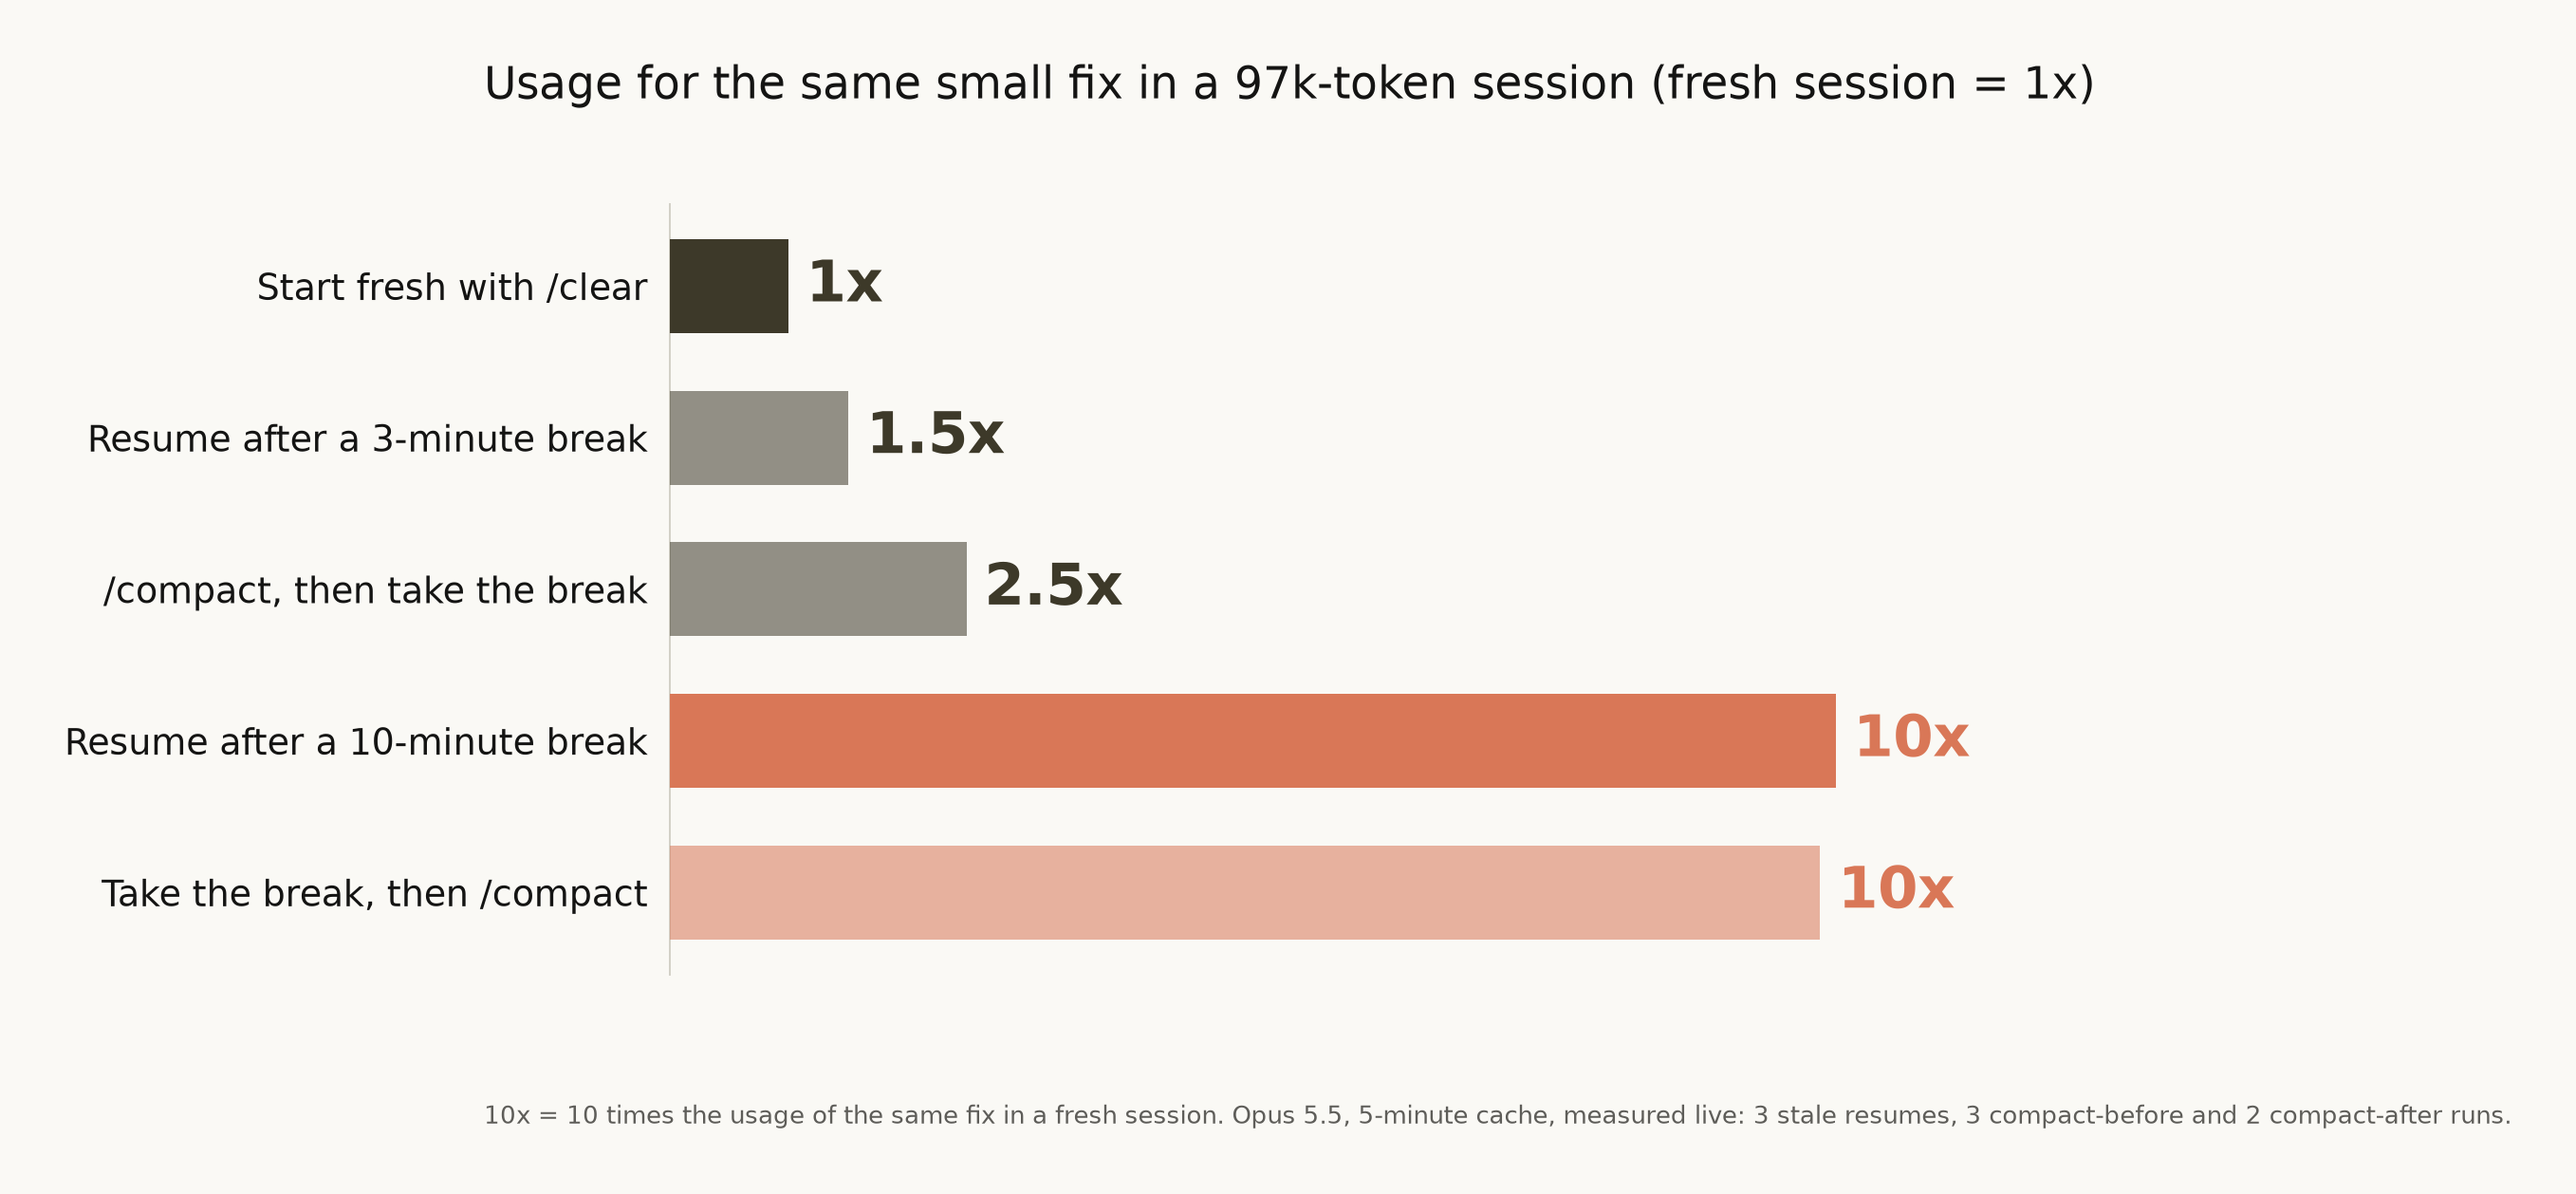
When you run /compact |
Next fix, vs a new session | n | What happened |
|---|---|---|---|
| Before the break, cache still warm | 2.5x (2.47x to 2.51x) | 3 | History is read from cache, then replaced by a short summary |
| After the break, cache already gone | 9.7x (9.2x to 10.3x) | 2 | The whole cold history is sent again, then summarized. The next fix is cheap, but you already paid |
Baseline: the same three new-session fixes (mean 12,571 units). Compact after a break does not beat just continuing the stale session (9.87x, n=3).
Does this apply to you?
Yes, if you use an API key or usage credits: the cache lasts 5 minutes, which is what we measured.
If you use a Pro, Max, or Ultra subscription, and you stay within the five-hour and weekly limits, the cache lasts 1 hour. The same miss is more expensive per token (a 1-hour cache write costs 2 times a plain input, not 1.25 times). You have more time before it happens. We did not measure the 1-hour cache live. At the 97,000-token history we used, the adjusted calculation says a miss past the hour is 11.0 times a new session (the 5-minute miss was 9.8 times).
claude -p and a sleeping laptop do not keep a process alive, so idle compact (which can summarize a large session before a 1-hour cache expires) does not run. A normal interactive session can, if the window stays open and idle compact is on.
Does the model hold up?
This section checks our calculations against the live tests.
The estimated rules (scheduled jobs, pause traps, long-session compact settings) come from the simulator. python3 -m cc_usage_study.validate scores it against every live run, with no API calls, in two versions. The original numbers are the ones used in this README. The adjusted version learns the task shape (calls per task, tokens per call, and the starting instructions already saved from earlier sessions) from the 3 new /clear sessions only.
Each run has a role. The new sessions are used to tune the adjusted calculation. The warm and stale continues are held-out checks: the adjusted calculation sees only the new sessions and the history size. The /compact runs are not held-out checks. They use each run's own summary size and post-compact prompt.
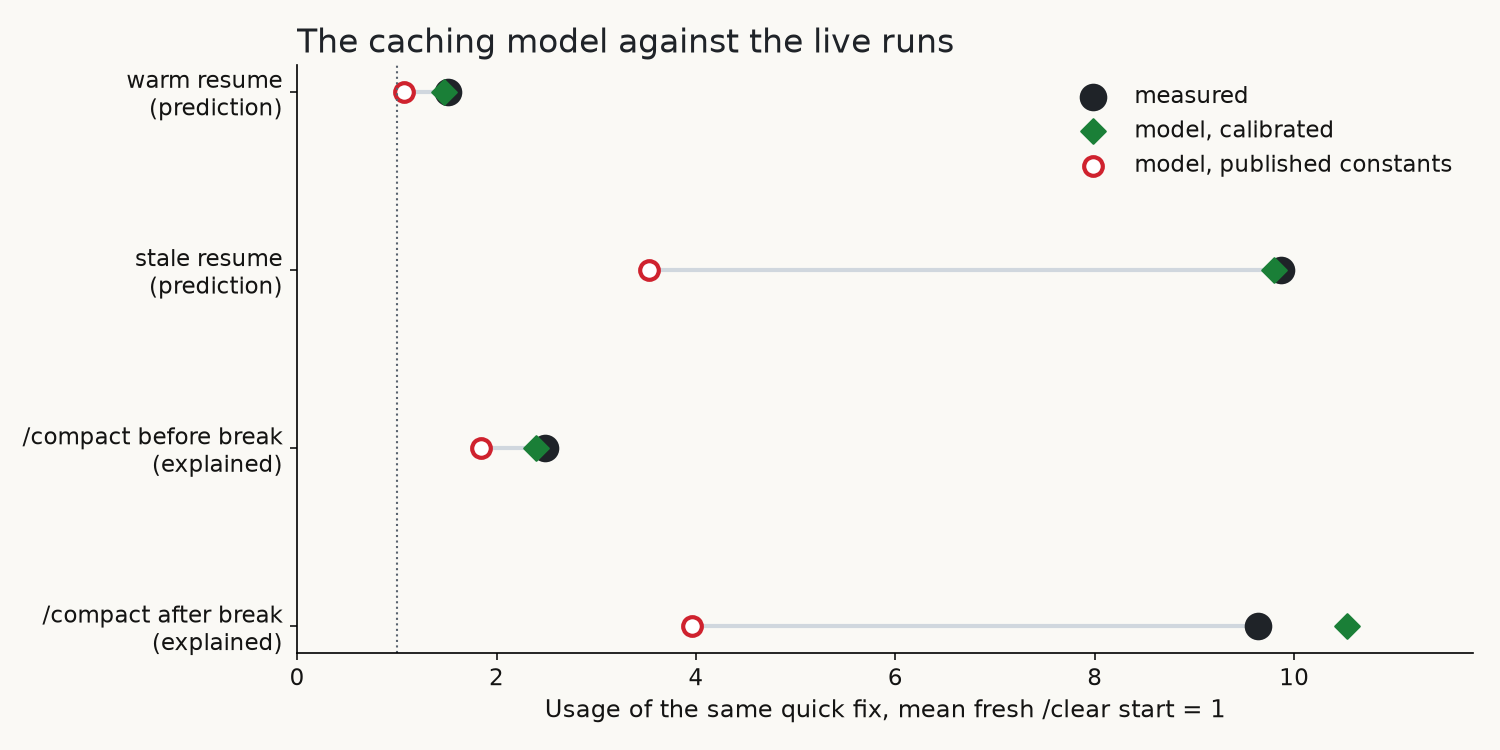
| Same small fix, mean new session = 1 | How we used this run | Measured | Original calculation | Adjusted calculation |
|---|---|---|---|---|
| Warm continue | held-out check | 1.51 | 1.07 | 1.47 |
| Stale continue | held-out check | 9.87 | 3.53 | 9.80 |
/compact before the break |
uses this run's own summary size | 2.49 | 1.84 | 2.40 |
/compact after the break |
uses this run's own summary size | 9.64 | 3.96 | 10.53 |
- The cache math matches the continues. All 4 continue runs in this check land within 3% with the adjusted shape. With the original numbers, none of the 4 were close (all were off by more than a quarter). This is still a weak test: 4 runs from one 97,000-token session. A stale continue is mostly one rewrite of the cold history, which any sound cache model gets right. The six later dose-response continues were not part of this check. They used the same new-session baselines and landed in the same two bands (1.49x to 1.52x inside the window, 9.76x to 9.92x after it).
- The original task shape is the problem. The original numbers put a new session at 4.5 times the measured cost. Most of that is the task shape: 5 calls with 2,000-token tails and 600 output tokens each, where the live fix took 3 calls with far smaller turns (fixing that alone leaves 2.1 times). The starting instructions already saved from earlier sessions (about 11,400 tokens) are the smaller part (fixing that alone leaves 3.4 times).
- What that changes (estimate; only 97,000 tokens was measured). The break-even point barely moves, but estimated continue penalties above it look too low. At 30,000 tokens of history, a stale continue costs +96% compared with
/clearplus 2 exploration calls, not the original +41%. At 60,000 tokens, it is +245%, not +102%. The break-even history barely moves (10,100 to 10,800 on the 5-minute cache, 8,300 to 8,700 on the 1-hour cache). /compactafter a break sent the cold history as plain input (1 times), not as a cache write (1.25 times), which is what the simulator assumes. That was read from these same runs.- The long-session compact calculation fails when we checked it against the live tests. We replayed the migration task from the default setting's measured path. The calculation gets the direction right on 2 of 4 trigger settings, and lands within 5 points on 1. It predicts -0.9% for
--autocompact 140000, where the live run measured +18.1%. It predicts +51.7% with 14 compacts for the stacked setting, where the live run measured +13.6% with 6. It prices a summary call at 21,600 units, against a measured 36,600 per compact. Real context growth is uneven (1 to 14 calls between compacts in one setting), so even growth places compacts in the wrong spots. Fitting summary size and extra calls on the same settings made it worse. Treat the settings section below as an idea to test, not as a result.
Full scores per run: outputs/validation.json.
Compaction, measured live
Shrinking history mid-session is not always cheaper, and some of the usage is hidden.
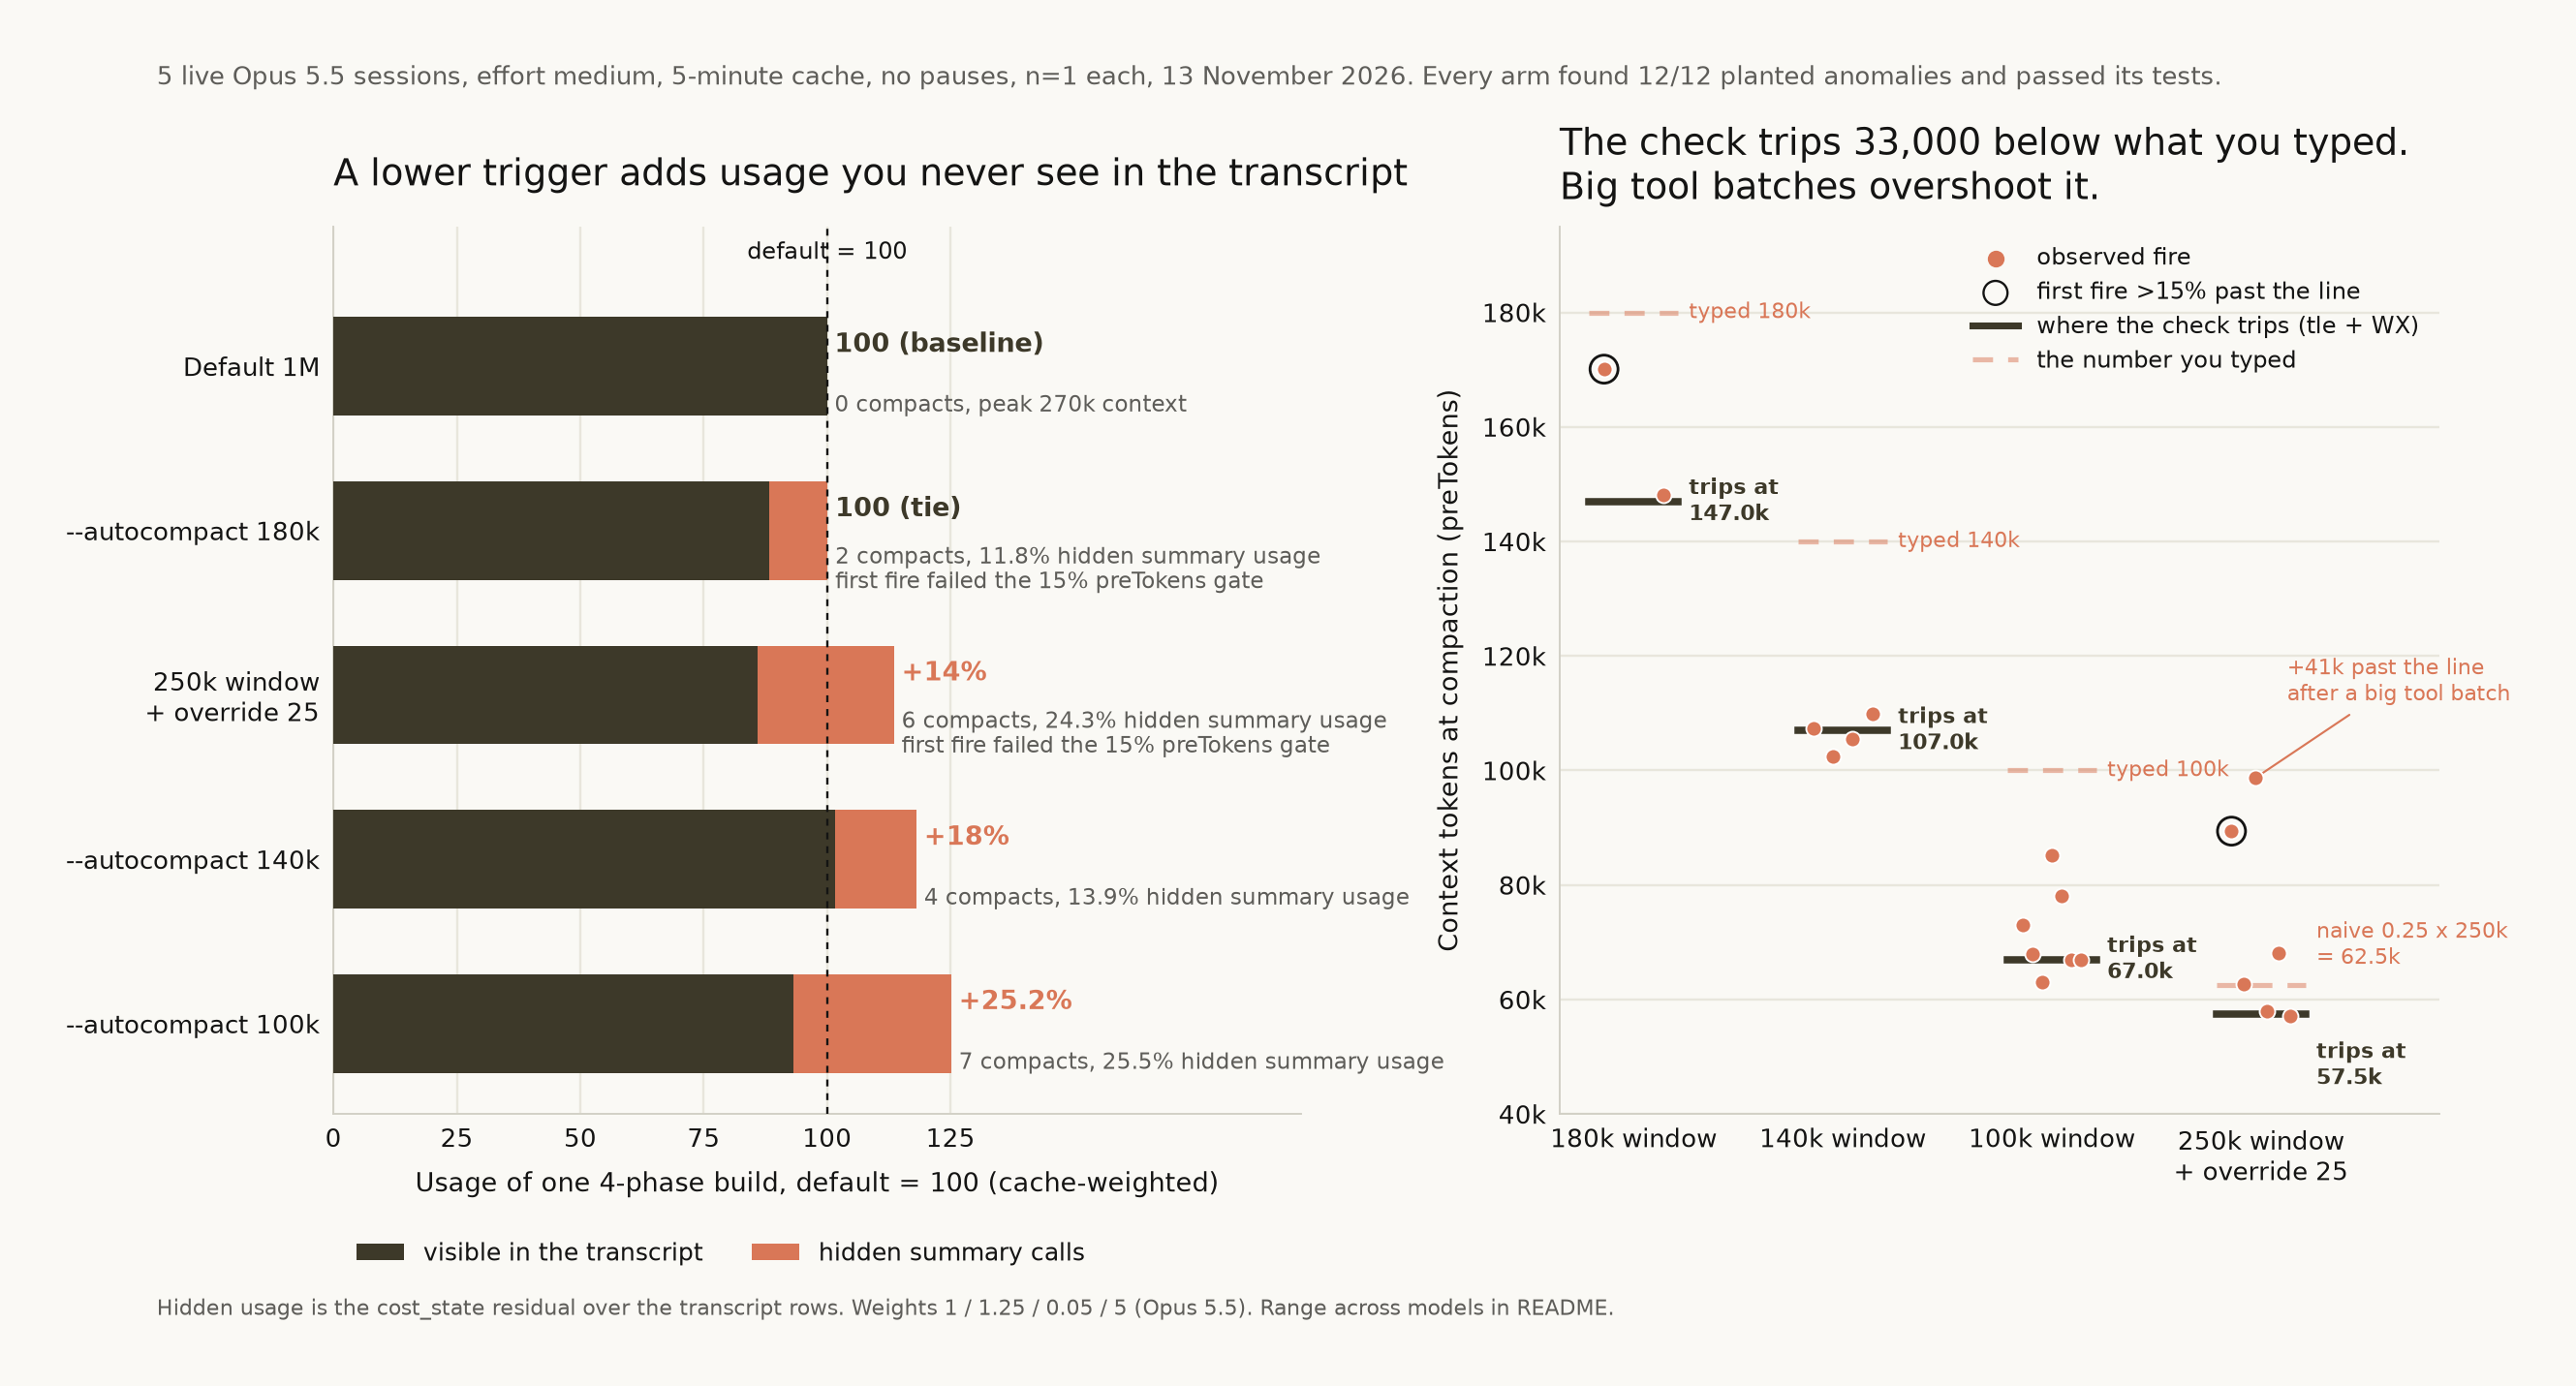
Every setting ran the same task: a 24-module migration over 4 --resume phases. Opus 5.5, effort medium, 5-minute cache, no long pauses, n=1 per setting, preliminary. Slate is what the log shows. Orange is summary traffic that only appears in Claude Code's own cost_state total.
- Fewer tokens is not less usage. The 100,000 setting sent 63% fewer raw tokens (2.27 million compared with 6.12 million) and used 25.2% more. Most of the default's tokens were cheap cache reads.
- Part of the usage is invisible. Summary calls were 11.8% to 25.5% of each compacting setting, about 36,600 units per compact on average.
- The ranking depends on the read weight. At 0.1x reads, the 180,000 setting comes out 13.6% under the default. The tie also assumes no pauses. One pause past the cache, at about 260,000 tokens of history, would add roughly 39% to the default setting (estimate).
- Quality held everywhere: all 5 settings passed the tests and the functional checker, and reported 12 of 12 planted anomalies.
| Setting | Fires at | Compacts | Usage, default = 100 | Hidden share | Raw tokens compared with default | At 0.1x reads | At 0.025x reads | 15% preTokens gate |
|---|---|---|---|---|---|---|---|---|
| Default 1M | 967,000 | 0 | 100 | 0% | 6.12M tokens | 100 | 100 | no fire |
--autocompact 180000 |
147,000 | 2 | 100 (tie, +0.1%) | 11.8% | -48% | -13.6% | +11.6% | fails (+15.7%) |
| 250,000 window + override 25 | 57,500 | 6 | +13.6% | 24.3% | -70% | -10.2% | +33.5% | fails (+55.5%) |
--autocompact 140000 |
107,000 | 4 | +18.1% | 13.9% | -42% | +1.0% | +32.5% | passes |
--autocompact 100000 |
67,000 | 7 | +25.2% | 25.5% | -63% | +0.1% | +46.2% | passes |
The order is not a smooth line at n=1 (57,500 beat 107,000 and 67,000). So "a lower trigger pays past a break-even length" is a claim from the calculation, not from this table.
Clear vs a warm session
For a few quick, related fixes, staying in the session used less than starting over each time.
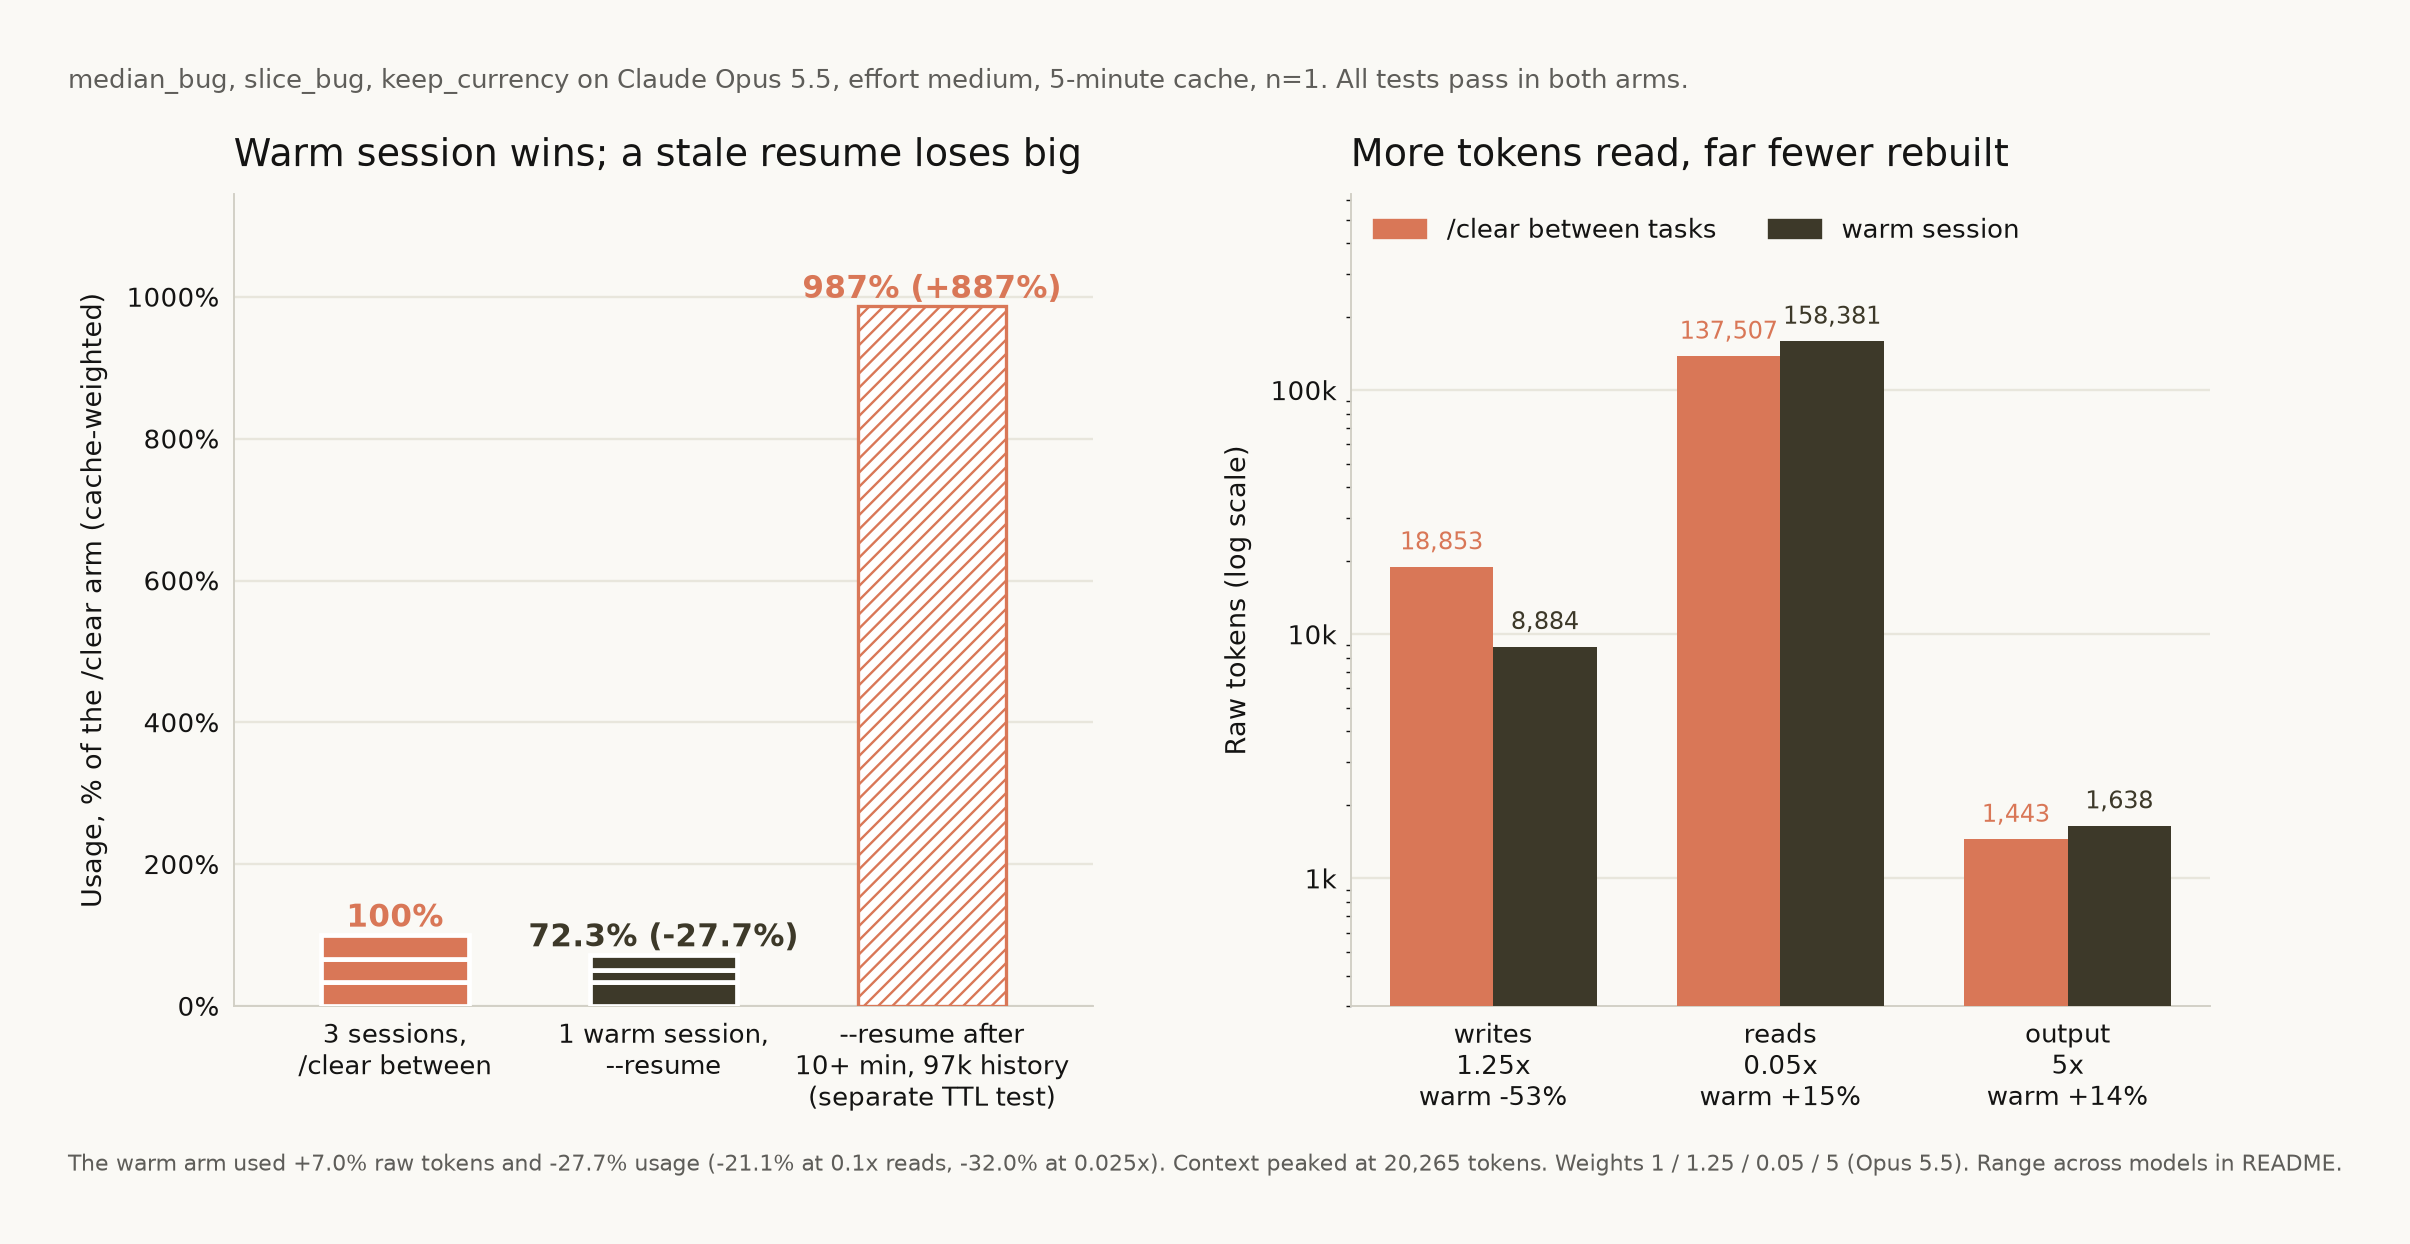
Three quick fixes, one after another, n=1, preliminary. Three new sessions compared with one session continued inside the cache time limit. The continued session read 7.0% more raw tokens but rebuilt 53% fewer, so it used 27.7% less (21.1% to 32.0% by model). Context peaked at 20,265 tokens. This only holds while history is small.
Three clients, one bugfix
The same fix in the Claude Code CLI, T3 Code, and Claude Desktop's Code tab.
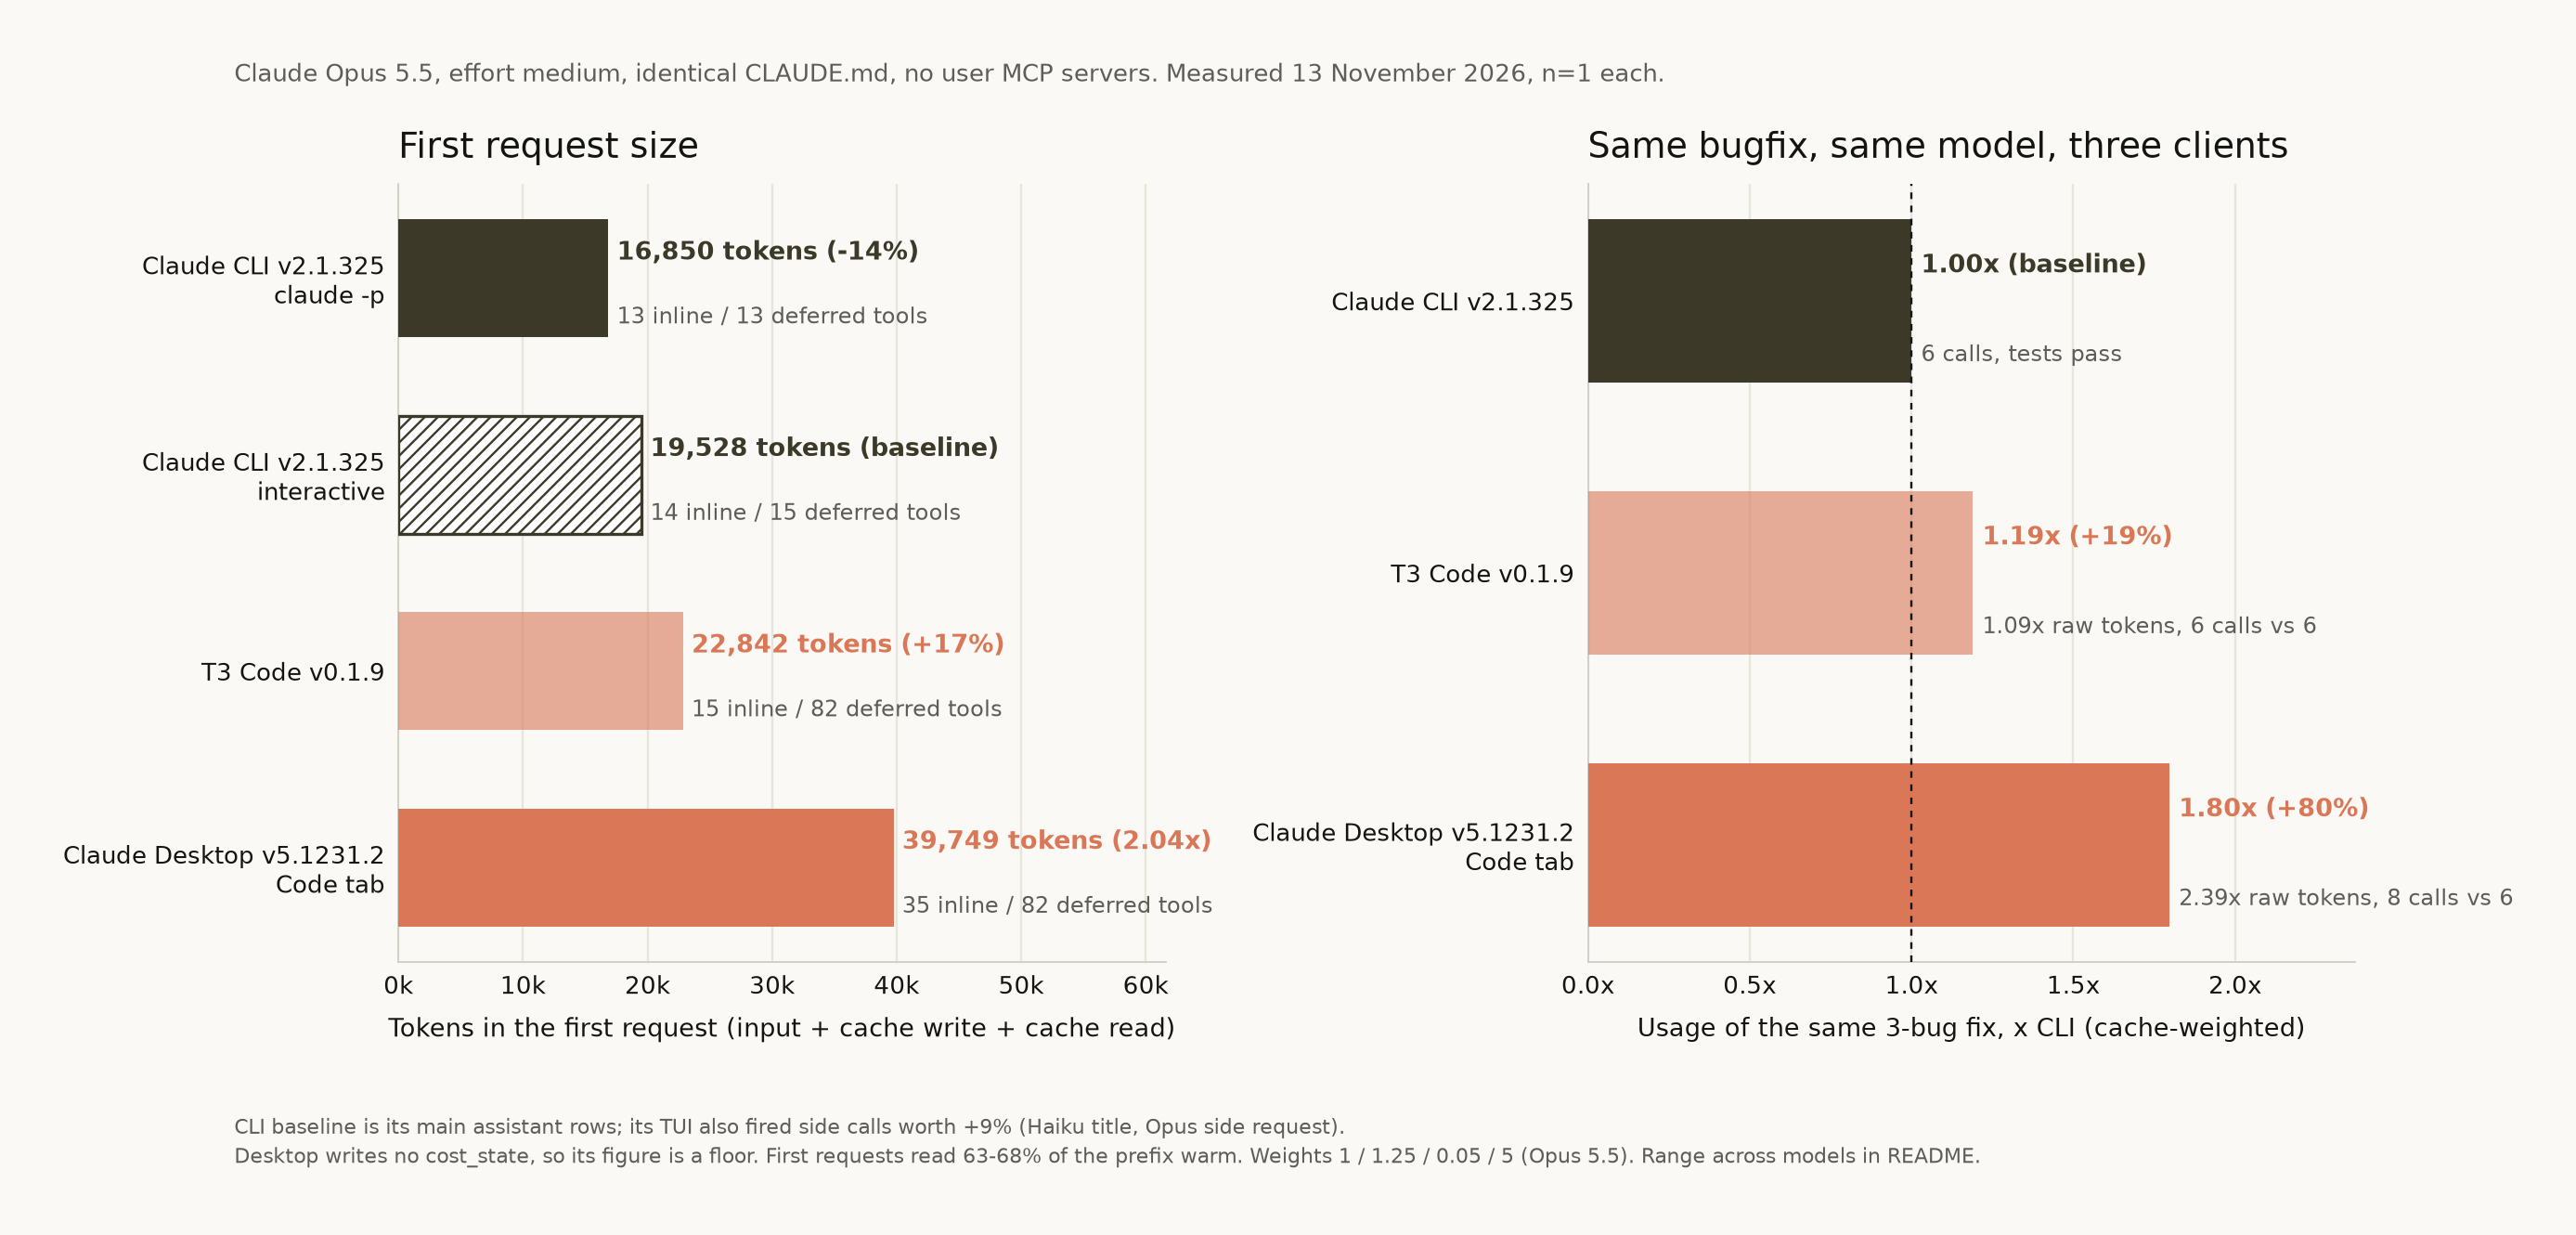
Same Opus 5.5, effort medium, identical 3-line CLAUDE.md, no user MCP servers, n=1 per client, preliminary. All three fixed all 3 planted bugs.
| CLI interactive | T3 Code | Desktop Code tab | |
|---|---|---|---|
| First request, tokens | 19,528 | 22,842 | 39,749 |
| Inline / deferred tools | 14 / 15 | 15 / 82 | 35 / 82 |
| Fix usage compared with the CLI | 1.00x | 1.19x (1.17x to 1.20x by model) | 1.80x (1.71x to 1.92x by model) |
T3 Code runs Claude Code through the Agent SDK and adds 67 deferred tools plus a longer system prompt. Desktop's Code tab carries a whole app (35 inline tools, 3.5 times the system prompt) and writes no cost_state row, so its number is at least 1.80 times the CLI. We did not measure the Claude chat app. Full table: benchmarks/client_comparison.md.
Where compaction actually fires
The number you type is not the point where compact actually runs.
Read from the Claude Code v2.1.325 binary. The number you type is not where it fires: subtract 33,000, and never stack two knobs. The first live compact fired 0.3% to 55.5% past the formula's threshold. The check runs between requests, and one large tool result can carry the context well past it.
effective_window = window - min(maxOutputTokens, 20000)
threshold        = effective_window - 13000                                    # no override
threshold        = min(floor(effective_window * pct / 100), effective_window - 13000)   # with CLAUDE_AUTOCOMPACT_PCT_OVERRIDE
| You set | It fires at |
|---|---|
| nothing, 1M window | 967,000 |
| nothing, 200k model | 167,000 |
--autocompact 180000 |
147,000 |
CLAUDE_AUTOCOMPACT_PCT_OVERRIDE=18, 1M window |
176,400 |
--autocompact 100000 |
67,000 |
250,000-token window and CLAUDE_AUTOCOMPACT_PCT_OVERRIDE=25 |
57,500 |
Idle compact summarizes a big session at about 90% of the cache time limit, before the cache expires. It only runs when all of these hold: idleCompaction is on (default since v2.1.299), the session is on the 1-hour cache (never on API keys), the process is still alive (not a sleeping laptop or a finished claude -p), and context is at least CLAUDE_CODE_IDLE_COMPACT_MIN_TOKENS (200,000 by default, 100,000 at the lowest). --autocompact 180000 keeps you under 200,000, so pair it with CLAUDE_CODE_IDLE_COMPACT_MIN_TOKENS=100000 if you take long breaks with the terminal open.
Compaction settings and sweet spots
This section is a set of ideas to test, not a result. The compact calculation failed when we checked it against the live tests (see the check above), so do not treat these as savings.
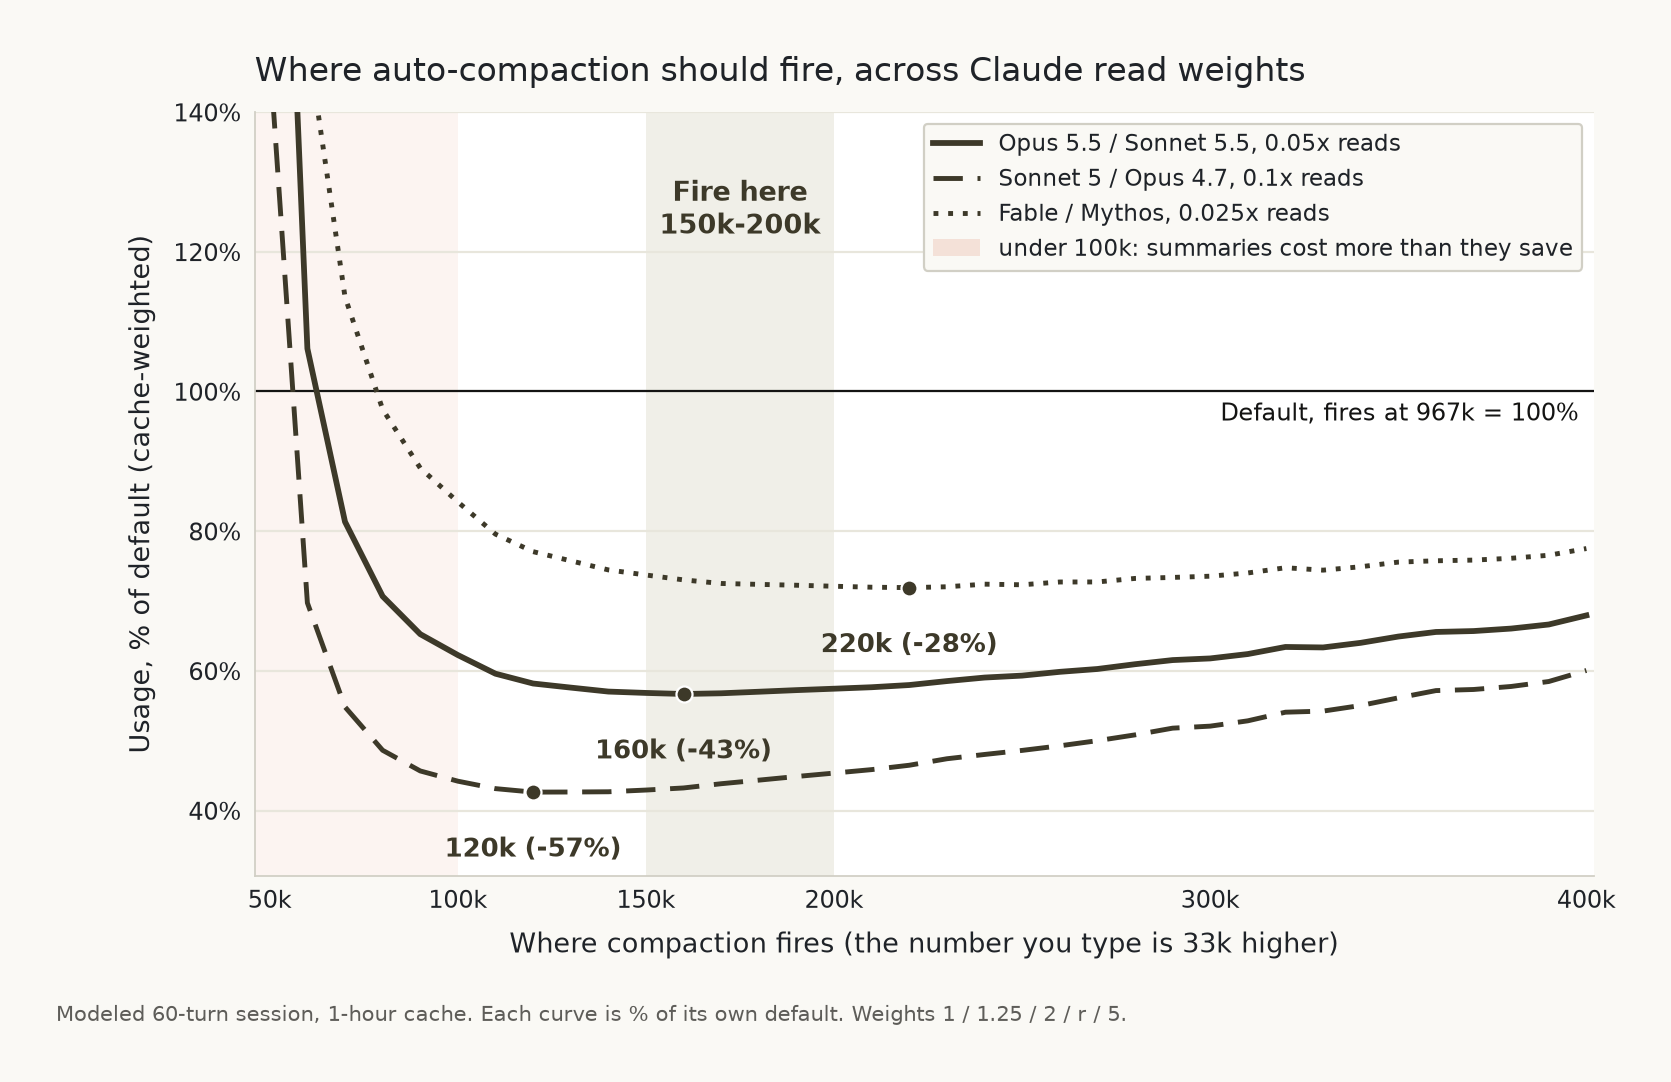
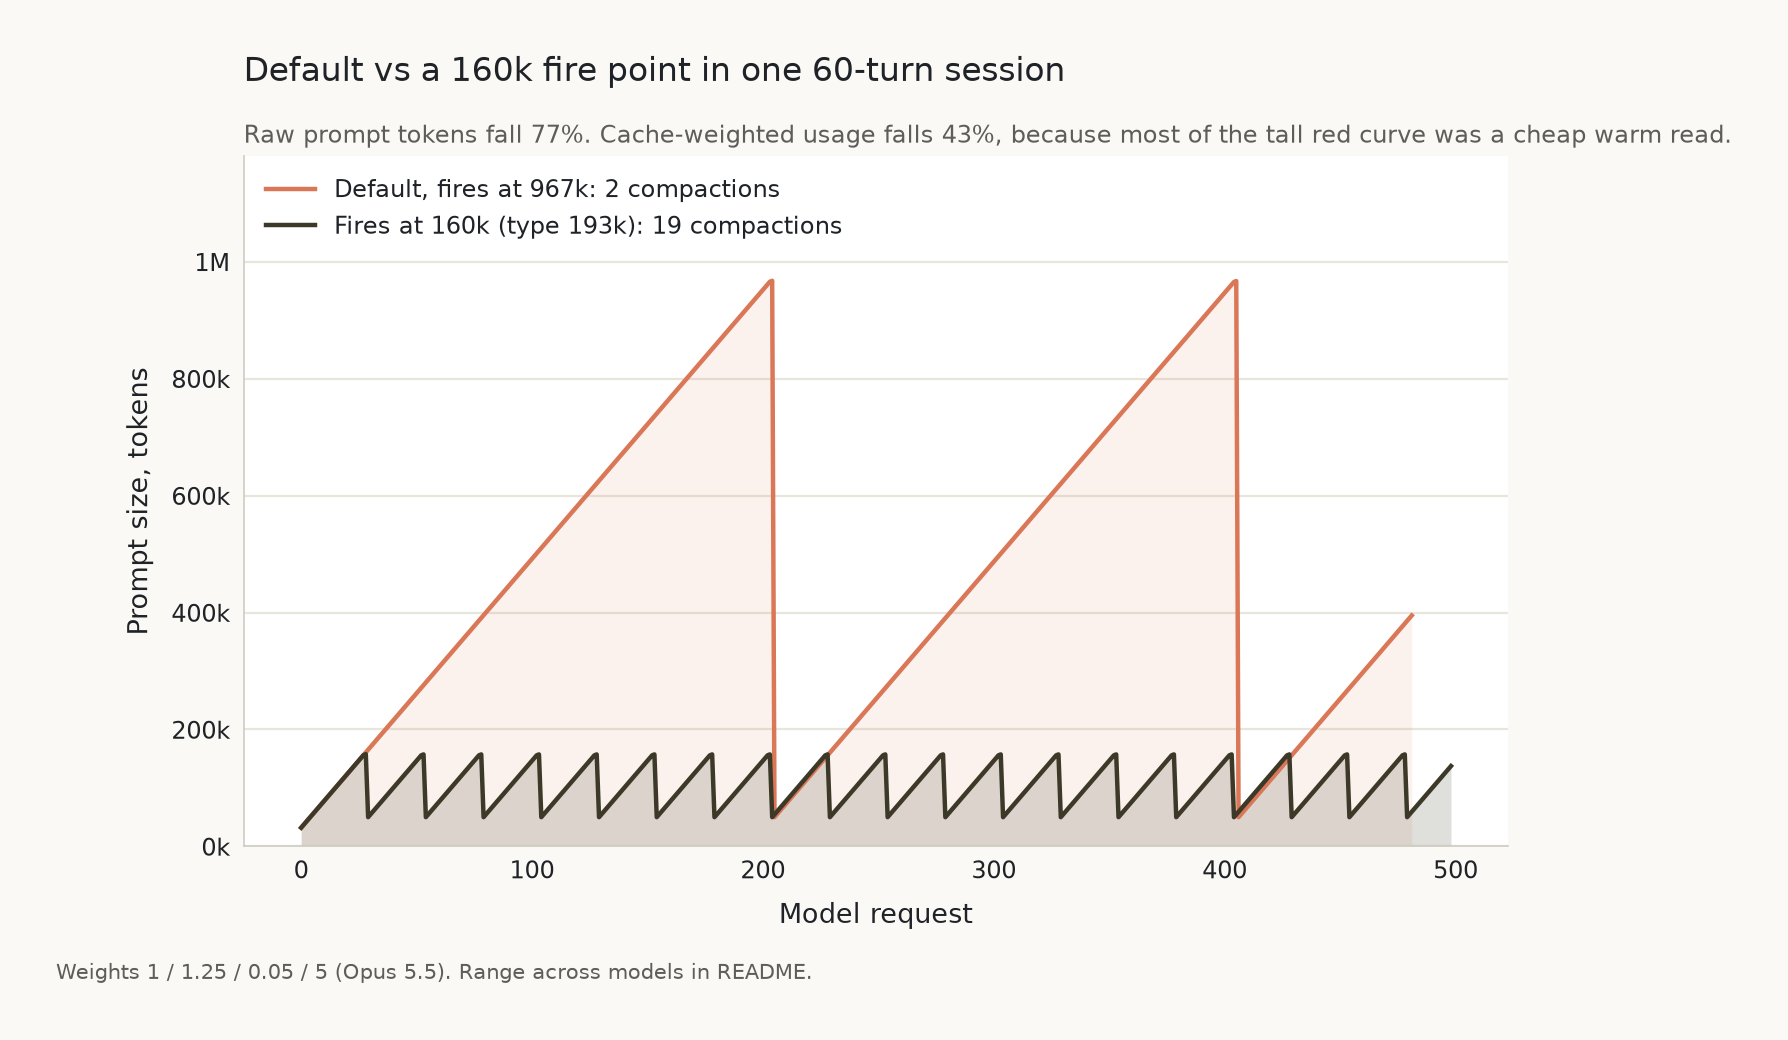
The main idea: for a long session headed past 300,000 tokens, claude --autocompact 180000 is estimated at about 43% less. Live, it tied the default on a 270,000-token session (n=1, no pauses). If you try it and take long breaks with the terminal open, pair it with CLAUDE_CODE_IDLE_COMPACT_MIN_TOKENS=100000.
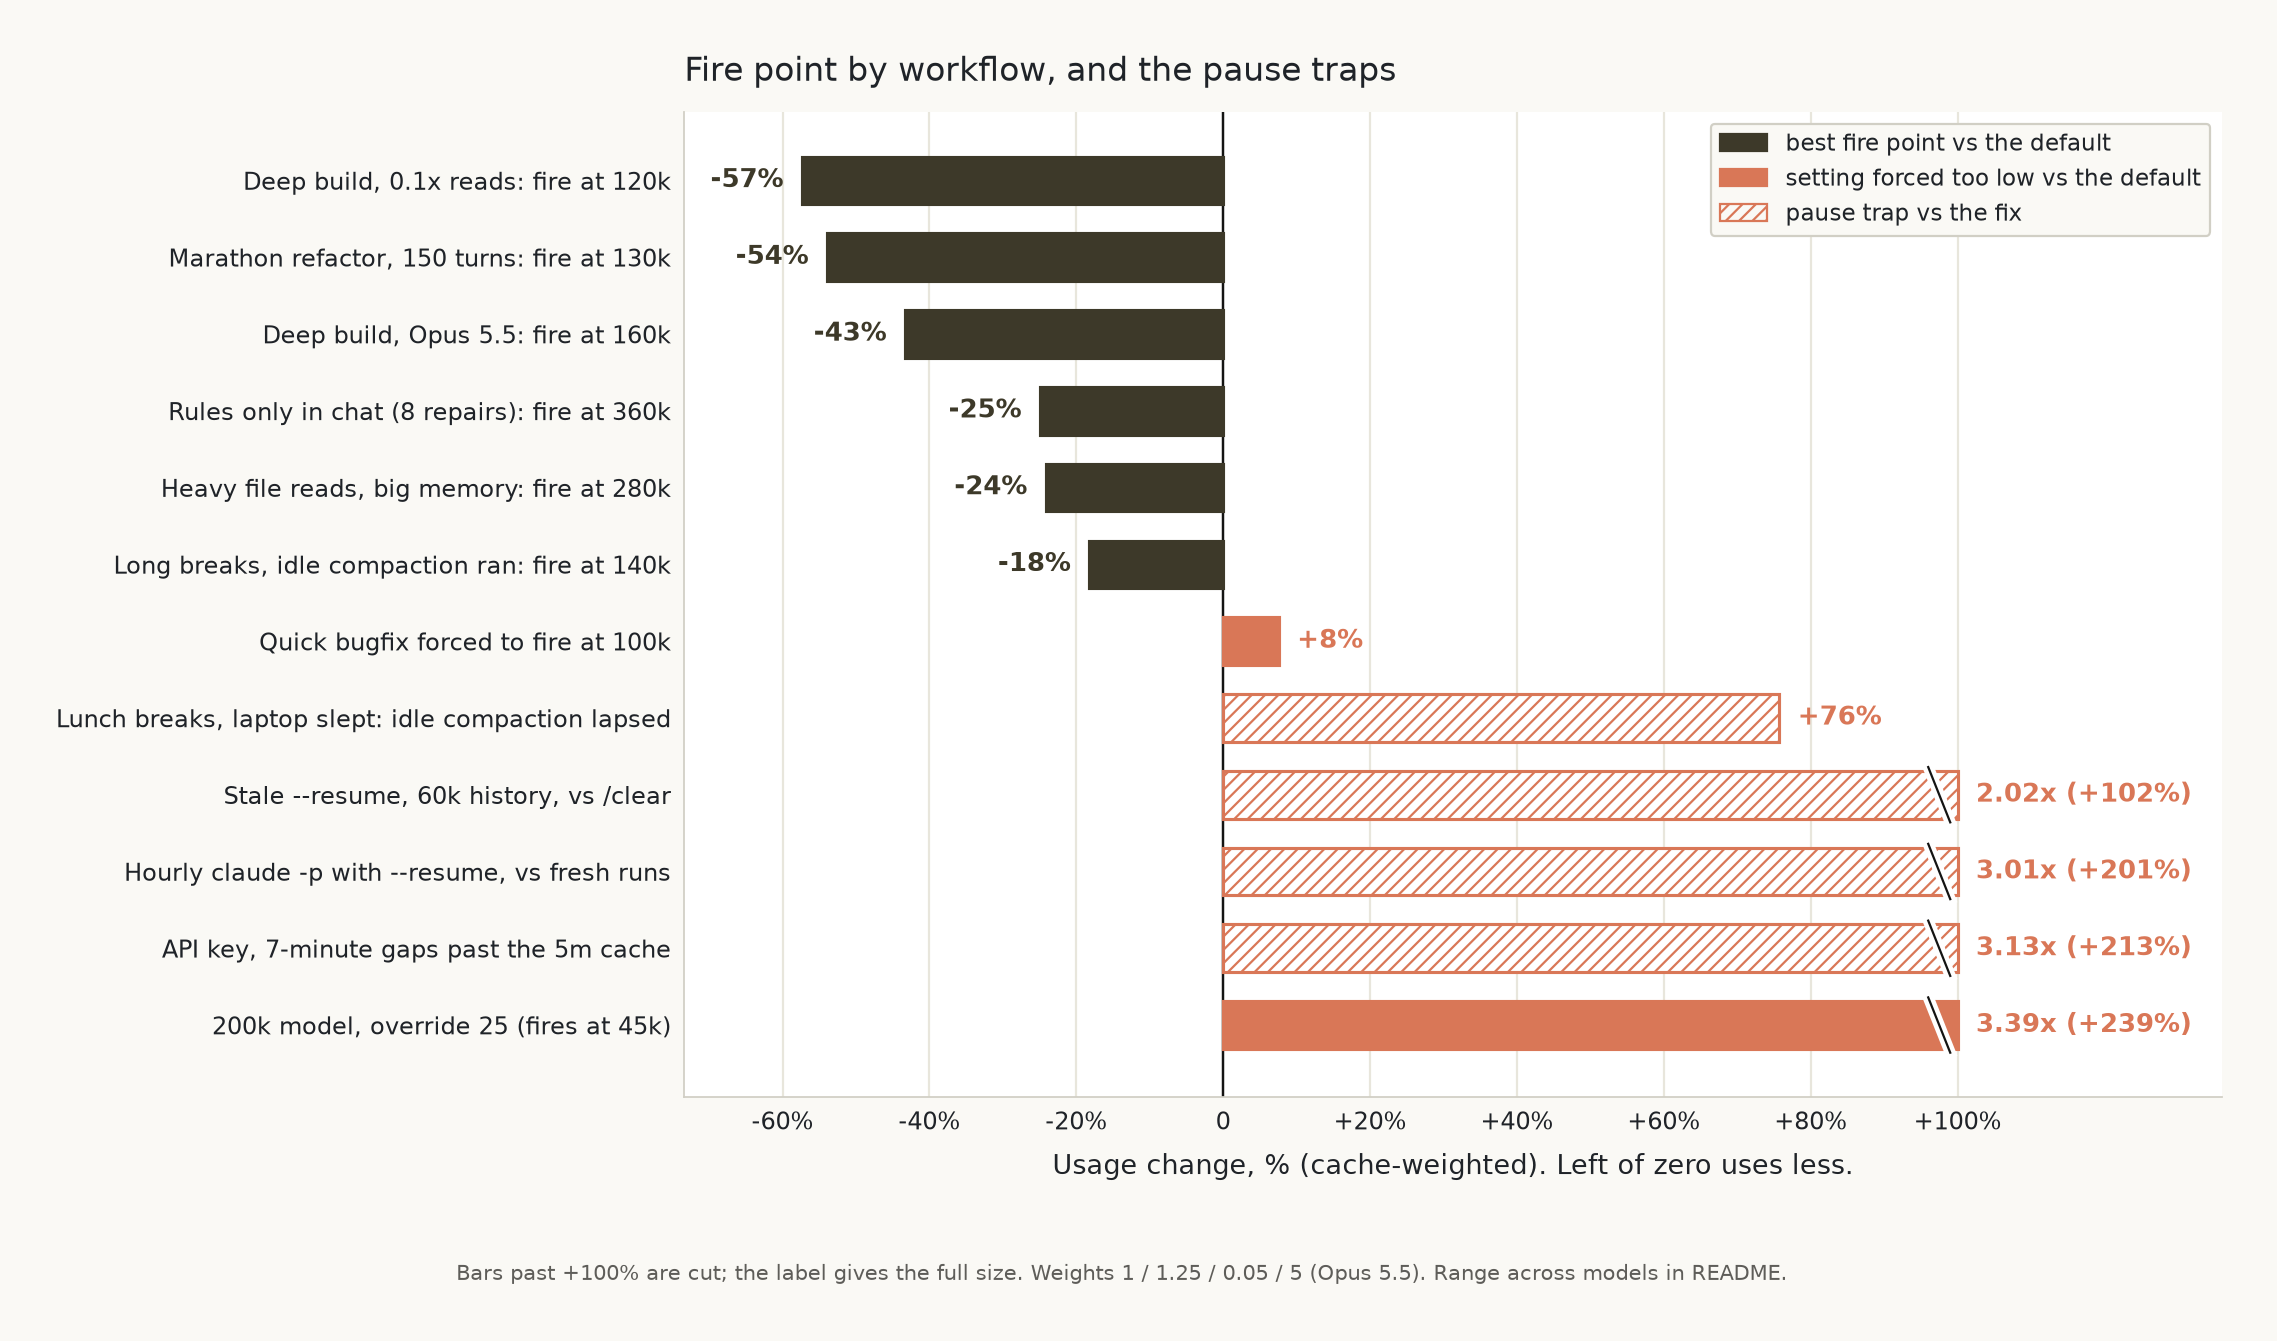
| Workflow | Best fire point | You type | Usage compared with that workflow's default |
|---|---|---|---|
| Deep feature work, 0.1x reads (Sonnet 5, Opus 4.7) | 120k | 153,000 | -57% |
| Deep feature work, Opus 5.5 / Sonnet 5.5 | 160k | 193,000 | -43% |
| Marathon refactor, 150 turns, smaller steps | 130k | 163,000 | -54% |
| Heavy file reads, big working memory | 280k | 313,000 | -24% |
| Rules that live only in the chat, 8 repairs per compact | 360k | 393,000 | -24.9% |
| Workday with long breaks, idle compact ran | 140k | 173,000 | -18% |
| Quick bugfix | no trigger is reached | leave it | 0%, or +8% if forced to fire at 100k |
| 200k-context model | leave the 167,000 default | leave it | +239% with override 25 (fires at 45,000 and thrashes) |
| Trap | Compared with | Usage |
|---|---|---|
| Lunch breaks, laptop slept, idle compact did not run | the same day with idle compact running | +76% |
| API key, 7-minute gaps past the 5-minute cache | the same session answered within 2 minutes | +213% |
Stale --resume with 60,000 tokens of history |
/clear plus a handoff, 2 extra exploration calls |
+102% (+245% adjusted) |
Hourly claude -p with --resume |
a new session every run | +201% |
Long tool output
A long test log costs you after Claude has read it, because it stays in the chat.
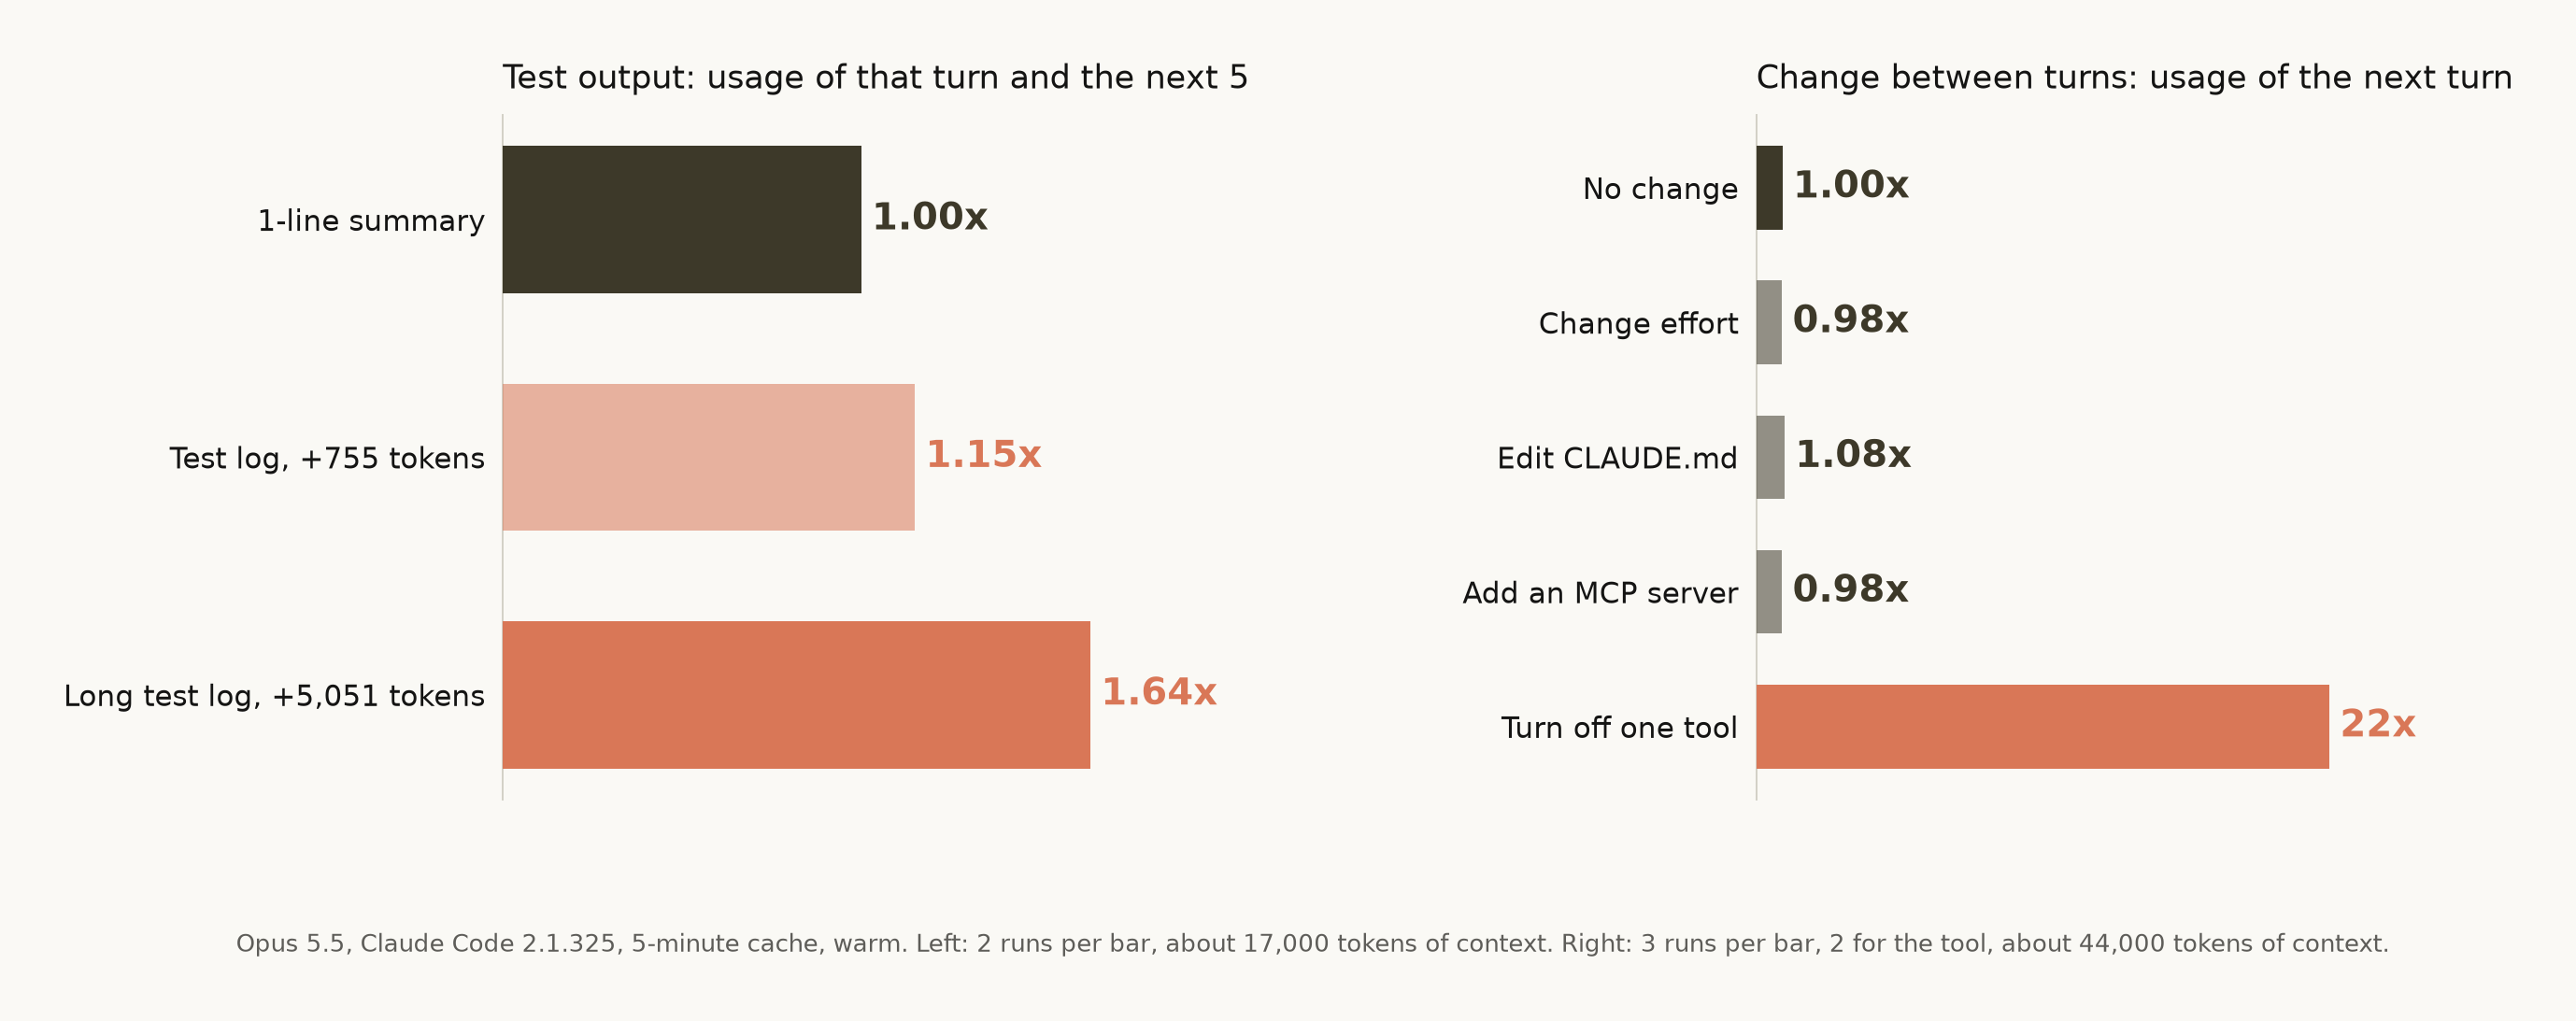
A new session runs a failing test suite once and reports the result in one line. Then it answers 5 short questions with no tools, a few seconds apart, so the cache stays warm. Only the test output changes: a 1-line summary (48 tokens), a normal failing pytest log (803 tokens), or a long log with tracebacks and captured logs (8,602 tokens). Claude Code cut the long log to about 10,000 characters before it went into the chat. Opus 5.5, n=2 per arm, preliminary, about 17,000 tokens of context. Every run named the same 3 failing tests.
| Test output | Extra tokens in the chat | That turn | Next 5 turns | All 6 turns |
|---|---|---|---|---|
| 1-line summary | 0 | 1.00x | 1.00x | 1.00x |
| Normal log | 755 | 1.15x | 1.16x | 1.15x |
| Long log | 5,051 | 1.88x | 1.33x | 1.64 times |
The log is written to the cache once, then read again on every later turn. Part of the gap in the next 5 turns is longer answers after a long log. Without output tokens the gap is 1.08x and 1.29x. These sessions were small, so the log is a large share of each turn. In a bigger session the share is smaller, but the extra tokens per turn stay the same. After a break the cache expires, and the log is written to the cache again with the rest of the chat.
Switching models, effort, or tools
This section checks whether changing settings between turns throws the cache away.
Switching models: from Anthropic's docs, not measured. The Claude Code docs say each model has its own cache. After /model, the next request reads the whole chat with no cache hits. Our live runs use only Opus 5.5, so we did not test it.
The closest test on Opus 5.5: turning off one tool. We turned off one built-in tool (--disallowedTools Edit) between turns. That changes the tool list at the very start of the prompt, so nothing after it matches the cache. This is the same effect the docs describe for a model switch. The next turn read 0% from the cache, wrote about 43,700 tokens again, and used 22x a normal turn (21.8x to 22.2x, n=2, preliminary).
Changing effort did not break the cache. Medium to high: 0.98x of a normal turn. High back to medium: 0.95x. 99.7% or more was read from the cache (n=3). The docs say Opus 5.5 keeps the cache when effort changes. On many older models it does not.
Each session read 2 log files (about 44,000 tokens of context), then answered one short question per turn with no tools. Each turn was a new claude -p --resume run a few seconds after the last one. One thing changed before each test turn. Control turns changed nothing. Each change is compared with the average of the control turns in the same session.
| Change between turns | Next turn compared with a normal turn | Read from cache |
|---|---|---|
| No change | 1.00x | 99.1% to 99.9% |
| Change effort, medium to high | 0.98x (0.96x to 1.00x) | 99.7% |
Edit one line of CLAUDE.md |
1.08x (1.00x to 1.19x) | 99.5% |
| Add an MCP server with 1 tool | 0.98x (0.97x to 1.00x) | 99.6% |
| Turn off one built-in tool | 22x (21.8x to 22.2x) | 0% |
Claude Code 2.1.325 did not change the start of the prompt for a CLAUDE.md edit or a new MCP server. It added the new CLAUDE.md at the end of the chat as a note that the instructions changed. It listed the new MCP tool at the end as a deferred tool (tool search). So the rest of the chat still matched the cache. An edit to CLAUDE.md only reaches Claude after a restart, /clear, or /compact (docs). We tested the restart case: --resume in a new process. The docs say that with tool search turned off, adding an MCP server does break the cache. We did not test that. n=3 per change, one session size, Opus 5.5.
Honest limits
This section lists what this study cannot claim.
- Small n. The cache-expiry curve is the best-supported result, and even there each pause length has only a few runs. Many other settings were tested once (n=1). Findings with n under 3 are marked preliminary. We report min-to-max ranges, not confidence intervals, except where n is large enough to say otherwise.
- Small sessions for some tests. The tool-output and between-turn tests used about 17,000 and 44,000 tokens of context, with a warm cache.
- One model, small tasks, one cache time limit. All live runs used Opus 5.5 on the 5-minute cache. 1-hour cache numbers are estimates.
- The cache-expiry runs used
claude -p --resume, not an interactive terminal. The cache rule is the same. An open terminal can also run idle compact on a 1-hour cache, which these runs do not. - Ratios compared with a small fix look larger. The 10 times figure is compared with a 3-call fix. The extra cost per carried token is the number that still holds for a bigger next task.
- These units are not your subscription bill. Units follow API list prices. Subscription limits use weights Anthropic does not publish.
- The compact calculation failed when checked against the live tests. See the check above.
- The short-task check is narrow. 4 held-out checks from one session, one history size, and one model. It shows the cache math is right. It does not show that every estimated number is right.
- Two of the five compact settings fail the repo's own validity check.
More on method and open questions: FINDINGS.md.
Reproduce
These commands rebuild the study on your machine.
python3 -m pip install -e ".[dev]"
python3 -m cc_usage_study.pipeline        # analyze, check, simulate, figures, validate, verify; one command
python3 -m pytest -q
Run the analyzer on your own logs, and keep the output outside git:
python3 -m cc_usage_study.pipeline --projects ~/.claude/projects --split-date YYYY-MM-DD --out ./local-out
The analyzer copies summary numbers only, never prompt text. Read preTokens on your first compact_boundary. If it does not match the table in where compaction actually fires, your setting is not the one you think.
- Clients: Claude CLI v2.1.325, T3 Code v0.1.9 (Agent SDK wrapping Claude Code v2.1.325), Claude Desktop v5.1231.2 (Code tab, bundled Claude Code v2.1.321).
- Model
claude-opus-5-5, effortmedium, 1M context,maxOutputTokens128,000. - Cache-weighted units are the logged list-price cost divided by the Opus 5.5 input price. Pricing snapshot 13 November 2026, pricing page.
- "Hidden" usage is
cost_state.totalCostUSDminus the deduplicated assistant rows in the same transcript.
outputs/live_experiments.json |
All live runs, sanitized |
outputs/summary.json |
Every estimated number |
outputs/validation.json |
The calculation scored against every live run |
src/cc_usage_study/ |
Extractor, caching model, simulator, validation, charts |
benchmarks/protocol.md |
How the live runs were set up, and the validity gate |
benchmarks/client_comparison.md |
The full client table |
docs/reference.md |
Knobs, model windows, caching, the traps |
docs/examples.md |
The arithmetic behind a single session |
docs/article-draft.md |
The long-form essay |
Anthropic docs
- Prompt caching in Claude Code: which requests get the 5-minute or 1-hour cache, and how to choose it
- Prompt caching on the API: cache lifetime, 1-hour cache, write and read multipliers (pricing)
- Manage costs in Claude Code and context window
- Commands:
/compact,/clear,/usage - Claude Code with a Pro, Max or Ultra plan (five-hour and weekly limits) and usage limit best practices
- API rate limits
Credits
Live experiments ran on Claude Opus 5.5. The analysis was driven by Grok Bot 4.7 and Claude Fable 5.2. Writing was AI-assisted, and then edited.
License
MIT. See LICENSE.
Yorumlar (0)
Yorum birakmak icin giris yap.
Yorum birakSonuc bulunamadi