prompilot
Health Warn
- License — License: Apache-2.0
- Description — Repository has a description
- Active repo — Last push 0 days ago
- Low visibility — Only 5 GitHub stars
Code Pass
- Code scan — Scanned 12 files during light audit, no dangerous patterns found
Permissions Pass
- Permissions — No dangerous permissions requested
No AI report is available for this listing yet.
Chat-driven Prometheus visualization with one-click Grafana export. Self-hosted, single image, bring your own LLM.


Chat-driven Prometheus visualization with one-click Grafana export.



PromPilot connects to your Prometheus, discovers your metrics, and lets you
build charts by asking for them in plain language. Every panel it creates can
be exported as a Grafana dashboard. It runs as a single Docker container with
no cloud dependency — bring your own LLM, including local ones via Ollama or
vLLM.
Status: early — 0.1. Everything below works; expect rough edges and
breaking changes before 1.0.
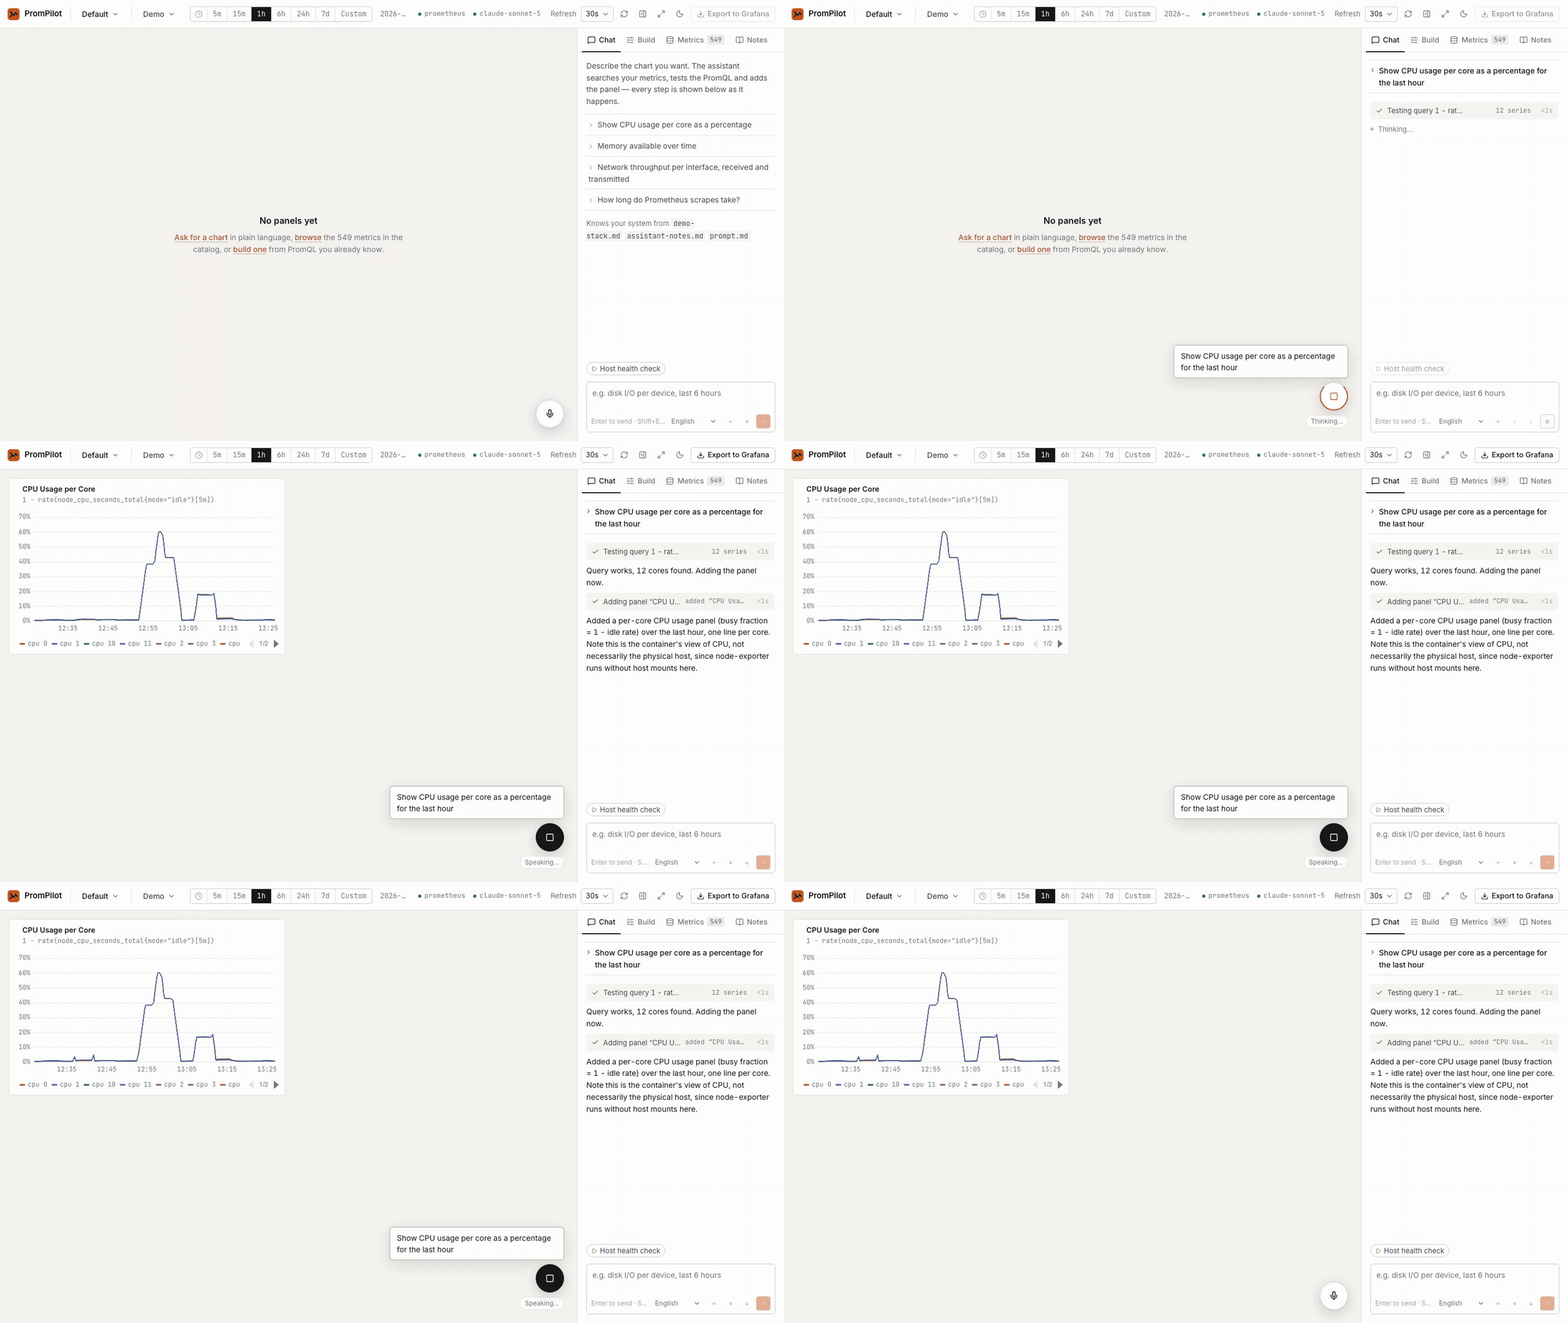
Hands-free: press the voice button, ask for a chart, watch the assistant test the PromQL and add the panel. MP4 · light / dark screenshots.
Why
Grafana is great at rendering dashboards, but building them still means
knowing which of your 5,000 metrics to pick and how to write the PromQL.
PromPilot adds a conversational layer on top:
- Metric catalog — metrics are discovered, categorised and indexed
automatically, so "show me CPU per core" findsnode_cpu_seconds_total
without you memorising exporter names. Works without an LLM. - Chat → panel — ask for a chart; the LLM picks the metric, writes and
dry-runs the PromQL, and emits a validated panel spec. Rendering is
deterministic — the model never writes chart code. - Grafana export — download the resulting dashboard as Grafana JSON and
import it. PromPilot is an add-on layer, not a replacement.
Quick start
docker run -d -p 8080:8080 \
  -e PROMETHEUS_URL=http://your-prometheus:9090 \
  -e LLM_BASE_URL=http://ollama:11434/v1 \
  -e LLM_MODEL=llama3.1 \
  -v prompilot-data:/data \
  ghcr.io/ismailperim/prompilot:latest
Open http://localhost:8080.
Don't have a Prometheus handy? The repository ships a demo stack with
Prometheus and node-exporter:
git clone https://github.com/ismailperim/prompilot.git
cd prompilot
docker compose up -d
Add --profile grafana to also start Grafana (for testing exports) or--profile ollama for a local LLM.
Configuration
All configuration is via environment variables.
| Variable | Default | Description |
|---|---|---|
PROMETHEUS_URL |
— | Prometheus (or Thanos/Mimir/VictoriaMetrics) for the first project, created on first start. Optional once projects exist. |
PROMETHEUS_USERNAME / PROMETHEUS_PASSWORD |
— | Optional basic auth. |
PROMETHEUS_TLS_VERIFY |
true |
Verify the Prometheus TLS certificate. Default for new projects; each project can override it in its settings. |
PROMETHEUS_CA_FILE |
— | Extra CA bundle (PEM) trusted for Prometheus connections, e.g. a corporate root; mount the file into the container. |
PROMETHEUS_QUERY_TIMEOUT |
30s |
Timeout applied to every Prometheus call. |
PROMETHEUS_MAX_DATA_POINTS |
1000 |
Upper bound on points per series; the query step is derived from it. |
LLM_PROVIDER |
openai |
openai (any OpenAI-compatible endpoint), azure, anthropic, gemini. See docs/llm-providers.md. |
LLM_BASE_URL |
— | For openai: the endpoint (OpenAI, Ollama, vLLM, LM Studio, OpenRouter, gateways…). Chat is disabled when the provider is not configured. |
LLM_MODEL |
— | Model name, e.g. gpt-4o-mini, llama3.1, qwen2.5. |
LLM_API_KEY |
— | API key; optional for local endpoints. |
LLM_TIMEOUT |
120s |
Timeout for a single LLM request. |
LLM_MAX_TOKENS |
4096 |
Completion budget per model turn. Raise it for reasoning models that think before answering. |
LLM_TEMPERATURE |
0.2 |
Sampling temperature. |
LLM_EXTRA_BODY |
— | JSON merged into every request for vendor-specific options, e.g. {"chat_template_kwargs":{"enable_thinking":false}} to turn off Qwen thinking on vLLM. |
LLM_MAX_TOOL_ITERATIONS |
8 |
Cap on tool-call rounds per message; the last round must answer in text. |
CATALOG_LLM_ENRICH |
false |
Use the LLM to categorise metrics the built-in rules can't. |
CATALOG_REBUILD_INTERVAL |
24h |
Periodic catalog rebuild; 0 disables. |
CATALOG_LABEL_SAMPLE_LIMIT |
2000 |
Max metrics whose label keys are sampled per build (the rest are sampled on demand). |
CATALOG_CONCURRENCY |
6 |
Parallel Prometheus calls during a catalog build. |
AUTH_PASSWORD |
— | Enables the sign-in screen. Unset = open instance. |
AUTH_API_TOKEN |
— | Bearer token for scripts and automation. |
SECRET_KEY |
auto | Signs sessions and encrypts stored passwords; generated into DATA_DIR/secret.key when unset. |
KNOWLEDGE_DIR |
$DATA_DIR/knowledge |
Markdown notes about your system for the agent (see below). |
DATA_DIR |
/data |
SQLite storage (catalog + dashboard). Mount a volume. |
PORT |
8080 |
HTTP port. |
LOG_LEVEL |
info |
Log level. |
Projects
One PromPilot instance can watch several Prometheus servers. Each project
is one Prometheus source with its own dashboard, metric catalog and notes;
switch between them from the project menu in the top bar, or address one
directly at /p/<slug>. Projects are created and edited in the UI (name,
URL, optional basic auth, with a connection test) or via /api/projects.
No Prometheus at hand? The dialog offers the public demo servers
(demo.promlabs.com, prometheus.demo.prometheus.io).
The PROMETHEUS_URL environment variable creates the first project,default, on first start.
A project holds any number of dashboards — create, rename, duplicate and
delete them from the top bar; each has its own address
(/p/<project>/d/<dashboard>), shared chat transcript and Grafana export.
Per-project notes live in knowledge/<slug>/; files directly in knowledge/
are shared by every project.
Teaching it your system
The agent knows what a metric is called; it doesn't know what it means to
you. Put Markdown notes in the knowledge/ directory (mounted into the
container as /data/knowledge) and they become part of the agent's context:
knowledge/prompt.md— standing instructions, injected into every
conversation: which team owns what, SLOs, preferred breakdowns, house rules.any other
knowledge/*.md— notes split by heading and indexed for search.
The agent searches them withsearch_knowledge, and the sections matching
your question are added to the prompt automatically.- \metric_name` — meaning` bullets attach a note to a metric; it shows
in the metric browser and in what the agent sees.knowledge/playbooks/*.md— procedures the agent runs on request ("Host
health check": four panels and a two-sentence verdict). They appear as
buttons above the chat composer.
Prefer clicking to editing files? The Notes tab edits a project's
instructions and documents in place (stored in the project's database; file
documents show read-only). And the assistant learns: when you tell it
something about your system — "this host is our CI runner", "checkout's SLO
is 300 ms" — it saves a note you can review and edit under Assistant notes.
Files are re-read whenever they change; no restart needed. The repository
ships notes and a playbook for the demo stack as an example. See
docs/knowledge.md.
Observing PromPilot itself
/metrics exposes Prometheus metrics (no auth): HTTP requests and latency per
route, chat requests by outcome, model turns and their latency, tool calls
by tool and result, catalog builds. The demo compose stack scrapes it, so
after a few chats you can ask PromPilot about PromPilot:
"how long do model turns take?".
Voice
Talk to it: a microphone in the composer, a speaker toggle that reads answers
aloud, and a voice button on the dashboard for a hands-free conversation —
press, talk, listen, repeat. By default this uses the browser's own speech
APIs and needs no service at all. For better quality or Firefox support,
plug in a provider: any OpenAI-compatible audio server (fully local with
Speaches + Kokoro), Gemini through a gateway, or ElevenLabs. See
docs/voice.md.
How the chat works
The model never draws anything. It works through a small set of tools —search_catalog, query_prometheus, emit_panel, patch_panel,remove_panel — and every panel it emits is validated against the panel
schema before it reaches the grid. If validation fails, the errors go back to
the model and it corrects the spec. The steps are shown in the chat as they
happen, so you can see which metrics it looked at and which PromQL it tested.
The conversation belongs to the dashboard, not the browser: it is stored
on the server, so a colleague opening the same dashboard sees what was
asked and what the assistant did, and open tabs pick up new turns within
seconds. GET /api/projects/<slug>/dashboards/<id>/chat/history returns
it; the trash icon in the chat clears it.
Any model that does function calling well works: OpenAI, Claude, Gemini,
open models on Ollama/vLLM, or whatever your gateway exposes. Claude and
Gemini can be used natively (LLM_PROVIDER=anthropic|gemini, with prompt
caching on Anthropic and Vertex AI support for Gemini) or through their
OpenAI-compatible endpoints; Azure OpenAI has its own provider. Reasoning
models are supported (their thinking is shown collapsed). Details and
per-provider examples: docs/llm-providers.md.
Security
Set AUTH_PASSWORD to require a sign-in (single shared password; scripts can
use AUTH_API_TOKEN). Without it the instance is open to anyone who can
reach the port — fine on a private network, not on the internet. Project
Prometheus passwords are encrypted at rest with SECRET_KEY (auto-generated
when unset). Chat messages and metric metadata are sent to the LLM endpoint
you configure. See docs/auth.md and SECURITY.md.
Known limitation: the container runs as uid 1000, so a bind-mountedDATA_DIR must be writable by that user (named volumes, as in the compose
file, just work).
Roadmap
Shipped so far: chat agent, four panel types (time series, stat, table,
gauge), Grafana export, metric catalog, projects with several dashboards
each, knowledge base with an in-app editor, playbooks, voice, sign-in, own
metrics.
Next: bar gauge and heatmap panels, Grafana dashboard import, an eval set for
the agent, additional datasources (Loki, VictoriaMetrics), more Prometheus
auth methods (bearer token, mTLS, tenant headers), OIDC. See
CHANGELOG.md.
Contributing
Contributions are welcome — see CONTRIBUTING.md for the
development setup. Adding a new panel type is a self-contained change and a
great first issue; see docs/adding-a-panel.md.
Acknowledgements
Icons by Lucide (ISC). Typefaces: Inter
and JetBrains Mono (OFL), bundled — the app
makes no requests to third-party servers.
License
Reviews (0)
Sign in to leave a review.
Leave a reviewNo results found