spoor
Health Uyari
- License — License: MIT
- Description — Repository has a description
- Active repo — Last push 0 days ago
- Low visibility — Only 5 GitHub stars
Code Basarisiz
- eval() — Dynamic code execution via eval() in internal/web/static/htmx.min.js
- new Function() — Dynamic code execution via Function constructor in internal/web/static/htmx.min.js
- exec() — Shell command execution in internal/web/static/htmx.min.js
- rm -rf — Recursive force deletion command in testdata/capture/all.sh
- rm -rf — Recursive force deletion command in testdata/capture/chatbots.sh
- rm -rf — Recursive force deletion command in testdata/capture/gemini-cli.sh
Permissions Gecti
- Permissions — No dangerous permissions requested
Bu listing icin henuz AI raporu yok.
Local-first LLM observability. Inspect agent traces, token usage, latency and estimated costs with one binary and one SQLite file.

spoor
See where your LLM and agent spend went.
One binary, one SQLite file, OpenTelemetry in. No account, no key, no cloud.


Try it · Send traces · What you see · Connect an agent · Operating · Limits
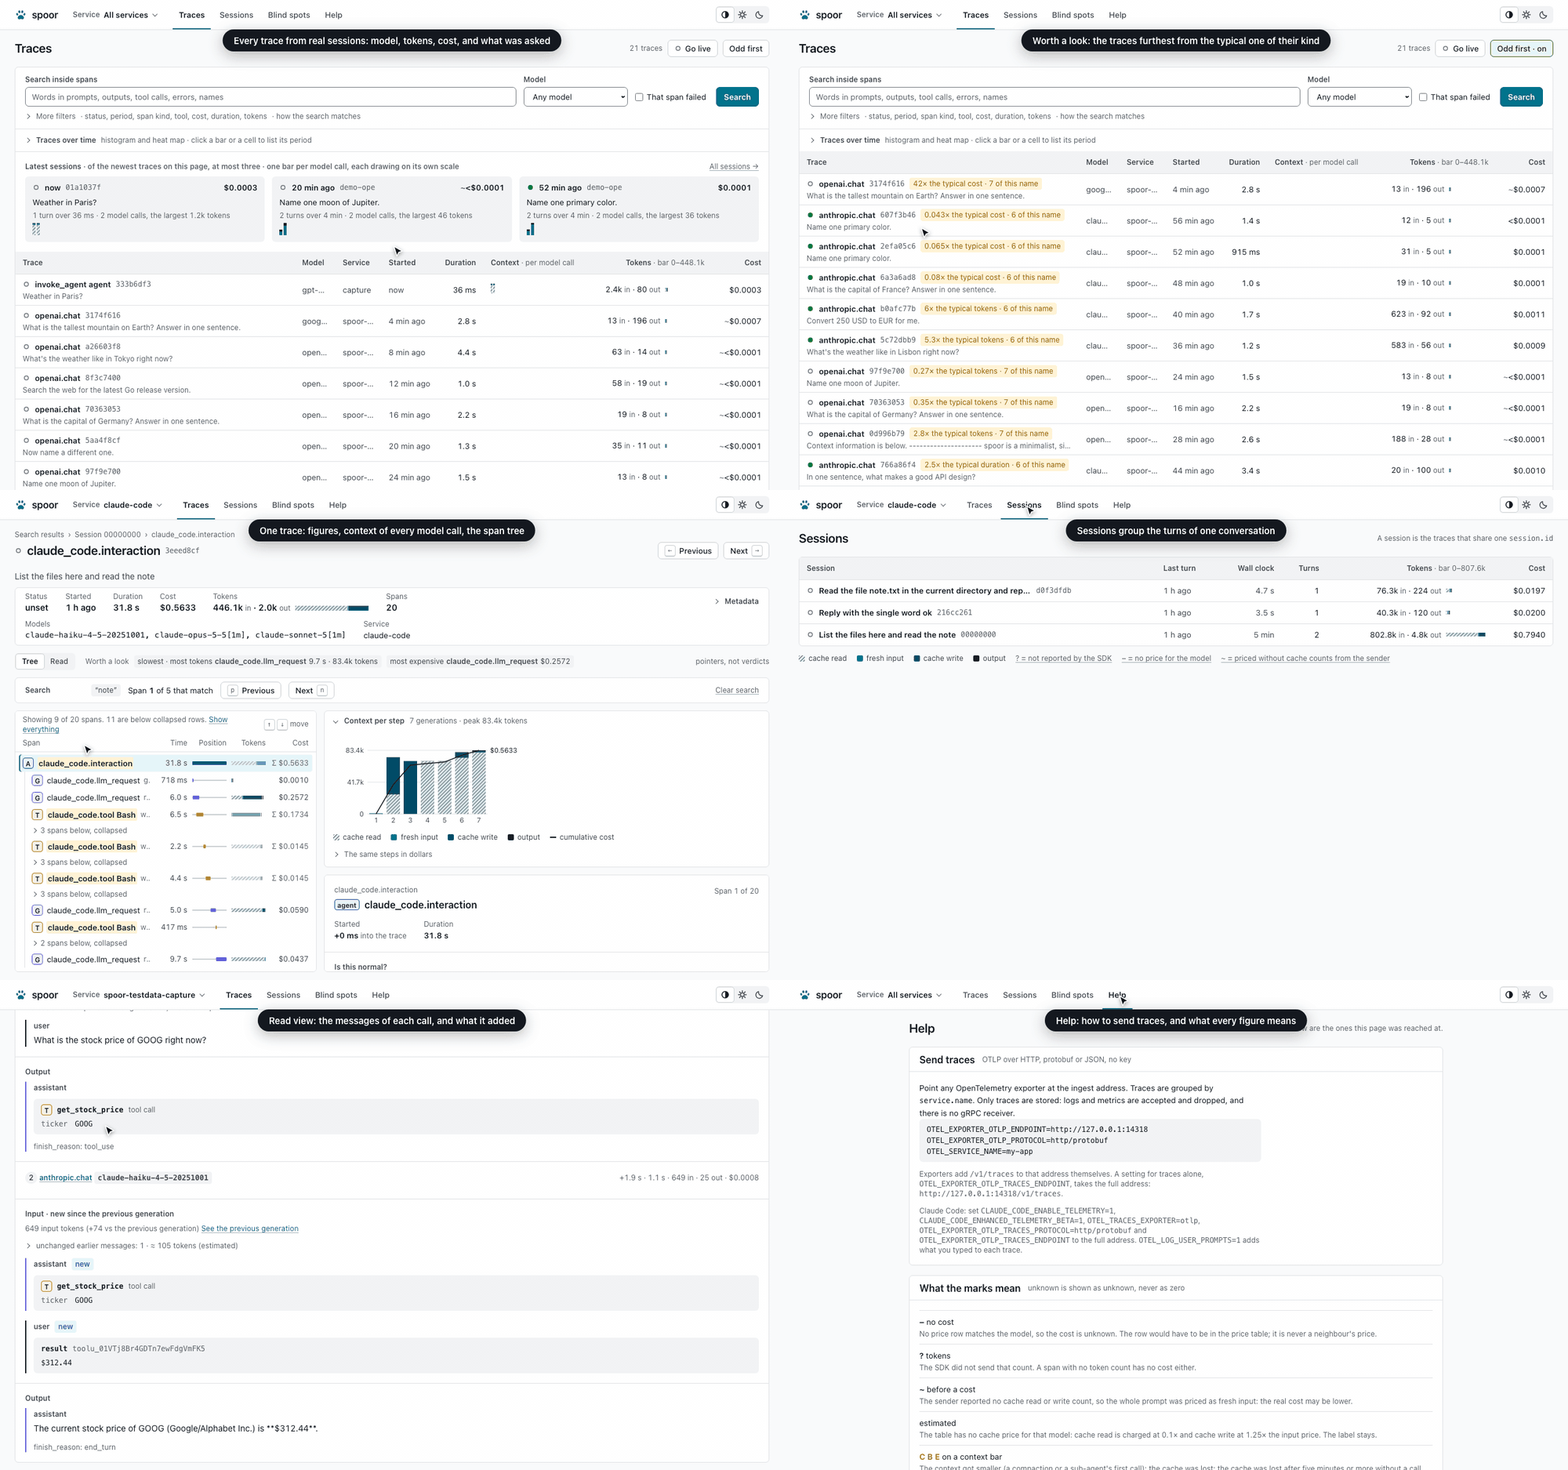
spoor receives OpenTelemetry traces from LLM applications and coding agents, stores them, and shows where the time, the tokens and the money went. Your agent can read the traces too.
What a bill cannot tell you
| Question | Where spoor answers it |
|---|---|
| Which call cost the money? | Every model call shows the arithmetic: tokens of each type times the price per million, and the price table row used. |
| Why did the prompt cache stop applying? | A call shows only the messages that are new since the previous one. When an earlier message was rewritten, spoor points at the character where it changed and shows the old and new text. |
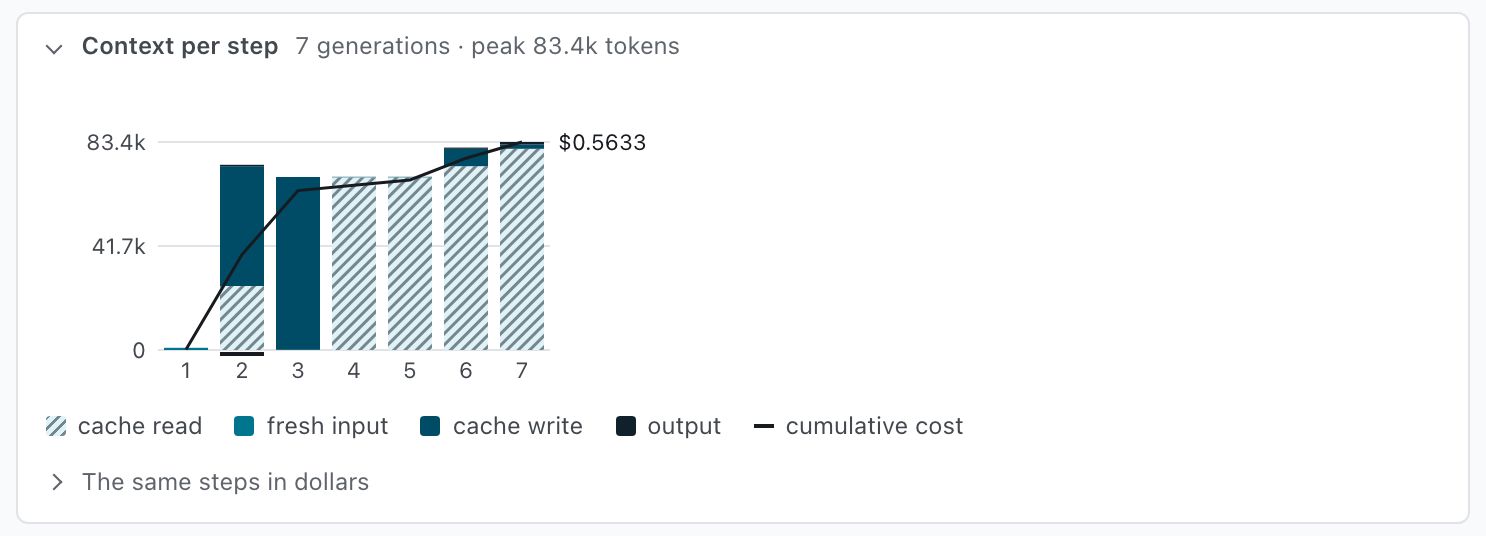
| Where did the context grow, and where was the cache lost? | One bar per model call shows the context of each step, split by cache read, fresh input, cache write and output; a compaction, a cache break and a cache expiry are marked on it, with the extra cost each one caused. |
| What did this turn really do? | A trace reads as a transcript: each model call, what it added to its context, its answer and the tools that ran before the next. |
| What does spoor not know? | A page counts what it stored but could not read, so a missing number is never mistaken for zero. |

One small thing
- One binary. Go, no cgo, no runtime dependency. Ingestion and UI run in the same process.
- One SQLite file. It is the storage, the backup unit and the read API: open it with
sqlite3, the schema is documented and stable. - Zero configuration.
spoor servestarts with nothing set: no key, no account, no project. - Reads what senders already emit. Claude Code's trace export, OpenLLMetry, OpenInference, the OpenTelemetry GenAI conventions, Pydantic AI, the Vercel AI SDK, LiteLLM, Gemini CLI and GitHub Copilot Chat in VS Code, each tested against real payloads.
- Honest numbers. Cost is priced per token type (input, cache read, cache write, output). A model with no known price shows no cost, not zero; an estimate is labelled "estimated".
- No outbound call, no telemetry. The price table ships in the binary; spoor never calls out.
- Your agent reads it too. A read-only MCP endpoint and a one-file HTML export, with nothing to install.
- Small enough to read. Under 10,000 lines, server-rendered pages, no JavaScript of its own: one person can read the whole thing in an afternoon.
Try it
With Docker, one command and nothing to install:
docker run --rm -p 127.0.0.1:8080:8080 -p 127.0.0.1:4318:4318 \
  ghcr.io/jhisse/spoor:latest demo --http :8080 --ingest :4318
Open http://127.0.0.1:8080. It is the same demo as spoor demo below, in a container that is removed when you stop it. To keep your own traces, see Docker.
Without Docker, download the archive for your system from the Releases page (Linux, macOS and Windows, amd64 and arm64; checksums.txt is beside them), unpack it and run:
./spoor demo # spoor.exe demo on Windows
spoor demo loads 21 traces from real sessions (Claude Code turns, a CrewAI crew, a LangGraph tool loop, multi-turn sessions), starts on loopback and prints the URL to open and a curl line that sends one more trace. The database is a temporary file removed on exit; --db <path> keeps it. If port 8080 or 4318 is taken, a free one is used.
Send traces
./spoor serve
This creates ./spoor.db, serves the UI on http://127.0.0.1:8080 and accepts traces on http://127.0.0.1:4318/v1/traces; Ctrl+C stops it. Point any OTLP/HTTP exporter at it:
OTEL_EXPORTER_OTLP_ENDPOINT=http://127.0.0.1:4318
OTEL_EXPORTER_OTLP_PROTOCOL=http/protobuf
OTEL_SERVICE_NAME=my-app
- No key. A credential header, if your exporter sends one, is ignored.
- HTTP only, protobuf or JSON, gzip or not. There is no gRPC receiver; many SDKs default to gRPC on port 4317, so set the protocol.
- Traces only.
/v1/logsand/v1/metricsanswer success and store nothing, so an SDK that exports all three logs no errors. service.nameis the grouping. Traces are listed and filtered by it.
To check the endpoint without an SDK, post the sample trace spoor itself serves, re-stamped to now:
curl -s http://127.0.0.1:8080/sample.pb | curl -X POST http://127.0.0.1:4318/v1/traces \
  -H "Content-Type: application/x-protobuf" --data-binary @-
Per-sender setup: Claude Code · OpenLLMetry · OpenInference (OpenAI, Anthropic, LangChain, LlamaIndex, OpenAI Agents SDK, CrewAI) · OpenTelemetry's OpenAI instrumentation · Vercel AI SDK · Pydantic AI · LiteLLM · Gemini CLI · GitHub Copilot Chat in VS Code · behind an OpenTelemetry Collector. What was tested, with versions.
Docker
docker run -d -v spoor-data:/data -e SPOOR_SQLITE_PATH=/data/spoor.db \
  -p 127.0.0.1:8080:8080 -p 127.0.0.1:4318:4318 ghcr.io/jhisse/spoor:latest
The image is built for linux/amd64 and linux/arm64; docker build -t spoor . makes the same one locally. Keep the volume: without it the database is lost when the container is recreated. The process runs as uid 65532, so a bind-mounted directory must be writable by that uid. Keep the 127.0.0.1: in both -p: neither port has authentication. The demo in the image is under Try it.
What you see
The trace list
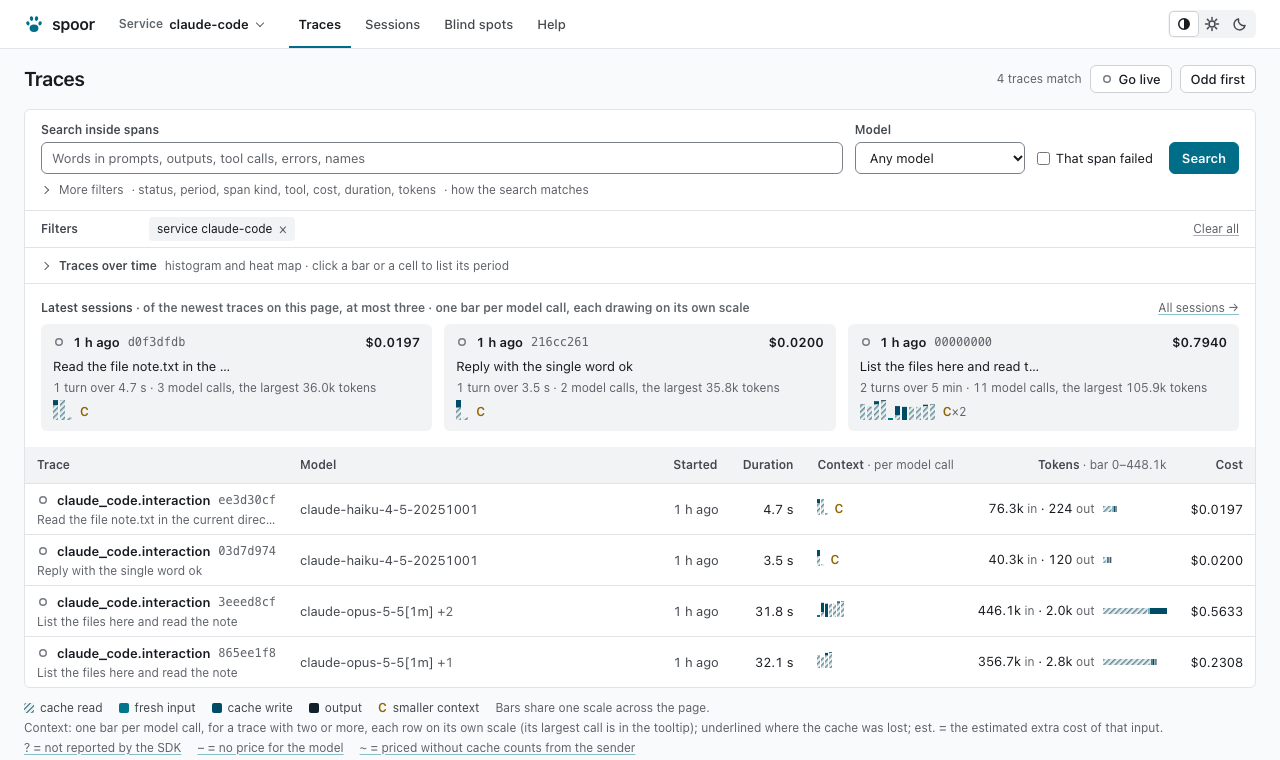
- One row per trace. The name, with what the person asked under it; the model that cost most, and how many others; service, start, duration, tokens and cost, with a token bar on a scale shared by the page. A trace with two model calls or more also shows its context per call: one small bar per call split into cache read, fresh input, cache write and output, marked where the context shrank or the cache was lost, with the estimated extra cost.
- Latest sessions. Above the list, the sessions the newest traces belong to (at most three), each named by its first prompt: turns, wall clock, cost, the largest call and the same drawing over the whole session.
- Search. One box finds the traces with a span that holds the words typed, in its name, input, output, metadata, error message or events (
"exact phrase"and-excludedwork). Each row shows the matching span and a snippet; opening it lands on that span with the words marked, andn/pstep through the others. - Filters. Service, status, time, model, span kind, tool, failed spans and ranges of cost, duration and tokens. Each is a removable chip and all are in the URL; an empty result says what dropping each filter would list. Behind "Traces over time", a histogram and a heat map of cost, duration or tokens: a bar or a cell is a filter.
- Live. Refreshes every 5 seconds and shows the spending rate: the cost of the traces started in the last 10 minutes as an hourly figure, with the traces that have no cost named rather than counted as free.
- Odd first. Reorders the newest 200 traces by how far each is from the typical trace of the same service and name among them (the largest ratio of its cost, duration or tokens to their median), each row saying which and by how much. A name with fewer than five traces has no typical trace and goes last.
The trace page
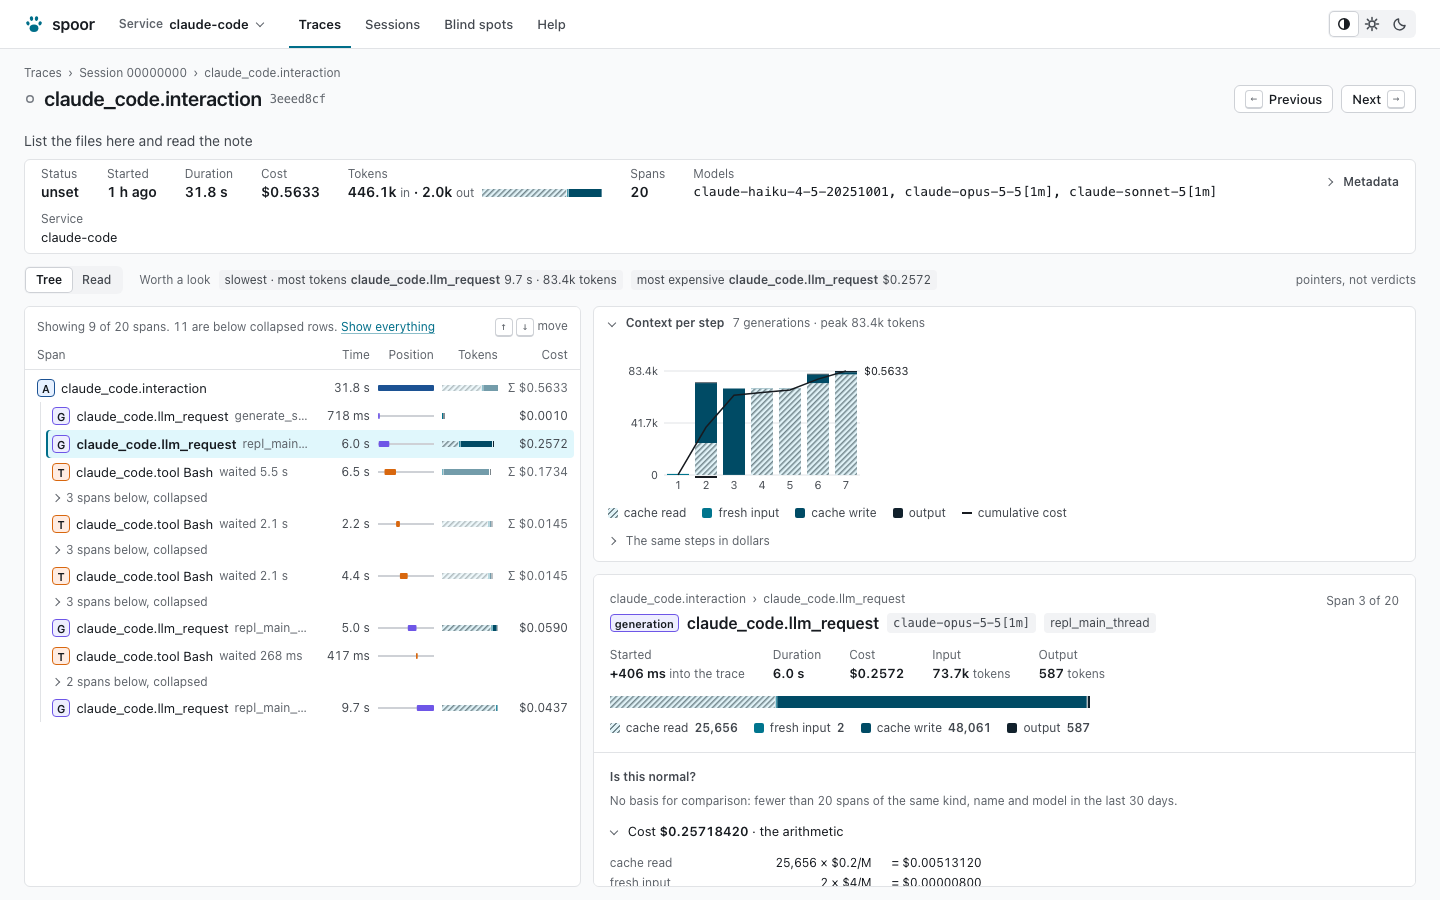
- Header. The name, with what the person asked under it; the figures; a Tree | Read switch with pointers worth a look beside it (the first failure, the slowest step, the most expensive one, the one with most tokens; a step that is several of these is one pointer with each reason).
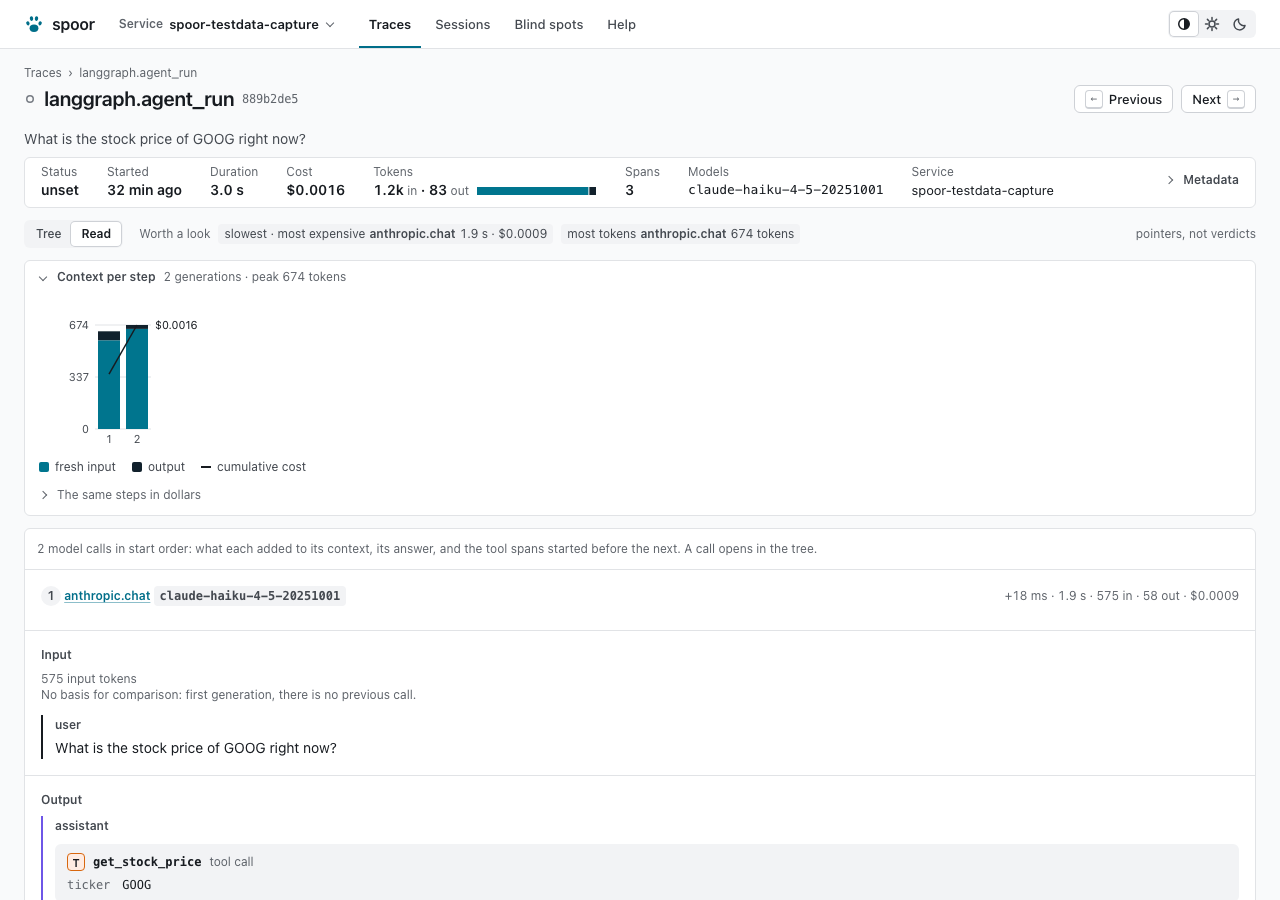
- Context per step. Open above the selected span: one stacked bar per model call (cache read, fresh input, cache write, output) with cumulative cost. A model call shows only the messages that are new since the previous one; when an earlier message was rewritten, the panel points at the character where it changed and shows the old and new text: a prompt cache can only be reused up to that character. This needs the sender to export the messages; Claude Code does not.
- The span tree and the selected span. Duration, position in time, tokens and cost on every row. The selected span shows its path from the root and its place ("Span 4 of 65"), its prompt and completion as chat messages, tool calls and results as cards, events, metadata as a tree, the arithmetic behind its cost, and how its duration compares with similar spans.
- Keyboard. On a wide screen the page fits the window, so the arrow keys move the selection and the page stays still.
Read view, sessions and blind spots
- Read view. Lays the model calls out as a transcript: what each added to its context, its answer and the tools that ran before the next, with the call's time, tokens and cost in the margin.
- Sessions. Traces that share a session id are one session, named by the first prompt of its first turn: a column per turn, the pauses between turns, work time apart from wall-clock time, cumulative cost.
- Blind spots. What spoor stores but cannot read, counted: traces without a root, spans without their parent, model calls without tokens, a model or a price, costs priced without cache counts, prompts not readable as messages. And what never reached storage: spans refused for a bad id, log and metric requests dropped, the retention in effect.
- Help. The addresses to send traces to, the keyboard shortcuts, how to connect an agent over MCP and the commands, with this server's own addresses filled in.
Light and dark themes. The only script is htmx, vendored.
Connect an agent
spoor serve answers the Model Context Protocol at POST /mcp on the UI port, read-only. Register it with Claude Code:
claude mcp add --transport http spoor http://localhost:8080/mcp
Any other client: Streamable HTTP at http://localhost:8080/mcp. The endpoint implements protocol revision 2026-07-28 and also answers initialize for clients of earlier revisions.
| Tool | What it returns |
|---|---|
list_traces |
Traces, newest first, one summary row each. Filters: service, status, since |
get_trace |
One trace and its spans in start order, with input and output. Long values are cut and the cut is reported |
search_spans |
Spans whose name, input, output, metadata, status message or events hold every word of a query ("phrase", -excluded) |
spoor hands over the record. It does not summarise it. Ask your agent what you would ask a colleague: which trace cost the most yesterday, which tool failed most, why a prompt got expensive.
From the command line
spoor export needs only SPOOR_SQLITE_PATH and can run while spoor serve is ingesting.
spoor export --trace <trace-id> > trace.jsonl          # one span per line
spoor export --session <session-id> > session.jsonl
spoor export --html --trace <trace-id> > trace.html    # one self-contained file to share
The Export button on a trace page and on a session downloads the same HTML page.
The database is one SQLite file; docs/schema.md documents its tables and columns for anyone who opens it with sqlite3.
Configuration
Environment variables: none is requiredEnvironment variables, or a .env file in the working directory (only SPOOR_* keys are read, and it never overrides a real variable). A value that cannot be parsed stops the start with a message naming the variable.
| Variable | Default | Effect |
|---|---|---|
SPOOR_SQLITE_PATH |
./spoor.db |
Database file. The only variable migrate, export and reprice read; demo reads none |
SPOOR_HTTP_ADDR |
127.0.0.1:8080 |
UI and MCP listener |
SPOOR_INGEST_ADDR |
127.0.0.1:4318 |
OTLP listener |
SPOOR_ALLOWED_HOSTS |
none | Extra hostnames (comma-separated) the UI answers under, besides loopback and the host in SPOOR_HTTP_ADDR |
SPOOR_RETENTION_DAYS |
unset: keep forever | Delete traces older than this many days. A whole number, 1 or more |
SPOOR_SWEEP_INTERVAL |
1h |
How often the retention sweep runs |
SPOOR_LOG_LEVEL |
info |
debug, info, warn or error |
Operating
Backup, upgrade, retention, exposing the ports, logs, pricesBackup. The database runs in WAL mode, so a plain copy of spoor.db can miss recent writes. With spoor running, use SQLite's own snapshot:
sqlite3 spoor.db ".backup backup.db" # or: sqlite3 spoor.db "VACUUM INTO 'backup.db'"
Upgrade. Replace the binary and start it. spoor serve applies pending schema migrations before it opens either port and logs the versions; spoor migrate applies them, loads the price table and exits. Each migration is one transaction that also records its version, so a process killed while migrating leaves the schema as it was and the next start applies that migration again.
Retention. Unset, spoor keeps everything. With SPOOR_RETENTION_DAYS=30, every SPOOR_SWEEP_INTERVAL spoor deletes each trace first stored more than 30 days ago, with all its spans. It applies to every trace and changing it needs a restart. The file does not shrink by itself: SQLite reuses the freed pages, and VACUUM with spoor stopped returns them.
Exposing the ports. Neither port has authentication, and both bind loopback by default (serve logs a warning for each one that does not). To reach spoor from another machine, set SPOOR_HTTP_ADDR or SPOOR_INGEST_ADDR only behind a VPN, a firewall or a proxy that authenticates, and list the name you open the UI under in SPOOR_ALLOWED_HOSTS, or every request is refused with 403. What spoor does and does not protect is in SECURITY.md.
Logs. Text lines on standard error. A request that failed inside spoor is logged at level error: internal error for a UI request answered 500, storage unavailable for an ingest request answered 503 (OTLP senders retry 503). GET /healthz on either port answers 200 while the database is reachable.
Prices. A span's cost is calculated when it is ingested, from a price table that ships in the binary (NOTICE). serve, demo and migrate load the table into model_prices at every start, in one transaction. serve logs how many stored spans were priced with older rows and spoor reprice recalculates them; run spoor reprice --dry-run first. A cost the sender reported itself is left alone.
Limits
spoor stores, shows and counts. It does not judge, and it will not grow into a platform.
| If you need | Look elsewhere because |
|---|---|
| Logins, roles, SSO, audit trails | spoor has no accounts and will not get them |
| Evaluations, datasets, experiments, prompt management | Out of scope, permanently |
| Alerts | There is no alerting engine |
| Logs and metrics | spoor stores traces only |
| High-volume concurrent ingestion | Everything is written to one SQLite file |
| A gRPC OTLP endpoint | Put an OpenTelemetry Collector in front |
Known gaps. The "what is new in this prompt" view needs the sender to export prompt content. The price table has one rate per model, so a Gemini Pro prompt above 200k tokens is priced at the base rate; the span's cost breakdown says so.
Contributing
AGENTS.md is the one file to read before changing code: the limits, the map of the code, the invariants and the checks.
Bug fixes, captured payloads and recipes are welcome; a new feature starts as an issue.
License
MIT, see LICENSE. Third-party data attribution is in NOTICE.
Yorumlar (0)
Yorum birakmak icin giris yap.
Yorum birakSonuc bulunamadi