agentfdr
Health Warn
- License — License: MIT
- Description — Repository has a description
- Active repo — Last push 0 days ago
- Low visibility — Only 5 GitHub stars
Code Fail
- exec() — Shell command execution in src/assert.js
- process.env — Environment variable access in src/cli.js
- exec() — Shell command execution in src/codex.js
- exec() — Shell command execution in src/detect.js
- exec() — Shell command execution in src/discover.js
- process.env — Environment variable access in src/discover.js
- process.env — Environment variable access in src/i18n.js
Permissions Pass
- Permissions — No dangerous permissions requested
No AI report is available for this listing yet.
Flight data recorder for local coding agents — dissect why Claude Code looped, drifted, or burned tokens. Zero instrumentation, local-first.

agentfdr
Flight data recorder for local coding agents.
When Claude Code or Codex CLI loops, drifts off-goal, or quietly burns two million tokens,agentfdr shows you why — turn by turn, after the fact.


Quick start
npx agentfdr
That's the whole setup. Your sessions are already recorded — Claude Code writes a full transcript of every session to ~/.claude/projects/, and OpenAI's Codex CLI records rollouts to ~/.codex/sessions/. agentfdr auto-discovers both and turns them into something a human can investigate.
Zero instrumentation. Zero cloud. Zero config. Nothing is sent anywhere; the viewer binds to 127.0.0.1 and reads files you already have.
If agentfdr showed you something you didn't know about your sessions, a ⭐ on this repo helps other agent users find it.
Features
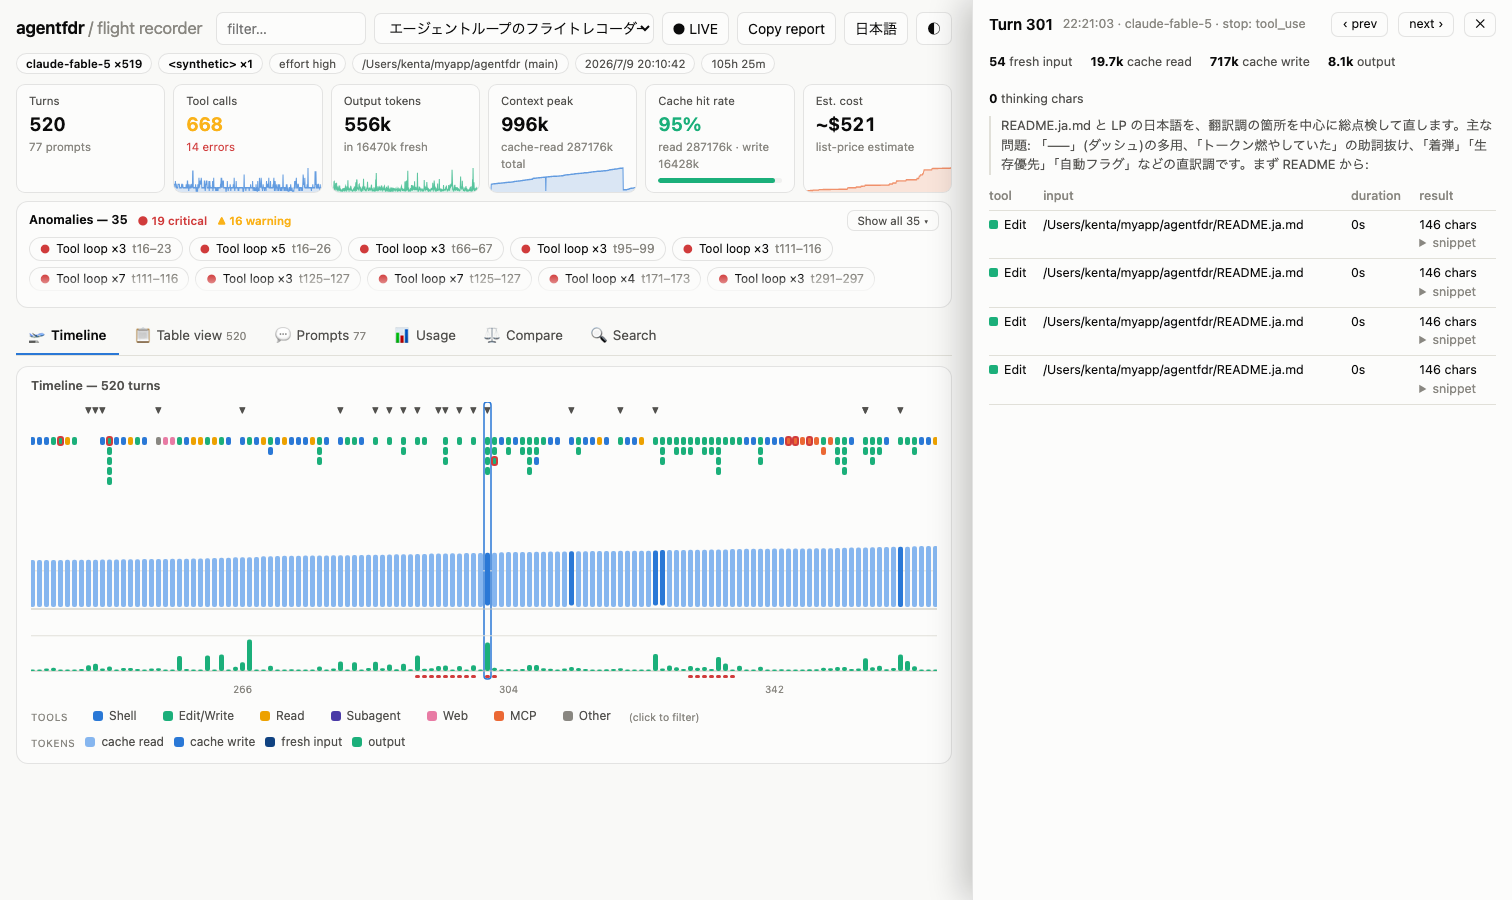
- 🛫 Timeline viewer — one screen for the whole session: every turn's tool calls, context-window composition, and output tokens, with prompt and compaction markers
- 🤝 Two agents, one cockpit — Claude Code and OpenAI Codex CLI sessions, auto-discovered and investigated with the same timeline, detectors, search, and diff
- 🔎 Full-text search —
agentfdr search(and the Search tab) finds any prompt, assistant reply, tool call or result across every session, and jumps to the exact turn - 🔍 Turn dissection — resizable side panel with usage breakdown, assistant text, and every tool call's duration, result size, and snippet; step with ←/→
- 🚨 Anomaly detection — tool loops, error streaks, context bloat, token spikes, cache thrash, file churn, and refusals, flagged automatically
- 📡 Live watch mode —
agentfdr watchfollows a session that's still running - 📊 Plan usage — 5-hour window / daily / weekly burn across all projects, a 12-month activity heatmap, plan-tier auto-detection, and calibratable budgets with warning bars
- 💸 Cost estimation — estimated USD per session and per model, from list prices
- 🚦 CI gate —
agentfdr assert --no-loops --max-tokens 2Mexits 1 on violation - 📋 Markdown autopsy —
agentfdr blamerenders the analysis ready to paste into an issue - 📤 Shareable session card — one click exports a PNG summary (cost, tokens, cache hit rate, anomalies, the context curve) sized for X/socials
- ⚖️ Session diff —
agentfdr diff(and the Compare tab) puts a failed attempt next to the successful retry: stats, anomalies, tool mix, and which files each one touched - 🌗 Dark/light, 🌏 English/Japanese, in both the viewer and the CLI
- 🔒 Local-only — no telemetry, no account, no runtime dependencies (Node ≥18 stdlib)
Why
Autonomous agent failures are hard to debug because the evidence is gone by the time you notice:
- The loop — edit → test fails → same edit, for 40 minutes
- The drift — you asked for a bugfix, it refactored the router
- The burn — a huge tool result crowds the context, cache stops hitting, every turn re-reads 200k tokens
- The bad landing — "Done!" with failing tests, or no stop at all
Existing LLM observability tools (LangSmith, Langfuse, AgentOps) assume you instrument your own app with their SDK and send traces to their cloud. A prebuilt local agent like Claude Code offers no instrumentation point — but it doesn't need one. The data is already on disk. What's missing is the crash investigator's toolkit. This is that toolkit.
Zooming out: working with coding agents is becoming loop engineering. You no longer just prompt a model — you design and operate an agent loop, and the harness (Claude Code and friends) decides what enters the context, which tools fire, and when to stop. Improving that loop takes feedback, and you can't engineer a loop you can't see. agentfdr is the instrument panel: it turns every looping, drifting, token-burning run into a lesson instead of a mystery.
Commands
agentfdr                    # open the newest session's timeline in your browser
agentfdr list               # all recorded sessions across all projects
agentfdr open 35cb18        # open a session by id prefix (or path to a .jsonl)
agentfdr watch              # same, but live: the timeline follows the running session
agentfdr blame 35cb18       # markdown autopsy — paste it into an issue
agentfdr diff 35cb18 9af7ec # compare two sessions: failed attempt vs retry
agentfdr search "login bug" # full-text search across every session
agentfdr stats              # token totals + estimated cost per project
agentfdr usage              # plan usage: 5h window / daily / weekly burn
agentfdr assert --no-loops --max-tokens 2M   # CI gate: exit 1 on violation
Options: --port <n> (auto-falls-back if taken), --no-browser, --json, --lang en|ja (auto-detected from LANG).
assert checks (any combination; exit code 1 if one fails): --no-loops, --no-critical, --max-errors <n>, --max-turns <n>, --max-tokens <n> (fresh input + cache write + output; accepts 500k / 2M), --max-cost <usd>.
The viewer
The dissection panel lives on the right (always visible on wide screens; slides in on narrow ones) — click a turn and it fills in, and the timeline stays visible so you can step through turns (←/→, Esc deselects) without losing your place. Drag the panel's left edge to resize it; the width persists. While no turn is selected, the panel shows a session overview: the tools that did the work and the most-edited files.
Tabs switch the main view: Timeline / Turns / Prompts / Usage / Compare / Search; clicking a prompt, an anomaly chip, or a search hit jumps back to the timeline at that turn. The filter box in the header narrows the session dropdown across all projects. Click a tool color in the legend to filter the tools lane. Copy report puts the blame markdown on your clipboard; 📤 Card exports the session as a shareable PNG summary card; ● LIVE re-fetches while the session is still running (on automatically via agentfdr watch). Language and theme toggles are in the header; everything persists, and any view is deep-linkable (?theme=dark&tab=usage&sel=95).
Session readout — the header line lists every model that produced a turn (with per-model turn counts when the session switched models), the number of fast-mode turns, and the effort level. A caveat on effort: it is not a structured field in the transcript, so it's recovered from /effort command output and only appears when the level was set during the session.
Cost estimate — each session (and stats/blame) shows an estimated USD cost computed from list prices per model, with cache reads at ≈0.1× and cache writes at ≈1.25× the input price. It's an estimate: discounts, batch tiers, and price changes aren't visible in the transcript. Unknown models are excluded and flagged.
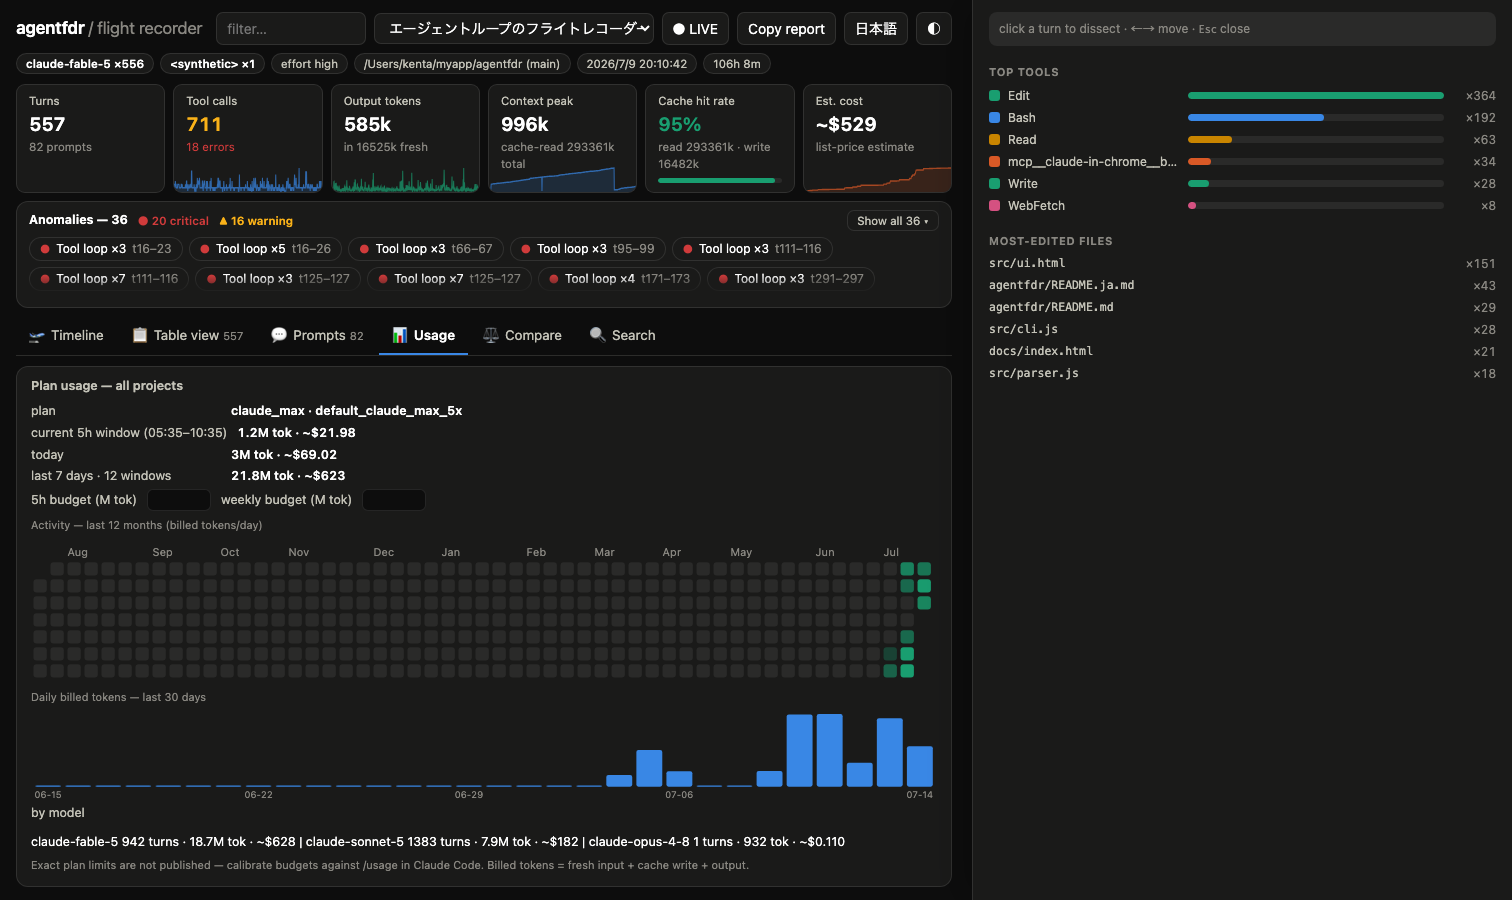
Plan usage — agentfdr usage (and the Usage panel in the viewer) aggregates every project's transcripts into the same shape your subscription is metered in: the current 5-hour rolling window, per-day history, and the rolling week, plus a per-model breakdown. Your plan tier (e.g. claude_max · default_claude_max_5x) is read from Claude Code's local config. Anthropic doesn't publish exact token limits, so you set your own budgets (--budget-5h / --budget-week, env AGENTFDR_BUDGET_5H / AGENTFDR_BUDGET_WEEK, or inputs in the viewer) and calibrate them against Claude Code's /usage screen — agentfdr then shows % consumed with warning colors.
Anomaly flags
Heuristics that answer "where do I look first?":
| Flag | Meaning |
|---|---|
loop |
The same tool-call sequence repeated 3+ times consecutively |
error-streak |
3+ consecutive tool calls failed |
context-bloat |
A single tool result ≥50k chars landed in context |
token-spike |
Context jumped >60% (+50k) in one turn |
cache-thrash |
Consecutive turns paying full price, zero cache hits |
file-churn |
The same file edited 6+ times |
refusal |
A turn ended with stop_reason: refusal (safety decline) |
stalled-call |
A tool call never returned a result while the session moved on |
api-error |
A failing tool result carried an upstream API error (rate limit, overloaded, quota) |
custom |
Your own regex rules from .agentfdr.json (see below) |
Configuration
All detectors are tunable via .agentfdr.json (looked up as --config <path> → ./.agentfdr.json → ~/.agentfdr.json). JSON rather than YAML keeps the zero-dependency promise. A malformed config is a hard error — a CI gate must never run with half its rules silently dropped.
{
  "thresholds": { "loopRepeats": 5, "contextBloatChars": 100000 },
  "disable": ["cache-thrash"],
  "suppressLoops": ["Bash:npm test", "Edit:*"],
  "custom": [
    { "name": "quota-masked", "match": "quota exceeded|monthly limit",
      "in": "tool-results", "severity": "critical" }
  ]
}
thresholds— override any detector threshold (loopRepeats,loopMinCalls,loopRetryRepeats,errorStreak,contextBloatChars,tokenSpikeTokens,tokenSpikeRatio,cacheThrashTurns,fileChurnEdits).loopRetryRepeats(default 6) is the bar for loops shaped like ordinary iteration — edit↔verify alternation, or a test/build/lint idiom repeating — vs.loopRepeats(default 3) for everything elsesuppressLoops— tool signatures whose repetition is legitimate (retrying a test, polling a build); exact match orprefix*disable— turn whole detectors offcustom— your own regex rules over tool results and/or assistant text (in:tool-results|assistant-text|both), surfaced as first-class flags in the viewer, blame report, andassert
How it works
Claude Code appends every event of a session — user prompts, assistant messages with full token usage, tool calls, tool results, compaction, mode changes — to a JSONL transcript under ~/.claude/projects/<project>/<session-id>.jsonl. Codex CLI does the same with rollout files under ~/.codex/sessions/YYYY/MM/DD/. agentfdr sniffs the format per file, parses both into one normalized turn model, and runs the same detectors over it. That's it: no daemon, no database, no runtime dependencies (Node ≥18 standard library only).
Neither transcript format is a published API, so the parsers are written to survive them: unknown line types become meta events, malformed lines are counted and skipped, and each format's quirks are contained in its own adapter module. Data locations can be overridden with AGENTFDR_CLAUDE_DIR / AGENTFDR_CODEX_DIR. (Plan usage tracks your Claude subscription and stays Claude-only.)
Privacy
Transcripts contain your code, your prompts, and your file paths. Therefore:
- everything runs locally; the server binds to
127.0.0.1only - there is no telemetry, no phone-home, no account
blameoutput goes to stdout — you decide what leaves the machine
Roadmap
- Watch mode (
agentfdr watch) with live timeline - CI gate —
agentfdr assert --no-loops --max-tokens 2M - Cost estimation from per-model list prices
- Session diff — compare the failed attempt with the successful retry
- Pluggable detector rules — thresholds, suppressions and custom regex rules via
.agentfdr.json - Codex CLI adapter — rollouts under
~/.codex/sessionsare auto-discovered - Loop-detector precision: interleaved edit↔verify cycles and test/build/lint idioms need more repeats before flagging — noise reduction, not exemption, so a session still stuck past that point is still caught
- Convergence annotation on loops (worded as a hint, never an all-clear) — after the false-positive rate is boring
- Intent-drift detection — flag the turn where the tool/file footprint diverges from what the prompt asked for
- Subagent/sidechain tree rendering
Development
git clone https://github.com/kamihork/agentfdr.git && cd agentfdr
npm test                 # run tests
node bin/agentfdr.js     # run the CLI from source
src/ui.html is served fresh on every request — edit it and reload the browser, no restart needed.
Contributions welcome — especially new detector heuristics and viewer improvements. See CONTRIBUTING.md.
License
Reviews (0)
Sign in to leave a review.
Leave a reviewNo results found