token-history
Health Uyari
- License — License: MIT
- Description — Repository has a description
- Active repo — Last push 0 days ago
- Low visibility — Only 5 GitHub stars
Code Gecti
- Code scan — Scanned 12 files during light audit, no dangerous patterns found
Permissions Gecti
- Permissions — No dangerous permissions requested
Bu listing icin henuz AI raporu yok.
Token usage is the next contribution graph — snapshot yours to git daily, show it anywhere as self-updating SVG charts & badges. Claude Code + Codex, more to come.

token-history
Never lose your AI-coding history —
snapshot it to git daily, chart it a dozen ways, show it anywhere.











Copy this repo and every chart on this page becomes yours. A GitHub profile already carries two name cards — the contribution graph for how much you code, the star count for what others make of it. Your AI token usage is becoming the third: a day-by-day record of how much you actually build with AI. This repo turns yours into one you own:
- Snapshots your usage into git, daily. AI coding tools keep usage data only on your disk and quietly expire it — history you don't persist is history you lose. Every number lands in git before that happens, permanently yours.
- Renders a whole gallery of SVG charts and badges — self-updating, and embeddable in a GitHub profile README, a blog, or anywhere an
<img>tag works. - Merges every machine and every source. Multiple hosts combine into one history; Claude Code and Codex are the first two sources (riding on ccusage), with more models and feeds on the roadmap.
- Sets itself up through your agent. Hand Claude Code or Codex one link and say "set this up" — it walks itself from fork to first push.
The repo keeps a day-by-day history; the headline chart shows the last 30 days, and every render also produces an entire gallery of other styles across daily, weekly, and monthly granularity.

Contents
- Contents
- Why this exists
- Quick start
- Chart gallery
- How multi-host works
- How it stays correct
- Layout
- Design notes
- Thanks
- License
Why this exists
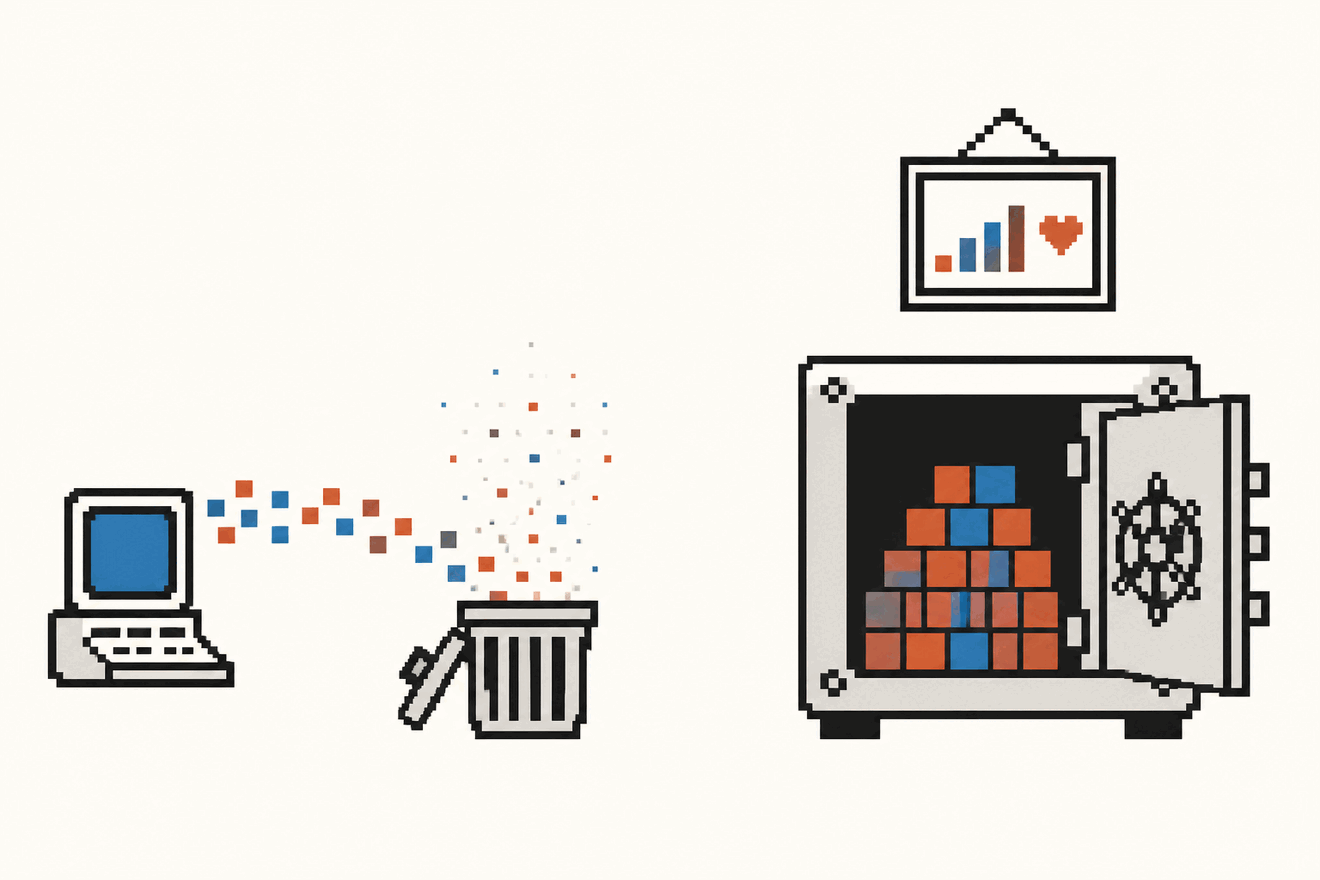
- Usage data disappears. AI coding tools keep it only on your disk, on a rolling delete. What you don't persist, you lose — permanently.
- The record is becoming reputation. The contribution graph and the star count are the name cards developers already show; a day-by-day history of how much you build with AI is next. Git makes it permanent — and yours.
- Visualized, it goes anywhere. Once rendered to SVG, your usage can be embedded in any README, blog, or site — and this repo ships a whole gallery of good-looking styles to pick from.
Quick start
[!IMPORTANT]
Fork first. This repo holds my data — you need your own copy to push yours into. Cloning this repo directly gives you nowhere to commit.
🤖 For agents (recommended)
Hand your coding agent — Claude Code, Codex, whatever you drive — this one link and say "set this up on my machine":
https://raw.githubusercontent.com/keli-wen/token-history/master/SETUP.md
SETUP.md walks the agent through fork → configure → backfill → render → schedule → first push, with verification steps at each stage.
🧑 For humans
Prerequisites: Node (for npx ccusage) and uv (curl -LsSf https://astral.sh/uv/install.sh | sh — no uv? plain python3 ≥ 3.9 works too).
# 1. Fork this repo on GitHub (button top-right), then clone YOUR fork
git clone https://github.com/<your-username>/token-history && cd token-history
cp config.example.json config.json     # set "host" to a neutral alias like mac-a

# 2. Backfill, render, publish
uv sync                                # one-time: provisions the pinned Python + .venv
./scripts/run.sh collect --all         # grab everything ccusage still has
./scripts/run.sh render                # build every chart locally
git add -A && git commit -m "first snapshot" && git push

# 3. Keep it running (macOS)
./scripts/install-launchd.sh           # 00:30 / 12:00 / 21:00 + every login
Not on macOS, or prefer a different trigger? The collector is self-contained, idempotent, and backfills its own gaps — anything periodic works: cron, a systemd timer, or running it by hand. The scheduler is not load-bearing.
How uv is used hereThis is a standard uv project: pyproject.toml declares the (empty — everything is stdlib) dependency set, .python-version pins the interpreter, and uv.lock is committed. uv sync materialises that into .venv, and uv run re-syncs automatically — so your terminal, the launchd job at 00:30, and CI all run the exact same Python instead of whatever python3 happens to be ambient. run.sh is a thin wrapper over the same thing (it survives launchd's minimal PATH); uv run scripts/render.py works directly too. Without uv, run.sh falls back to plain python3 (≥ 3.9) — zero dependencies makes that a real path, not a courtesy.
To show the charts elsewhere, reference the raw URLs:


The URL is stable — no cache-busting query, no write access to your profile repo, nothing to maintain. The tradeoff is that GitHub's CDN may serve a slightly stale image for a few hours. With one data point per day that is invisible.
Chart gallery
Every run renders every style below — the same data, over a dozen ways. This section is deliberately fully expanded: it doubles as a catalog to pick from and as a live test of how each SVG actually behaves inside GitHub's README renderer (light/dark via prefers-color-scheme, CSS load animations, font fallbacks). In practice you'd embed just one or two in your own profile README:

charts/tokens.svg and charts/cost.svg remain stable aliases of the daily bars, so existing embeds never break. Colors and type follow Anthropic's palette (orange = Claude Code, blue = Codex), tuned per mode to pass a color-vision-deficiency check.
Badges
charts/badge/*.svg — live shields.io-style stats, rendered from the same data. Inline-sized: drop any of them on a single line of your profile README.



charts/badge/pixel-*.svg — the same stats as stair-cornered 8-bit arcade chips, every glyph pixel-drawn:





…and an 18px small variant of each (badge/pixel-*-sm.svg) that sits inline with regular shields badges:


Daily
charts/day/pixel-card.svg — the last 30 days as an 8-bit game HUD: a bitmap-font HI-SCORE, Claude vs Codex as player HP bars, cost as a coin counter, one pixel heart per active day

charts/day/bar-tokens.svg — flat daily bars (also published as charts/tokens.svg, the stable legacy URL)

charts/day/bar-cost.svg — the same bars in API-equivalent dollars (also published as charts/cost.svg)

charts/day/calendar-tokens.svg — contribution-style calendar heatmap

charts/day/area-tokens.svg — smoothed stacked area with an animated reveal

charts/day/card.svg — hero-number stat card for the last 30 days

charts/day/pixel-tokens.svg — 8-bit pixel bars: every square is 10M tokens on a crisp retro grid, with a blinking cursor on the day still in progress
charts/day/pixel-models.svg — the same columns, split by model. Each source keeps its own hue and encodes the tier twice, in lightness and in how much of the square is filled — solid, notched, hollow — so the top tier reads even in greyscale (Claude fable › opus › sonnet, Codex 5.5/Sol › Terra › Luna)

charts/day/terminal-tokens.svg — the last 30 days as a terminal session: an htop-style bar per day, a CLI-style TOTAL sign-off, and a blinking cursor

charts/day/sketch-tokens.svg — an xkcd-style hand-drawn take: two wobbly ink lines, hand-lettered labels, and a scribbled circle around the day the agents took over

Weekly
charts/week/bar-tokens.svg — weekly bars

charts/week/bar-cost.svg — weekly API-equivalent dollars

charts/week/ledger-tokens.svg — editorial ledger, newest week on top

Monthly
charts/month/bar-tokens.svg — monthly bars

charts/month/bar-cost.svg — monthly API-equivalent dollars

charts/month/calendar-tokens.svg — a calendar page for the current month

How multi-host works
Each machine reads only its own local logs and writes to its own directory:
data/mac-a/2026-08-04.json     ← machine A only ever writes here
data/mac-b/2026-08-04.json     ← machine B only ever writes here
Two machines never write the same path, so there is no merge conflict to resolve and no cross-machine deduplication to get wrong. Merging is just addition at render time.
[!IMPORTANT]
This relies on the machines' log directories being disjoint. Do not sync~/.claudeor~/.codexbetween machines via iCloud, Dropbox, Syncthing, or a restored backup — both machines would then see the same sessions and the totals would double. Because ccusage reports daily aggregates rather than session IDs, this repo cannot detect that from the data.
How it stays correct
- Idempotent. Re-running for a day overwrites that day. Safe to trigger as often as you like.
- Self-healing. Every run re-collects a recall window (
clamp(days since last success + 2, 3, 21)), so a laptop that was off for a week backfills itself on the next run. - Non-destructive for old days. Beyond 7 days, values may only grow. If Claude Code has already cleaned up part of a day, a fresh read returns a smaller number — overwriting would silently corrupt a correct record. A missing day is visible; a shrunken one is not.
- Version-stamped. Every file records the ccusage version that produced it. ccusage v15 under-reported output tokens by ~38% relative to v20; if a future upstream change moves the numbers again, the step in the series will be traceable instead of mysterious.
- No empty commits. Nothing is committed when nothing changed. Costs are rounded on write, so float noise (~1e-13) doesn't manufacture a diff.
- Honestly labeled. The dollar figures are API-equivalent value at published rates — what the usage would be worth, not money spent on a subscription plan.
- Nothing identifying recorded. No project names, paths, branches, prompts, or real hostnames — only per-day token counts and model names, under an alias you choose.
config.jsonis gitignored so the alias-to-machine mapping stays local.
Layout
config.example.json          copy to config.json, set your host alias
pyproject.toml, uv.lock      uv project: zero dependencies, locked anyway
.python-version              interpreter pin (3.12, provisioned by uv)
scripts/
  run.sh                     entry point: uv if present, python3 otherwise
  collect.py                 ccusage → data/<host>/<date>.json
  render.py                  data/ → charts (every style) + SUMMARY.md
  install-launchd.sh         macOS scheduling (--uninstall to remove)
data/<host>/<date>.json      one file per host per day
charts/tokens.svg, cost.svg  the two headline charts (stable URLs)
charts/{day,week,month}/     the style gallery, all regenerated by CI on every data push
contexts/                    design decisions and the research behind them
.github/workflows/render.yml re-renders on every push that touches data/. Push-triggered rather than scheduled: GitHub's docs acknowledge that scheduled workflows can be delayed, dropped under load, and auto-disabled after 60 days of inactivity. None of that applies to a push trigger, and the charts update the moment data lands.
Design notes
Everything non-obvious in here has a written reason — measured on real data, not assumed. See contexts/:
decisions.md— what was chosen and whydata-sources.md— schemas, dedup, retention, the ccusage version storypipeline-and-scheduling.md— layout, idempotency, git, launchd, chart constraints
Thanks
All parsing credit goes to ccusage — the de-facto standard for reading local AI-CLI usage logs, supporting ~15 coding CLIs. This repo deliberately does not second-guess it; it adds the persistence, merging, and charts on top.
Contributions welcome — new data sources and new chart styles alike. A style is a single drop-in module in scripts/styles/ exposing build_all(days, generated); see the existing ones for the contract.
License
MIT
Yorumlar (0)
Yorum birakmak icin giris yap.
Yorum birakSonuc bulunamadi